
Abstract
A systematic real-time methodology is adopted for leak detection in underground buried pipes. The wireless communication system is used to analyze the system performance based on the received power by monopole antenna deployed at the receiving side. Instrumentation designed for underground measurement and control such as leak and materials loss detection needs wireless communications to aboveground in both ways and in real-time mode. This constitutes one of the timely and challenging issues of battery-operated systems. The purpose of this work is to characterize the radio transmission between underground buried pipes and base station using multi-layer media including both theoretical and experimental approaches by utilizing various modulation schemes. The objective is to identify the range of operating communication frequencies having lower energy loss, lower resulting bit error rate, and the power needed to transfer packets designed to carry data through the media. This will support the on-device power management to secure large autonomy operations. Experimental tests have shown that the overall received energy was mixed with ambient energy if the latter is sent at the same frequency and that the optimum frequency range used to transmit energy was rather at low frequency range of 100–200 MHz.
Introduction
Wireless sensor networks (WSNs) are not only needed in ambient air but also in underground environments with a major issue related to wireless transmission through media. Wireless underground sensor networks (WUSN) consist of wireless sensors buried underground, enabling a wide variety of novel applications that are not possible using current wired underground monitoring techniques. Compared with the current underground sensor networks, which use wired communication methods for network deployment, WUSN have several remarkable merits, such as concealment, ease of deployment, timeliness of data, reliability, and coverage density. 1 WUSN technology is applicable to many application scenarios. 1 Among these, water leak detection of buried pipelines, 2 material loss detection in pipes, monitoring the soil properties of sports fields, such as a golf course and football fields, have potentials to ease the maintenance of these infrastructures. Moreover, WUSN can be exploited to monitor the presence and concentration of various toxic substances in particular areas to prevent pollution. In addition, WUSN can be exploited in underground coal mines to monitor air quality and prevent disasters.
Some work has been done on wireless underground/underwater communications. Major technological issues and challenges associated with structural monitoring of underground structures with emphasis on conditions encountered in underground communications were previously discussed. 1 Focus has been made on the electromagnetic (EM) wave propagation through soil and rock for ground-penetrating radars in Vuran and Akyildiz. 3 Communication through soil is regarded as an EM wave transfer through the transmission line, 4 and microwave analysis methods are exploited to provide a propagation model. The results of this work in Li et al. 4 focus on the frequency range of 1–2 GHz. A comparative analysis was carried out for statistical wireless channel propagation characteristics 5 in underground mines and indoor channels. A detailed survey on ray-theory-based multipath Rayleigh underwater channel models for underwater wireless communication was presented, 6 and the research challenges for an efficient communication in this environment were outlined. These channel models are valid for shallow or deep water. Advanced channel models were derived to characterize the underground wireless channel in Domingo, 7 and the foundational issues for efficient communication through soil were discussed. Routing algorithms 8 were proposed for better management for underground WSNs in three-dimensional underground tunnels and analyzed in terms of network throughput, packet loss rate (PLR), stability, and latency using simulations.
Design challenges for WUSNs and challenges for the underground communication channel were also studied in detail, 9 and a relay node placement was proposed in Wu et al. 10 Despite its potential advantages, 11 the realization of WUSN is challenging with efficient and reliable underground links to establish multiple hops underground and efficiently disseminate data for seamless operation. To this end, the propagation characteristics of EM waves in soil prevent a straightforward characterization of underground wireless channel. First, EM waves encounter much higher attenuation in soil compared with that in air, which severely hampers the communication quality. Moreover, the surface of the ground causes reflection as well as refraction, which prevents simple ray models characterizing the underground channel accurately. Multipath fading is an important factor in underground communications, where unpredictable obstacles in soil such as rocks and roots of trees make EM waves being refracted and scattered. Since underground communications and networking are primarily limited by the wireless channel capabilities, these challenges caused by underground channel should be carefully considered for the design of WUSN. None of the work in literatures1–9 addresses all these issues and lacks in developing a generalized model to validate the simulation with real experimental data.
This article will introduce channel modeling of EM waves through media and interfaces in a WUSN for underground in-pipe leak inspection. The model takes into account the effects of multiple factors on signal propagation, including radio frequency, multi-layer media, soil composition, soil moisture, and the burial depth of pipe. Experimental tests were performed to validate the channel model. Bit error rate (BER) and PLR for a common application from soil to aboveground were also investigated for reliable communications.
In this work, the real challenges of WUSN are addressed including propagation degradation characteristics of EM waves in soil and other media, reflection and refraction of EM waves while propagating across various layers, characterization of source for maximum operating life cycle, and BER calculation for various modulation schemes. All the above scenarios are included in the development model.
In addition, a generalized multi-layer model was developed between underground pipe and base station to get an optimum set of solution by varying parameters of the developed model. The parameters like frequency of operation, height of the observation points, depth of transmitter location, and characteristics of the soil can be varied to validate the simulated development model. Thus, the generalized solution is more of practical value as it offers fast and economical solution to allow for optimum parameters. In addition, the model can be extended easily to integrate more layers in the developed model.
Furthermore, the determination of BER and PLR, which is a distinguishable feature for a common application from soil to aboveground, was also investigated for reliable communications.
Analytical models for path loss in multi-layer media
In this section, a path loss model is derived for radio transmission from underground mobile in-pipe robots to aboveground receivers and through multi-layer media. The section starts with determining the transmission path, and derives signal attenuation both in transmission media and at the media interfaces, the end-to-end path loss, and the receiving power and propagation delay.
Transmission path
We consider a WSN network consisting of one or multiple mobile in-pipe sensor nodes and an aboveground base station, as shown in Figure 1. The sensor node, including a leak detection sensor and a robot, is inserted into a fully operational water pipeline. Once released, the sensor node moves in the water flow inside the pipeline and performs data acquisition. Wireless communication between the sensor node and the base station is critical not only for data transmission but also for localization and operational control of the sensor node. One of major objectives of the system is to pick up leak signals and transmit the information to the aboveground base station. Therefore, in this work, we focus on the wireless underground-to-aboveground channel, as shown in Figure 2. It is worth noting that the channel modeling method can also be applied to the aboveground-to-underground channel.

The proposed WSN for the leak detection of underground water pipelines.
Propagation path of the radio wave from the underground sensor node to the aboveground base station.
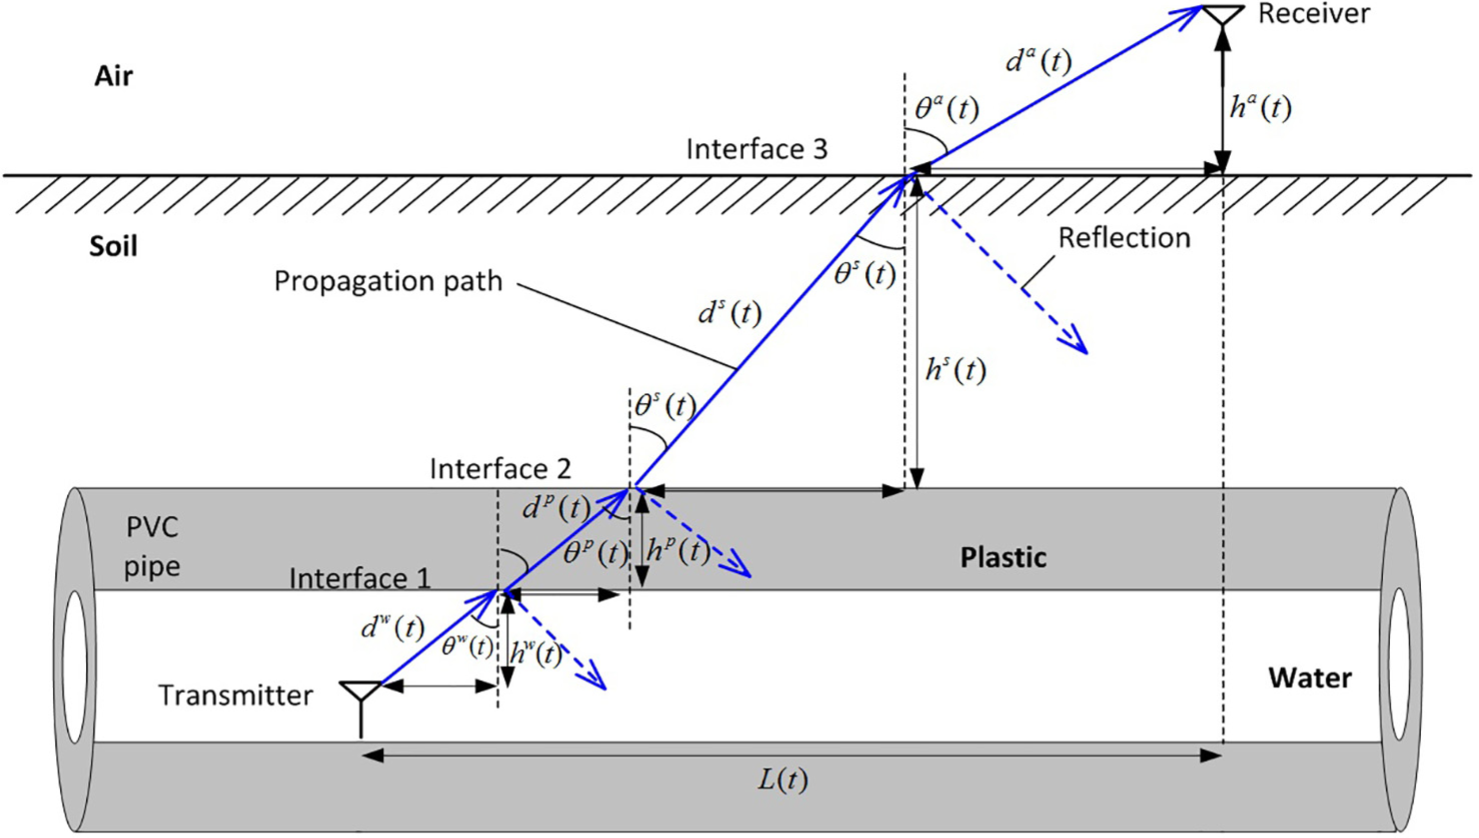
The propagation environment is complicated as the radio signal travels through multi-layer media (including water, plastic, soil, and air) and medium interfaces, as shown in Figure 2. The signal is attenuated not only due to the absorption of each medium but also as a consequence of signal reflection and refraction at each medium interface. In addition, radio propagation exhibits multipath channel characteristics. This is mainly because of the signal scattering and diffraction caused by the dispersive nature of water and soil, unsmooth medium interfaces, and reflection from aboveground objects such as trees and buildings. The multipath propagation results in multipath fading of the received signal.
In this work, the channel model is considered from a practical perspective. We use a link budget equation to determine the received signal strength at the base station by taking into account the path loss of the signal transmitted from the sensor node. The link budge equation expressing the received power

where
The path loss highly depends on the transmission distance through each medium as well as the incidence angle and refraction angle at each medium interface. As shown in Figure 2,
As shown in Figure 2, the distances
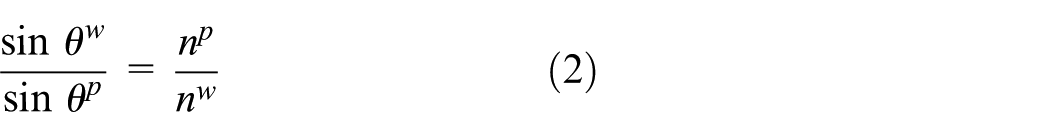
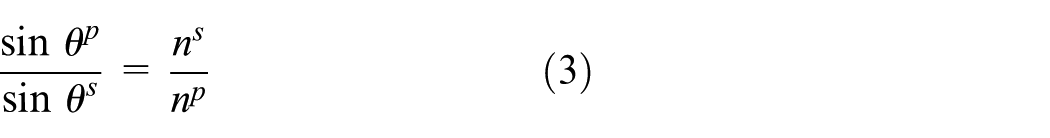


where
Signal attenuation in transmission media
Signal attenuation in soil
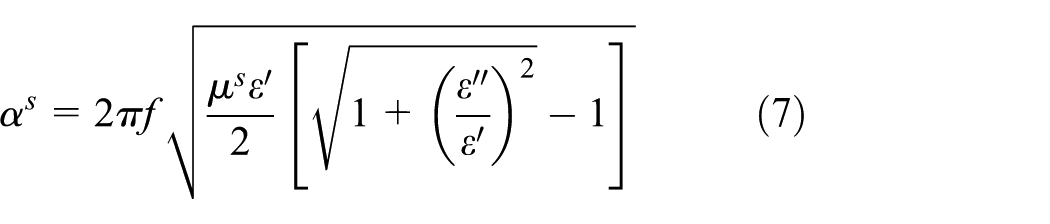
The signal attenuation in soil is modeled as a function of environmental parameters, such as soil moisture and soil composition, and system parameters, such as the operating radio frequency and the transmission distance in soil. According to a path loss model of an underground soil path developed in Li et al.,
4
the signal loss

where
where
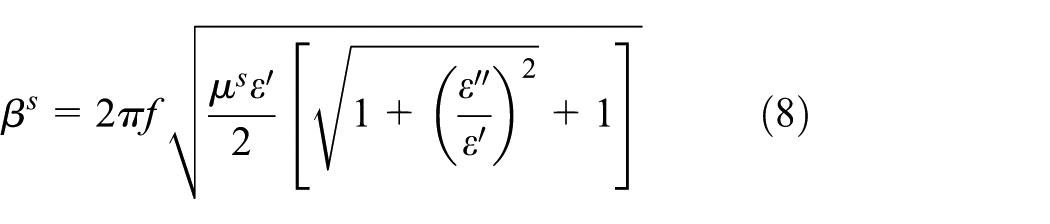
The dielectric properties of soil in the 0.3–1.3 GHz band can be calculated using Peplinski’s principle. 12 Specifically

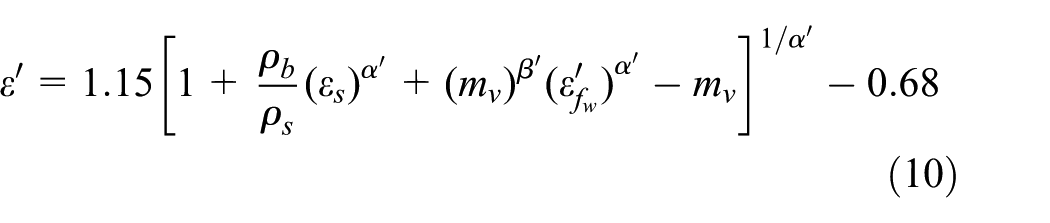
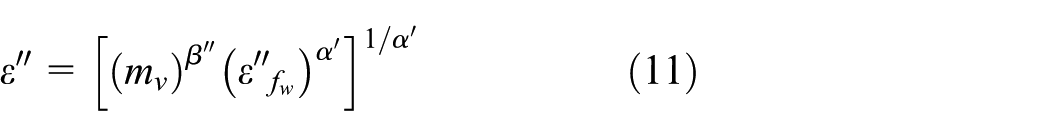
where


respectively, where
Signal attenuation in water, plastic, and air
The model shown by equation (6) to determine the signal attenuation in the soil can be extended to the calculation of the signal attenuation in the water, plastic, and air, respectively. This is based on the observation from equation (6) that the transmission loss

where
Signal attenuation at medium interfaces
When a radio wave moves from one medium into a second medium, it is partly reflected and partly transmitted at the medium interface. In the following, we illustrate the computation of signal attenuation at different medium interfaces in Figure 2.
Amplitude reflection and transmission coefficients
The amplitude reflection coefficient is defined as the ratio of the reflected wave’s complex electric field amplitude to that of the incident wave at a medium interface. Take the radio wave propagation from the soil to the air through medium interface 3 in Figure 2 for example. Let
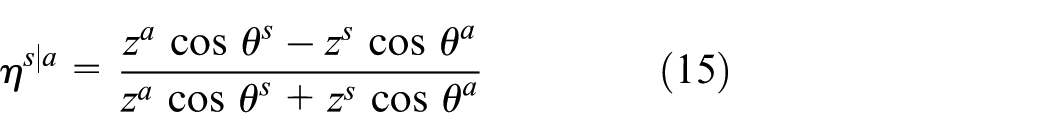
where
Power reflection and transmission coefficients
The power reflection coefficient is defined as the ratio of the reflected power to the incident power at a medium interface. The power reflection and transmission coefficients can be calculated based on the amplitude reflection and transmission coefficients, respectively. Let

By applying the law of conservation of power, the remaining power is transmitted through the boundary between the soil and the air with the power transmission coefficient

When a radio wave moves from one bounded medium into a second medium, part of the signal will be reflected at the lower and upper boundaries of the material and that multiple reflections will also occur. The multiple reflections in a bounded medium result in a power transmission coefficient with a different format from equation (14). This happens when the radio wave propagates in the in-pipe water and the plastic body of the pipeline. Let

where
End-to-end path loss
The end-to-end path loss is the sum of the signal attenuation through each medium and at each interface plus the effects of multipath fading. Based on previous analysis, the end-to-end path loss

Note that
Received signal power and propagation delay
The received signal power aboveground can be derived based on the end-to-end path loss and antenna gain. The antenna gain is a unitless measure that combines an antenna’s directivity and efficiency. The antenna gain can be written as
The end-to-end propagation delay can be derived based on the radio propagation velocity and propagation distance in each medium. The propagation velocity, also called the phase velocity,
13
can be expressed as
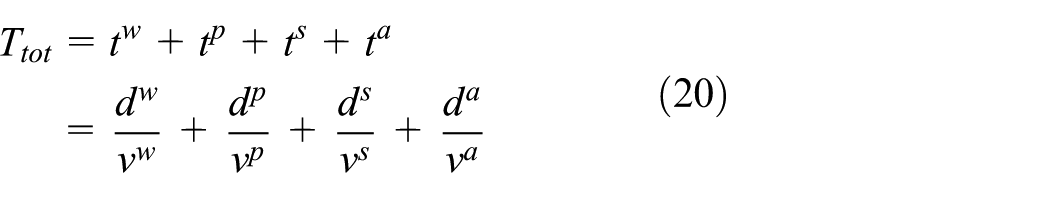
where
Experimental testing and evaluation of the path loss models
In this section, field experiments that use underground devices transmitting radio waves to aboveground receivers are first reported. Then, the experimental results are compared to the results generated using the analytical models derived in section “Analytical models for path loss in multi-layer media.”
Field experiments
Extensive field experiment was conducted to test the channel model. The experiment was set up as shown in Figure 3. A piece of polyvinyl chloride (PVC) pipe full of water was used to host a shielded cable. One end of the cable was cut and the cable’s inner conductor was protected with a non-conducting white plastic-like material and inserted inside of the pipe and immersed in the water through a sealed hole. The other end was connected to a signal generator HP8648. To prevent the signal generator or the wire from producing spurious emissions at the frequency being tested, the end part of the exterior ground coaxial cable at the connection with the signal generator was also covered against by a radio connector. Once the signal was emitted from the signal generator, it went into the pipe through the cable and then was transmitted through different media. The aboveground radio signal strength was measured at different locations using a portable spectrum RF Analyzer Agilent N9340. To ensure that the spectrum analyzer and the signal generator share a common ground, the spectrum analyzer was calibrated with the signal generator when we started measurement. In the experiment, we consider various frequencies between 50 and 900 MHz and various levels of TP. This is mainly due to the observed high signal attenuation toward 900 MHz in underground radio channel and antenna size that is inversely proportional to frequency band. The PVC pipe was buried at two levels 0.75 and 1.5 m.

Outline of the signal propagation path from an underground in-pipe transmitter to an aboveground receiver.
In our experiment, both transmitting and receiving antennas were forms of wired monopole antenna. As shown in Figure 4, the transmitting antenna in the PVC pipe was a part of the interior conductor of the shielded coaxial cable. The interior conductor was protected with a non-conducting white plastic-like material suggesting non-conductivity. This protection would prevent the interior conductor from shorting with the in-pipe water and exterior ground and creating a low-resistance loop, ensuring that the interior conductor could function well as an antenna. The receiving antenna was selected from an antenna set for different radio frequencies. For some other radio frequencies for which there were no corresponding antennas available in the antenna set, we used a monopole telescopic antenna as the receiving antenna instead, as shown in Figure 4. It is worth mentioning that the signal received through the analyzer will also include any RF energy available in ambient at various frequencies. For example, Figure 5 shows the ambient energy spectrum captured by the spectrum analyzer during the period of experiment.

Antenna location with respect to soil.

Ambient energy during the period of records in Boston (USA).
Soil analysis was conducted in the experiment since the proposed path loss model is a function of soil composition and moisture parameters. We collected soil samples and conducted soil analysis by collaborating with civil engineering researchers at Massachusetts Institute of Technology (MIT). The soil composition and moisture information includes the grain size distribution (GSD) and the moisture level of the soils. Moisture content of the soils could be obtained using an oven and calculating the mass difference of soil samples and dried soil. In our analysis, the moisture content of the soils at the two depths 0.75 and 1.5 m are 17.4%–25.3%.
For grain size analysis, mechanical sieving combined with sedimentation was conducted to obtain the GSD, as shown in Figure 6. Two types of sieves, the 4.75 mm sieve and the 2.00 mm sieve, were used to separate the portions of the soils with particle size ranges larger than 4.75 mm and between 2.00 and 4.75 mm from the soil samples, respectively. Then, for the portion of soils with particle size range smaller than 2.00 mm, we performed sedimentation using a hydrometer. Sedimentation describes the process of particles falling through a fluid and is used to separate the particles by size in space and time. The concept is that the smaller particles take longer to drop out of solution. 16

Soil analysis by sieving and sedimentation with the samples of the soils of Boston analyzed at MIT where the field tests have been conducted.
The GSD obtained has a percent finer plotted on the y-axis and the particle size (using a log scale) on the x-axis, as shown in Figure 7. The percent finer refers to the percentage of the dry soil mass that is composed of smaller-diameter grains than a given particle size. From Figure 7, we could obtain the mass fractions of sand and clay based on their definitions in terms of the particle size. 14 The obtained soil composition information together with the soil moisture information was used to calculate the pass loss in the soil based on the proposed path loss model. Note that Peplinski’s 14 principle only presented expressions for charactering the relative dielectric constant of soils in the 0.3–1.3 GHz frequency range. To determine the dielectric properties of the soil corresponding to the radio frequencies beyond this range, such as 50 MHz, Peplinski’s principle was extrapolated to those frequencies in the experiments.

Grain size distribution of soil sample.
It is worth mentioning that the proposed loss model is a function of soil composition and moisture parameters that can drastically change over the pipeline, hence a layout map can be constructed to address the variation of oil properties.
Comparison of theoretical results and experimental measurements of path loss
Theoretical results and experimental measurements of received aboveground signal strength were compared to evaluate the path loss model. The theoretical results were calculated based on the proposed path loss model with the soil composition and moisture information from soil analysis as we received it. The experimental measurements were obtained in the field experiment using the spectrum analyzer.
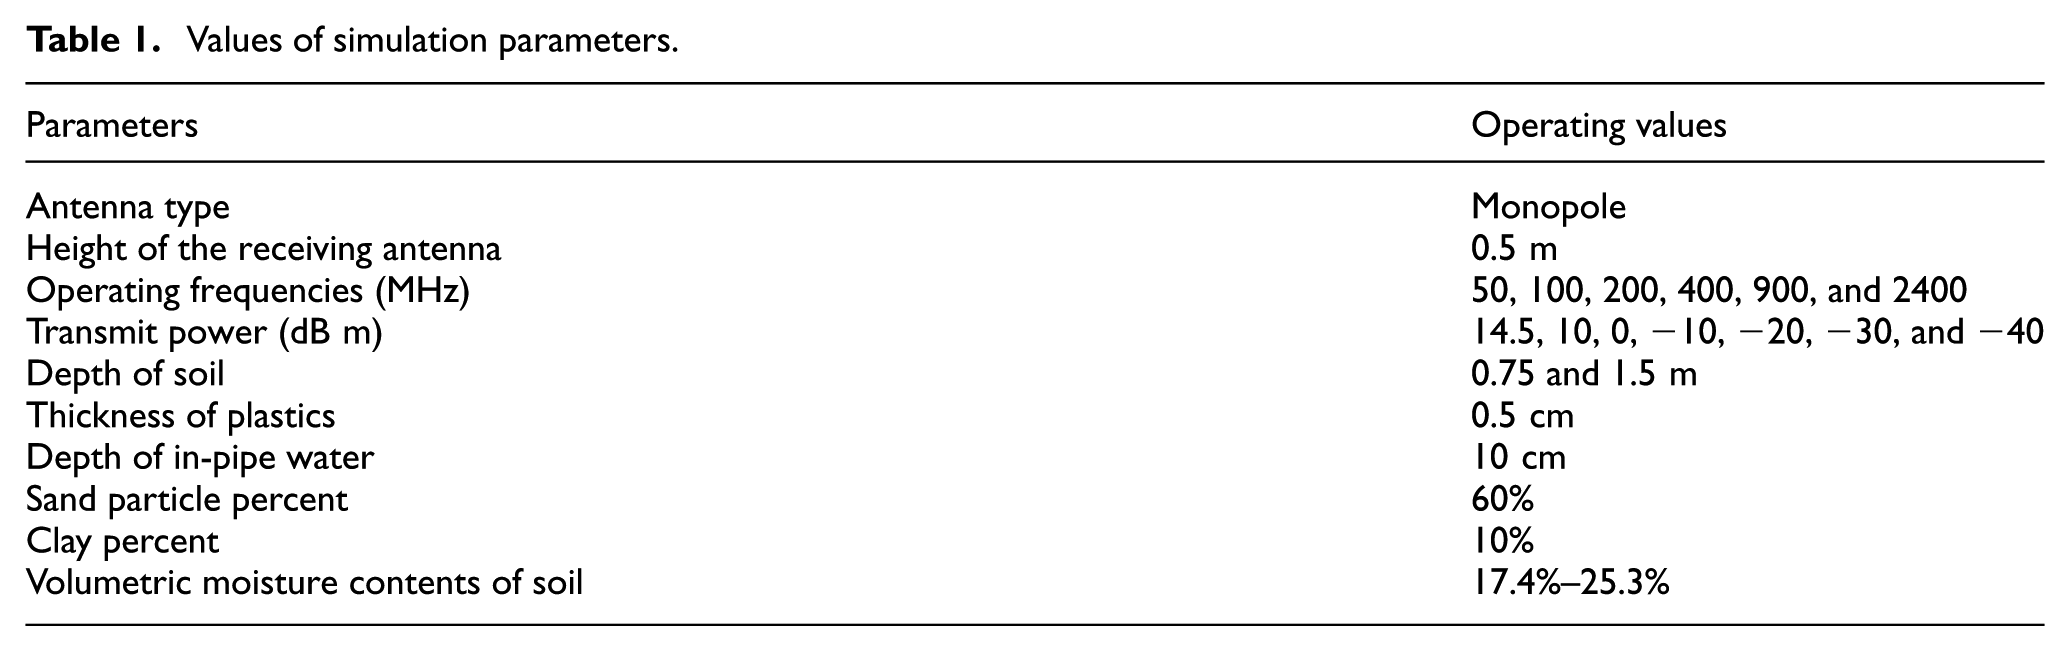
Since omnidirectional monopole antennas were used in the experiment, the directivity of 5.15 dB of such antennas 13 was used in the simulation to calculate the theoretical results with the path loss model. The simulation parameters are given in Table 1.
Values of simulation parameters.
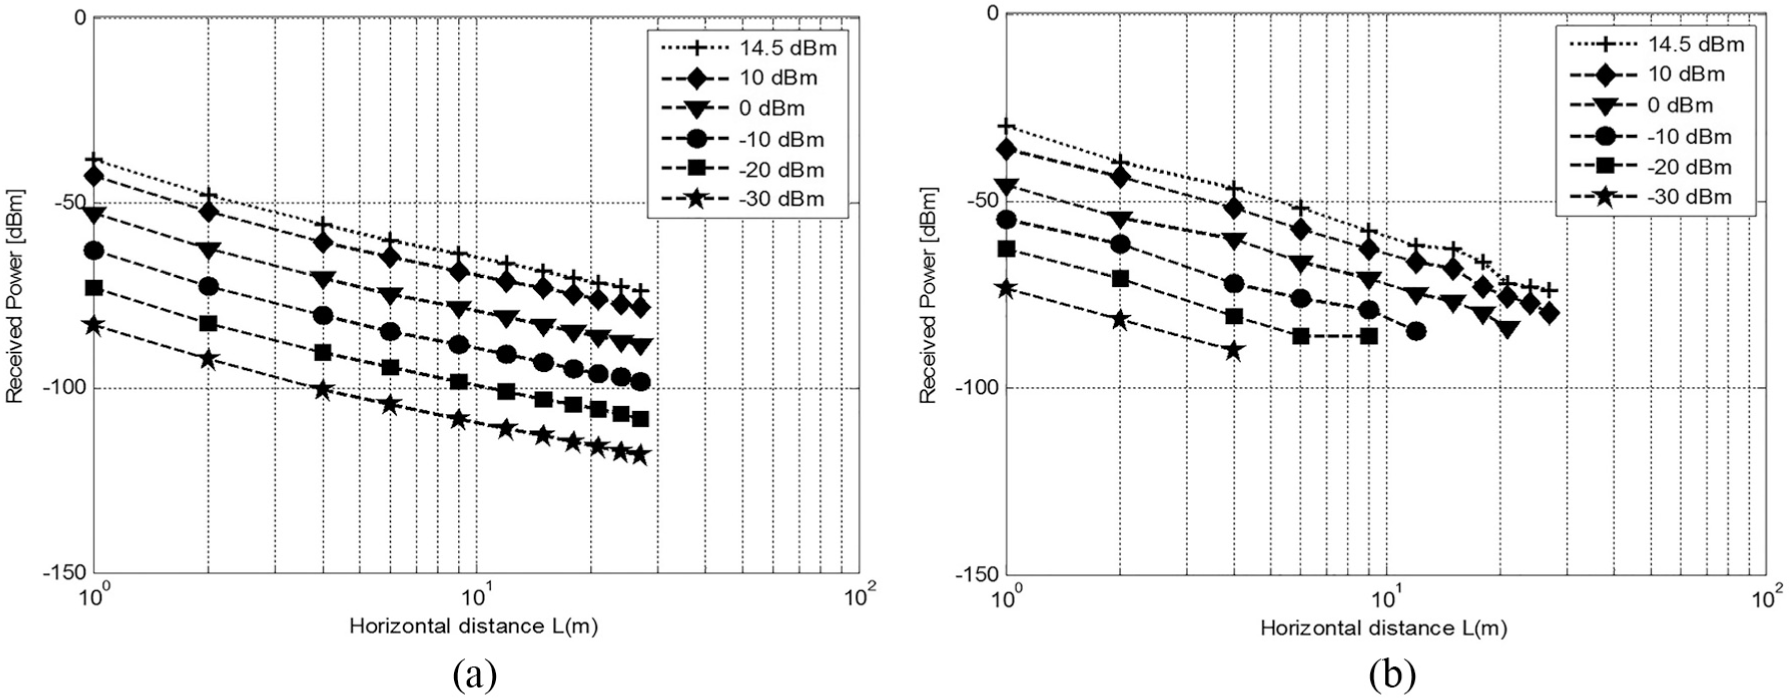
Power loss has been modeled for two depths of 0.75 and 1.50 m at various TP levels and has also been experimentally validated using instruments in the configuration in Figure 3. The modeling and measurement results about the received power versus the horizontal distance between the transmitter and the receiver are shown in Figures 8–10 for the depth of 0.75 m and in Figures 11–13 for the depth of 1.50 m, respectively.
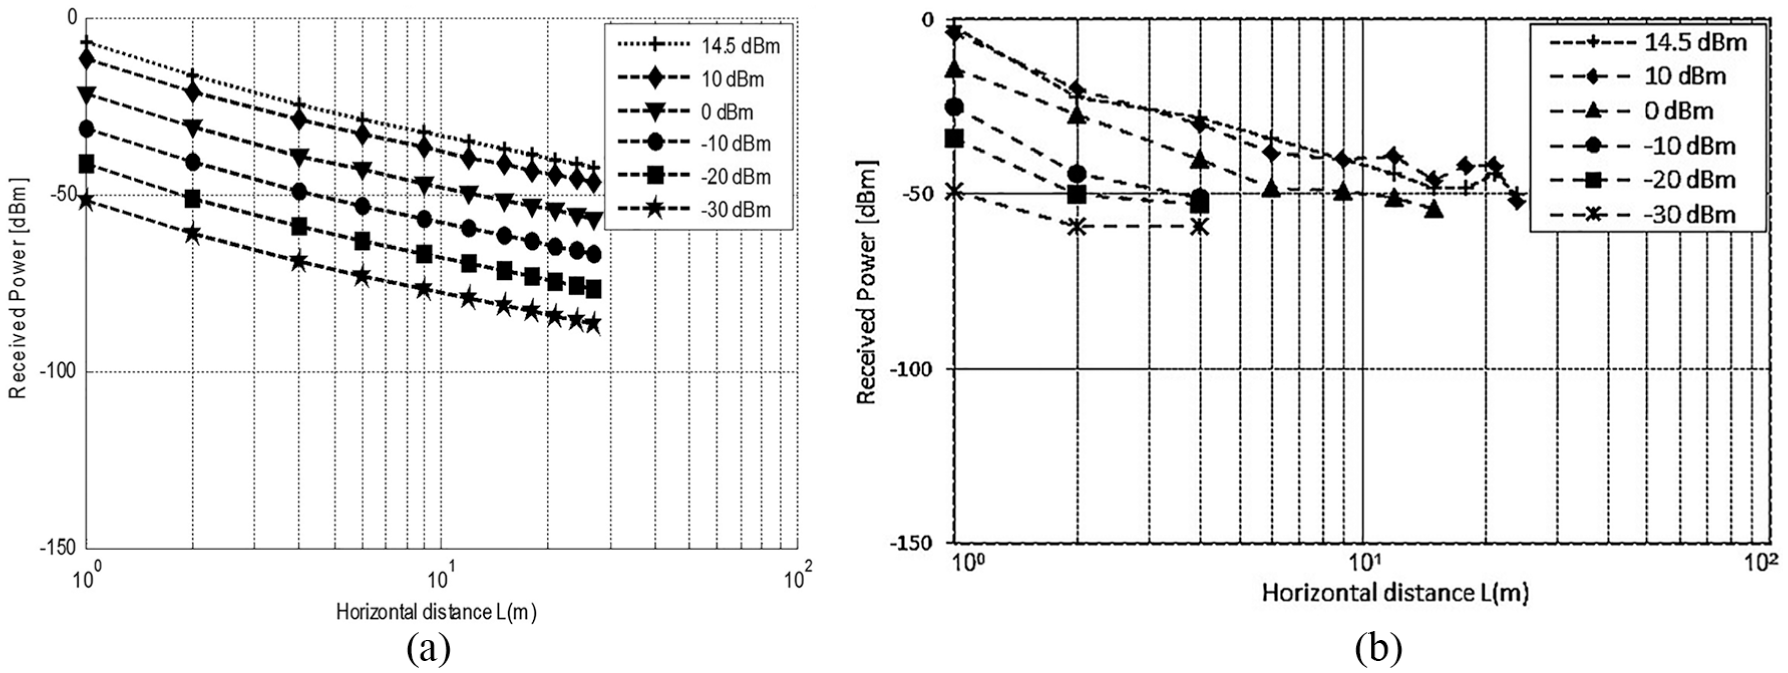
Received power versus horizontal distance with burial depth of 0.75 m and f = 50 MHz: (a) theoretical values and (b) measured values.

Received power versus horizontal distance with burial depth of 0.75 m and f = 100 MHz: (a) theoretical values and (b) measured values.
Received power versus horizontal distance with burial depth of 0.75 m and f = 200 MHz: (a) theoretical values and (b) measured values.

Received power versus horizontal distance with burial depth of 1.5 m and f = 50 MHz: (a) theoretical values and (b) measured values.

Received power versus horizontal distance with burial depth of 1.5 m and f = 100 MHz: (a) theoretical values and (b) measured values.

Received power versus horizontal distance with burial depth of 1.5 m and f = 200 MHz: (a) theoretical values and (b) measured values.
Measurement error sources discussion
Error in the experimental measurement can be estimated from the received power readings and effect of the environmental conditions. The nature of the experiments assumed that we were capturing not only the energy that was transmitted from the signal generator but possibly some energy from ambient at various frequencies available for various applications in that area. This can be observed from Figure 5 which does not exhibit frequencies matching those used here. The experimental results are also affected by the actual antenna gain, heterogeneous soil characteristics, and multipath channel characteristics. The multipath channel effect is mainly because of the signal scattering and diffraction caused by the dispersive nature of water and soil with rocks and grass roots, unsmooth medium interfaces, and reflections from aboveground objects such as trees and buildings at the experimental site. The multipath propagation results in multipath fading of the received signal.
Results and discussion
It was not expected to receive a complete match between the theoretical results of channel wave propagation and the experimental results. The results have shown good agreement between the modeling results and the measurements although a slightly different shift between these two types of results is observed at different radio frequencies. It was also observed during measurement that the signal was lost a few meters away from the source when lower power was used, for example, −20 and −30 dB m, while modeling predicts continuing up to 30 m for these two power levels.
To reconcile the mismatch between the modeling results and the measurements, a correction factor is proposed to be added to the loss model. The corrected loss model is

where
Comparison also helps to determine proper radio frequencies. The initial observation and comparison of the theoretical and experimental tests do not show good agreement, but also that not all frequencies are suitable to transmit radio from the buried pipe toward ambient air. Joint consideration of theoretical and experimental results show that the received power signal can be lost as we go in depth (0.75–1.5 m) at increasing frequencies (from 50 to 400 MHz). Hence, only a range between 100 and 200 Hz seems to be suitable for transmission (Figures 8 and 9 and Figures 12 and 13). Transmission at 50 MHz could be considered for short burial depths (Figure 8) but not for large one (Figure 11).
Bits error rate and PLR of the wireless underground-to-aboveground channel
Now that the analytical models have been developed and tested experimentally, we focus on the BERs and PLRs) of the underground-to-aboveground radio communication. This section addresses BER modeling and simulation, BER comparison for different modulation and TP at various depths, and packet formation and BER.
BER modeling and simulation
The BER was analyzed for the wireless underground-to-aboveground channel by considering different modulation schemes. Computation of BER depends on the channel model, signal-to-noise ratio (SNR), and the adopted modulation scheme. Specifically, in this analysis, the following assumptions and parameters are used:
Rayleigh single-channel model.
SNR with noise power
Modulation schemes: binary phase shift keying (BPSK), frequency shift keying (FSK), and quaternary phase shift keying (QPSK).
The BER for the three modulation schemes are expressed as 18


where

where
BER comparison for different modulation and TP at various depths
BER for different modulation schemes are analyzed by taking into account transmitter burial depth. Figures 14 and 15 show the BER of BPSK, FSK, and QFSK systems versus horizontal distances with burial depths of 0.75 and 1.5 m, respectively. The BER has been affected by free space path loss, atmospheric attenuation, water vapor dispersion, reflection, and scattering due to wooden buildings and loss due to vegetation. Low BER has been observed to be better using QFSK as the power increases, while BPSK exhibits better BER performance at lower power. Moreover, better distance coverage is secured by QFSK protocol as the TP increases at constant transmitting frequency. It was observed that FSK takes over QFSK after a couple of meters away from the source securing lower BER. This taking-over location moves also away from the source as the TP increases (Figure 14). Increasing depth, for example, 1.5 m, leads to increasing BER sharply toward 50% as expected in Figure 15; hence, more power is needed to enlarge the coverage distance.

BER for different schemes with different TP from 0.0 to 14.5 dB m, f = 100 MHz, and burial depth of 0.75 m: (a) TP = 0 dBm, (b) TP = 10 dBm, and (c) TP = 14.5 dBm.

BER for different schemes with different TP from 0 to 30 dB m, f = 100 MHz, and burial depth of 1.5 m: (a) TP = 0 dBm, (b) TP = 10 dBm, and (c) TP = 30 dBm.
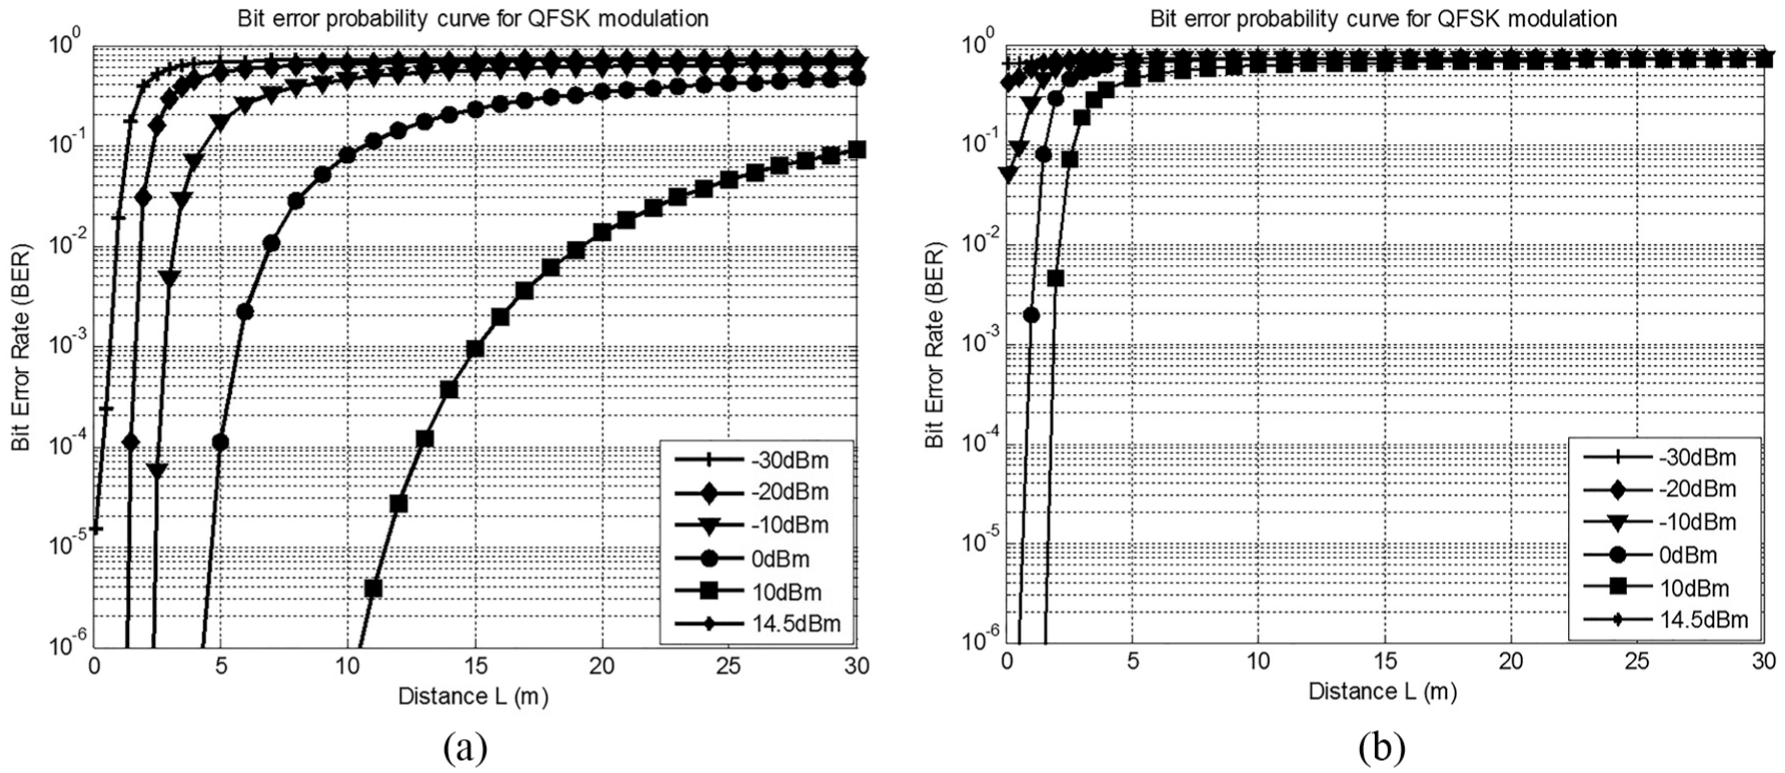
It is obvious that when the TP is too small, for example, −30 dB m, the transmission will be characterized with high BER and low coverage distance. BER was estimated at two depths and was observed at all frequencies and all power levels, as shown in Figures 14 and 15. Figure 16(b) shows that the BER with frequency 200 MHz reaches 50% even when the receiver is located on the top of the signal source for all power levels. The BER estimation has shown that transmission above 200 MHz will not secure reliable communication and packets or part of them will then be lost. This was also confirmed with previous measured power losses in Figure 13. In addition, Figure 17(a) shows that at frequency 50 MHz, BER is less than 1% with a coverage distance of about 10 m away from the source with TP 0 dB m.

BER of QFSK with burial depth of 0.75 m: (a) BER versus horizontal distance L at f = 100 MHz and (b) BER versus horizontal distance L at f = 200 MHz.
BER of QFSK with burial depth of 1.5 m: (a) BER versus horizontal distance L at f = 50 MHz and (b) BER versus horizontal distance L at f = 100 MHz.
Packet formation and packet error rate
Packet transmission was evaluated based on previous analysis. We consider a designed packet consisting for example of 168 bytes to be transmitted over a wireless channel. The minimum power received at the receiving antenna will determine the successful transmission. On the digital side, BPSK modulation is assumed to be used with a baud rate of 9600 once every second. The packet contains fixed header bytes, site-id bytes, current time bytes, 150 single-channel data bytes, and the cyclic redundancy check (CRC) bytes. The described packet is shown in Figure 18.

168-byte packet formation.
The packet consists of three main fields, which are as follows:
16 bytes header;
150 bytes, single-channel data;
2 bytes CRC (to assure the loss-free transmission);
The goal is to find the PLR for all sent packets and count the number of dropped packets for some specified time. For the proposed packet, we have considered the following setting:
Baud rate: 9600 bits/s;
Total number of packets transmitted in 1 s: 7 packets/s;
TP: 10 dB m;
Transmission frequency: 100 MHz;
Modulation scheme: BPSK.
To calculate the total packet losses over time, zero logic is used to indicate the packet loss while 1 shows that packet is successfully received. This simulation is done for different distances varying from 0 to 30 m. Figure 19 gives an overview on the behavior of received packets.

Packet loss probability versus time and distance for BPSK: (a) received packets over time at different distances and (b) packet transmission probability at different distances.
Conclusion
Communication through media, for example, underground to aboveground, exhibits significant challenges for the development of WSNs. The signal attenuation is mainly caused by the soil and its level of moisture as the waves travel through to aboveground.
This article has presented the modeling and simulation of the propagation characteristics of EM waves traveling from soil to aboveground with experimental. The results were expressed in terms of power loss and BER at various transmitting parameters. The experimental results have shown good agreement with the modeling.
This investigation has shown that the underground communication through soil to aboveground is reliably possible within 100–200 MHz frequency band. The channel characteristics vary with respect to the burial depth of the emitting source as well as the transmitting parameters.
Modulation schemes can be programmed to switch from one mode to another to keep BER as low as possible and hence securing reliable packets transmitted. This will depend on the available signal power, distance, and transmitting frequency.
The results obtained in this investigation will contribute to the communication aspect in the current application of autonomous robot for water in-pipe network buried at a certain depth. The application is also for pipe degradation resulting in material loss that can be detected. The power source optimization has shown possibilities to initiate networking and secure handover without losing communication packets.
Footnotes
Acknowledgements
The authors would like to thank the King Fahd University of Petroleum and Minerals in Dhahran, Saudi Arabia, for funding the research reported in this article through the Center for Clean Water and Clean Energy at KFUPM and MIT.
Handling Editor: Olivier Berder
Declaration of conflicting interests
The author(s) declared no potential conflicts of interest with respect to the research, authorship, and/or publication of this article.
Funding
The author(s) disclosed receipt of the following financial support for the research, authorship, and/or publication of this article: The research was funded through the collaboration between King Fahd University of Petroleum, Saudi Arabia and Minerals and Massachusetts Institute of Technology in Boston, USA.