
Abstract
Real-time pedestrian volume data are becoming increasingly important to business strategy adjustment and guiding measures of shopping malls, tourist attractions, and transportation hubs. Wi-Fi probes are widely used to capture and study the media access control layer information of mobile devices but often with low detection and precision. This article mainly proposes an enhanced method to increase detection rate and precision under Wi-Fi-based system. Device test was first introduced to guarantee the performance of probes. Based on the theoretical analysis on the influences of probes’ relative locations, four layout schemes of multi-probes were compared, and the optimal one with the highest detection rate was identified experimentally. Based on the optimal layout, an estimation model between actual and detected volume was established after data cleaning. In total, two correction parameters were introduced to modify the model and shows a high estimation accuracy (root mean square error is 15.32 persons) in the experiment at Tongji University. The results of experiment proved that the proposed optimal layout scheme of multiple probes and estimation model can effectively improve the detection performance and precision of pedestrian volume and help increase the reliability and application value of Wi-Fi-based detection.
Introduction
Increasingly, many transportation hubs, tourist attractions, and even shopping malls face the phenomena of large pedestrian flows. Large crowd of pedestrian may lead to safety problems and pressure on normal operation of these places. However, if the real-time data of pedestrian flow can be obtained, security measures or business strategies can be adjusted according to the volume, saving resources for low flow situations, and activating appropriate safety measures for high or critical flow situations to guarantee normal operation. Therefore, many types of pedestrian flow detection methods are applied to obtaining the data needed.
Wi-Fi-based detection method is emerging with the widespread adoption of mobile phones in pedestrian flow. Every Wi-Fi-enabled device that is discoverable will be detectable by the Wi-Fi probes through the wireless signals launched from itself. And every Wi-Fi device has a unique media access control (MAC) address (a 12-character hexadecimal number), which can be captured and stand for a person. In some studies, Wi-Fi access point (AP) is used to detect people.1,2 However, Wi-Fi AP tracking requires that the devices be connected to a specific wireless network, and the network has to cover the entire detection area. Thus, the area studied is limited by the network coverage, and tracking devices become more difficult when the studying area is a highway or a neighborhood. Because of these disadvantages of using Wi-Fi AP data to detect traffic network, there is a booming interest in developing independent Wi-Fi systems, where the MAC addresses can be captured without devices connected to a certain network.
In the literature, researches on independent Wi-Fi-based systems are mainly about the Wi-Fi-positioning techniques and application to pedestrian flow detection and bus tracking.
Wi-Fi-positioning technology always uses a wireless AP’s location as a reference and studies on the received radio signals to calculate the target point’s position. There are two main positioning methods. One is trilateration, which uses trilateration algorithm to calculate the real-time distances between the target point and three APs to acquire the position coordinate of the target point.3–5 The other is location fingerprint technique,6–8 which needs a large number of samples and always difficult to establish a database. 9 Now, the Wi-Fi positioning technique has a wide application in various places such as labor tracking at construction sites, 10 automobile depot management, 11 and people movement 12 .
In the aspect of pedestrian flow detection and bus tracking, corresponding research contains the construction of Wi-Fi system of pedestrian detection, 13 the estimation study of crowd densities, 14 the effective algorithm study under pedestrian detection, 15 and the effect of antenna characteristics on MAC address data in terms of travel-time estimation for pedestrians and cyclists. 16 Also, other research explores the potential benefits of using the utilization of Bluetooth and Wi-Fi technologies to estimate time-dependent origin-destination demands and station wait-times of transit bus and subway users. 17 A low-cost campus bus tracker is proposed by selectively using Wi-Fi proximity technique and global positioning system (GPS) information. 18
Wi-Fi-based detection method requires the devices’ Wi-Fi open. However, the proportion is not high for pedestrian flow, and detection rates are usually significantly lower than the actual pedestrian flow rate. Thus, some researches put the emphasis on how to improve the detection rate under Wi-Fi systems, such as the accurate study on the received signal strength indication (RSSI) variability in wireless network 19 and more precise estimation model and algorithm to process data. 20
This article mainly explores the optimal Wi-Fi probes layout and estimation model of real-time pedestrian volume detection and aims to improve detection rate and prediction precision under multi-probes system. In section “Data format and device test,” data format obtained by probes is introduced, and the lateral stability of the probes’ detection performance is tested experimentally. The optimal layout is investigated for three probes in section “Optimal probe layout exploration.” An estimation model is established in section “Estimation model between detected volume and actual volume,” including two data screening criteria, a cubic spline interpolation, and two correction parameters to modify the model, and experiments are conducted to test the estimation accuracy. Section “Direction distinguished detection method” presents two relevant topics of future work, and section “Conclusion” summarizes the outcomes of this article.
Data format and device test
Wi-Fi probes can intercept the wireless signals transmitted among nearby wireless devices. The probe itself does not interact with the surrounding wireless device, nor does it send any wireless signal, it is only responsible for intercepting all data frames within its listening range.
The probe used in this article requires external mobile power supply, and after time matching through network, the data can be saved locally in a USB flash disk. The effective listening range of probes used is about 20 m in radius. As long as the mobile device with Wi-Fi activated appears in the listening range, it will be detected, no matter whether or not the hotspot is connected.
Data format
The probe can analyze the MAC layer information of the intercepted wireless signal, mainly includes the source MAC address of the signal, the RSSI value, the frame type, time stamp (accurate to the seconds), and destination MAC address. The specific data format is shown in Table 1.
Data format of captured information.

MAC: media access control; RSSI: received signal strength indication.
Under normal circumstances, mobile devices send probe request frames (corresponding frame code is 40) to the surrounding APs continually, and data frames (corresponding frame codes are 48 and 88) are sent after devices are connected to an AP. Therefore, in order to obtain the mobile device MAC information, this article needs only studies on data whose frame code is 40, 48, and 88.
Device stability test
This article deals with the performance of multiple probes to detect pedestrian volume, that is, the number of detected mobile device MAC addresses. However, if the detection performance of a certain-type probe varies a lot among equipment, the detection results will lack reliability. Therefore, it is necessary to test the lateral stability of the probes’ detection performance before using them for specific testing.
In the stability test, six probes of the same type were set on the same location to detect pedestrian flow. The number of detected MAC addresses of each probe was collected in five periods. The test result is shown in Figure 1.

Results of probe’s lateral stability test.
From the data in Figure 1, detection results of the six probes in different time periods fluctuate slightly. Specifically, the range of MAC address number in five periods is 5, 8, 12, 12, and 16, respectively, which accounts for 5.63%, 8.12%, 6.32%, 8.25%, and 7.00% of the mean values.
Therefore, it can be considered that the test performance of this type of probe has high lateral stability, and the data detected by these probes are sufficiently reliable.
Optimal probe layout exploration
The detection rate of the proposed method using Wi-Fi probes method is usually lower than other methods, because
The rate of the Wi-Fi-activated smartphones in pedestrians is only 30%–70% and varies widely at different places and times.
Multiple path effects can occur when the signal transmits through different routes. This leads to decreased RSSI when the signal is received. 21 And the corresponding MAC address would be not counted when the RSSI was too weak to be captured by probes, which contributes to the low detection rate.
The wireless signal can be reflected many times when it encounters barriers, weakening the signal strength. Thus, reflection may also cause loss of valid data when the signal is very weak.
Different smartphones use different frequency Wi-Fi systems, and their triggering interval also ranges from a few seconds to tens of seconds. Under normal circumstances, people take several seconds to walk through the probe detection region. Therefore, under some circumstance, there may not be a trigger launched during the transit time, which also contributes to low detection rate.
Considering these issues above, to improve detection rate, this article proposes using multiple probes to detect pedestrian flow and combine the individual probe results to increase the detected MAC addresses.
Four-probe layouts of three probes
In section “Device stability test,” the device stability has been tested, and each probe has similar detection result. Usually, the union of several probes’ detection results is taken as the final result. Thus, data from stability test can also be analyzed as shown in Figure 2. The detected pedestrian volume of different number of unioned probes is collected. It is obvious that the detection volume increases when more probes’ detection results are unioned. However, the increase is slight after the number of probes reaches 4, which means that using three probes is enough for effective detection and is easy for installation as well. Therefore, the following discussion is all based on three probes.

Results of union data of probes.
Different layouts of the multiple probes may have significant effects on the final detection rate. In order to explore an optimal layout in terms of maximum detection rate, there are two main considerations:
The lateral space: the probes should be located on both the sides and the middle of the road to increase the possible signal routes and enhance the probability of being received.
The vertical space: the probes should be separated by an appropriate distance to expand the detection region, increasing the probability of the signals being detected.
Based on the two considerations above, four layouts using three Wi-Fi probes were trialed to study the detection rate, as shown in Figure 3, the two-way street is in Tongji campus and with width approximately 10 m.
In scheme 1, the three probes were set on both sides of the street, with the distance between each equal to the street width.
In scheme 2, the three probes were set on a line perpendicular to the street axis with the distance between each equal to half the street width.
In scheme 3, the three probes were set on a line parallel to the street axis with the distance between each equal to half the street width.
In scheme 4, the three probes were set on a line diagonal to the street axis with the distance between each along the axis equal to half the street width.

Layout schemes of three Wi-Fi probes.
Experiment on optimal layout and result analysis
When the four layouts are designed, an experiment was conducted in this two-way street. These probes are put on the right location, and two directional pedestrian flows were detected for nine 10-min time periods. And the actual pedestrian volume was manually counted simultaneously by students.
After counting the detected volume from the union of detected MAC addresses of three probes and defining detection rate as the ratio of detected volume to actual volume, the detection rate was calculated, and the results are shown in Figure 4.

Detection rate of each layout scheme.
Based on Figure 4, when the actual volume is low, detection rates of the four layout schemes are similar, but with increased actual volume, the detection rate of scheme 4 is obviously higher than the others. The results can be analyzed theoretically in the following.
When the pedestrian volume is large and multiple reflection or multipath effects of wireless signals are much serious:
The three probes in scheme 1 were located only on both sides of the road, and signals from smartphones toward the middle of the road may not be captured.
The three probes in scheme 2 were located on a line perpendicular to the road axis, and the effective detection is not expanded. Therefore, the situation can arise where people walk through the detection zone without a signal launched from their phones because the walking time is shorter than the launching interval.
The three probes in scheme 3 were set along the road middle line, and this significantly indeed expands the detection zone. However, signals launched from the edge of the road may not be captured by the probes, similar to the situation in scheme 1.
In scheme 4, the probes are located on both sides and the middle of the road, so the signals from either the middle or edge of the road can be captured. There is also longitudinal distance between the probes, which expands the detection area and increases the time for a pedestrian to walk through the detection region.
Thus, the experimental results and the theoretical analysis can be concluded: When the pedestrian volume is large, scheme 4 can effectively reduce multiple reflection or multipath effects and enhance the probability of detection by expanding the detection region, thus improving the overall detection rate.
In order to illustrate the correctness and generality of the conclusion above, the same experiment was conducted on the pedestrian walkway in a subway hub. The four probe layout schemes were set to detect people, and the actual pedestrian volume was counted manually. Detection results are similar to Figure 5, and the scheme 4 still has an obvious higher detection rate than other three schemes, which helps prove the reliability of the conclusion on optimal layout scheme.
Experiment scene in Tongji campus.
Estimation model between detected volume and actual volume
Experiment design
After determining the optimal probe layout scheme with the highest detection rate, this section mainly explores the method of estimating the actual flow volume from the measured flow volume.
Experiment should be first designed to obtain the initial data. As shown in Figure 5, experimental scene is still selected in a two-way commercial street (with width of 10 m) of Tongji campus, and three probes were arranged according to the optimal layout. Experiment time is chosen as the dinner time between 16:30 and 17:30 of workdays because students go through this street for dinner, and there will be an obvious change in flow volume during this time periods. The MAC addresses obtained from probes were selected as detected pedestrian volume, and actual pedestrian volume was counted manually at the same time.
Initial data were divided into groups according to the time period of 10 min. And the experiment was conducted twice in two close workdays, respectively, in order to get the training sample and test sample of the estimated model to be studied. Initial data from experiments were shown in Table 2.
Data cleaning process of initial training sample.

Data cleaning
After obtaining training sample and test sample of the initial data, data cleaning is needed to remove the invalid interference data. When eliminating invalid data, the following two aspects should be considered:
Effective detection radius of a probe is about 20 m, which is wider than the street’s width in the experiment. So, there will be equipment outside the street detected by the probe, and they do not belong to the studying pedestrian flow.
Under normal circumstances, pedestrian street has shops or residential buildings on its sides (there are shops along the experiment street as well). Mobile devices in shops or residential buildings will also be detected by the probe, but they do not belong to the studying pedestrian flow, either.
In order to eliminate these two types of invalid data from initial data, there are two data screening criteria proposed in this section.
Data screening criterion 1
In principle, RSSI value received by probes is inversely proportional to the distance between mobile phones and detecting probe. 22 So, RSSI value of signals from devices inside the experiment street should be obviously higher than those outside the street. And this article considers the first data screening criterion as a certain RSSI value to distinguish valid data and invalid ones.
However, in practice, RSSI value is affected by many factors in addition to distance, such as the propagation path, current weather, and other different emission devices. Therefore, it is not rigorous to determine RSSI value only by consideration of distance. And the most reliable mean is to measure the RSSI value of valid signals through an experiment.
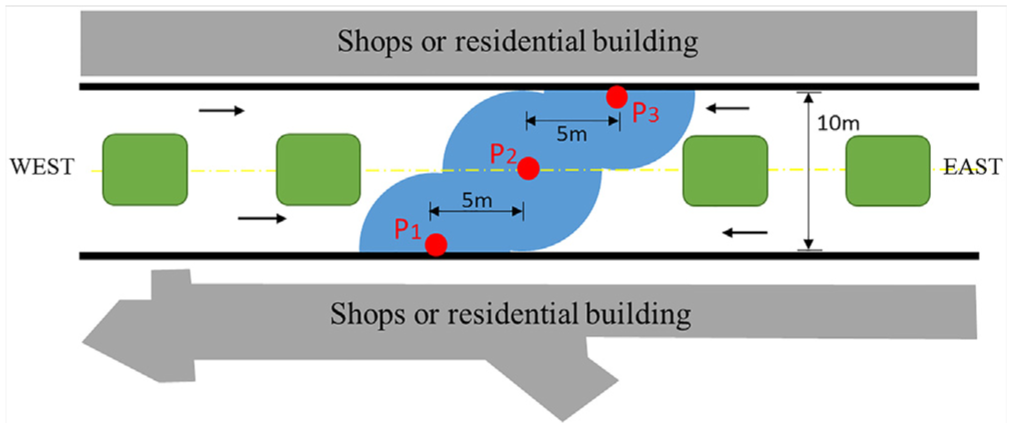
The experiment is based on the proposed optimal scheme layout, and effective detecting range of each probe is reduced to a circle with 5-m radius as the street width is 10 m. And six smartphones of different brands with Wi-Fi activated moved casually in the circular sector of semicircle region as the blue area shown in Figure 4. This experiment can be conducted simultaneously with experiments introduced above and lasted for the same time period.
RSSI values of these smartphones with MAC addresses known were selected as shown in Figure 6. The RSSI data were approximately normally distributed, and the mean of the fitted normal distribution was µ =−58.33, with standard deviation σ = 8.12. Thus, the 90% confidence interval for RSSI value was µ =−1.96 ×σ =−74.25 dBm. Therefore, the first data screening criterion for RSSI was −74.25 dBm and standing for the lowest RSSI value of valid data. Data points with RSSI less than this threshold were excluded as invalid.

RSSI distribution result.
Data screening criterion 2
Under the optimal probe layout, the whole effective detection range of the three probes was expanded to 20 m long. So, the longest time for a person passing through the detection region is approximately 13.3 s (normal walking speed is 1.5 m/s). Thus, in order to filter the invalid data from surrounding shops or residential buildings, the second data screening criterion was identified as a time period of 13.3 s to judge whether the detection time period of a MAC address was longer than it, if so, the address should be excluded.
After data cleaning, a number of MAC addresses of training sample obtained were processed, and the results are listed in Table 2. Each time period was 5-min long and was among 16:30–17:30 p.m.
Estimation model building
Since the number of smartphones with Wi-Fi activated is not known and unstable with pedestrian flow, this article studies the functional relationship between the detected and the actual volumes rather than considering the amount of smartphones with Wi-Fi activated.
Since detected volume data and actual volume data are discrete, this article used interpolation to fit the functional relationship between them. High-order interpolation does not converge and is unstable, whereas low-order interpolation converges and is stable, but the smoothness is poor. However, cubic spline has a good smoothness and can better fit the relationship within each section. 23 Therefore, cubic spline interpolation was used to fit the relationship between actual and the detected volumes.
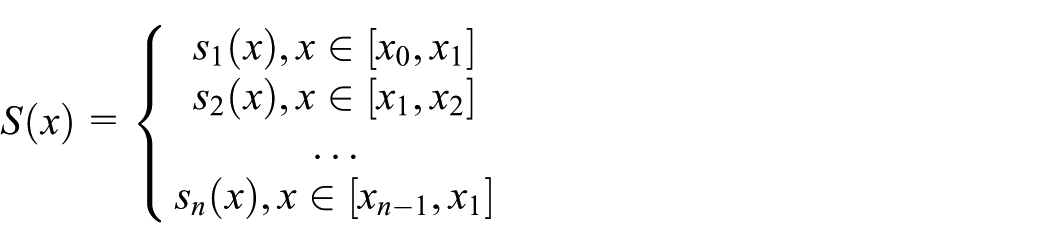
Cubic spline interpolation is defined as follows: if a function, f(x), has values f(
Dividing the data captured by the Wi-Fi probes and processed through two screening criteria into n groups by the time periods, we define the number of MAC addresses within each group as
After establishing the cubic spline interpolation, the discrete data are transformed into a continuous and smooth curve. And subsequent actual volume can be estimated from the detected volumes using this derived cubic spline relationship.
Model modification
As mentioned in section “Optimal probe layout exploration,” different mobile devices use different frequency Wi-Fi systems, and their triggering interval also ranges from a few seconds to tens of seconds. Therefore, there exists some circumstance that no trigger launched during the walking time through the studying detecting range. But the estimation model above ignores this situation and may lead to a lower detected volume.
On the other side, there are a proportion of pedestrians carrying more than one mobile device, but the estimation model considers each detected device as a person, and this obviously leads to a higher detected volume instead.
Taking these two situations above into consideration, the estimation model should be modified by introducing two correction parameters, and they are obtained through the following methods:
Detection rate correction parameter
Multi-device correction parameter
After obtaining correction parameters, the estimation model can be modified by introducing these parameters to the detected volume

And the final cubic spline interpolation function
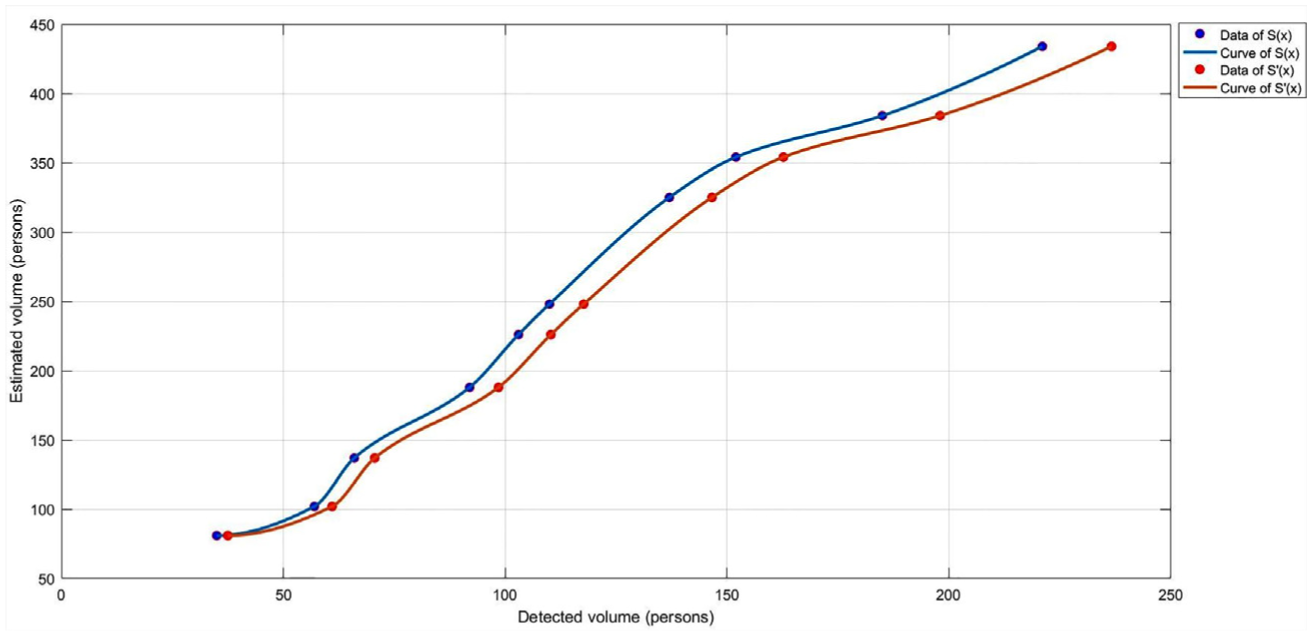
Curve of estimation model between detected volume and estimated volume.
Accuracy assessment of estimation model
To assess the accuracy of the modified estimation model, this article chooses root mean square error (RMSE) as the evaluation index, which is calculated as

where n is the number of test data points,
Here, we have 10 detected volume data in the test sample, and they are processed through the data criteria and correction parameters just as the data of training sample. And the processed data were used to calculate the RMSE of the proposed modified estimation model
Direction distinguished detection method
According to the RSSI value and exact time information of captured signals, the proposed optimal layout scheme is also capable of distinguishing the direction of the detected mobile devices and hence obtaining pedestrian volume in each direction.
As shown in Figure 4, we assign the probes as

Data processing to identify the direction of travel for a MAC address.
Conclusion
This article focuses on the research on how to improve detection rate and estimation precision of pedestrian flow under Wi-Fi-based system. Wireless signals are launched continually from mobile device when its Wi-Fi is activated, and the signals can be captured by the nearby Wi-Fi probes, and information of the unique MAC address, RSSI value, and exact time is obtained. Since the MAC address is unique, it corresponds to a person, and pedestrian volumes may be collected by this mean.
Wi-Fi probe used in this article is first introduced including its working principle, instructions, and captured data format. In order to make sure the detection results of multi-probes are reliable, a device test is designed to assess the lateral stability of probes’ detection performance.
The Wi-Fi detection requires a device’s Wi-Fi should be activated, but in the practical situation, the number of suitable devices is small and unstable, so the detection rate is always low. In order to capture signals as thoroughly as possible and increase the detection rate, this article considered four layout schemes of the probes for a particular location and showed that there was a significantly optimal scheme through an experiment. The optimal scheme effectively reduced multiple reflection or multipath effects and improved the probability of detection by expanding the detection region, improving the overall detection rate.
This article introduces an estimation model between detected volume and actual volume. Data come from experiments in Tongji University campus based on the optimal layout scheme. Data cleaning including two screening criteria are proposed to exclude invalid data detected. Criterion 1 is an RSSI threshold to filter data from the area not studied, and criterion 2 is a certain time period to screen data from persons remaining within the detection zone (e.g. in residential buildings and shops around the road).
Estimation model is established using a cubic spline interpolation to fit the relationship between detected and actual pedestrian volumes for a given location and detector layout. Taking some practical issues into consideration, this article introduces “detection rate correction parameter” and “multi-device correction parameter” to modify the estimation model. And accuracy of estimation model before and after modified is assessed according to the mean square errors.
Based on the optimal layout scheme, a process to determine pedestrian direction was given, mainly using the time series of captured data. And it helps make the optimal layout scheme more practical and useful.
Compared to other detection method, the proposed system also has relatively low operational costs, and easy installation, and will be applicable to many commercial road or pedestrian pathways, for example, entrances/exits of shopping centers. Nevertheless, some additional issues remain to be addressed, for instance, layout schemes for Wi-Fi probes applied to wider roadways and/or large groups of detectors need further investigation.
Footnotes
Handling Editor: Liping Jiang
Declaration of conflicting interests
The author(s) declared no potential conflicts of interest with respect to the research, authorship, and/or publication of this article.
Funding
The author(s) received no financial support for the research, authorship, and/or publication of this article.