
Abstract
Camera-based wireless video sensor networks present opportunities to use large numbers of low-cost, low-resolution wireless camera sensors for various applications such as outdoor remote surveillance and ubiquitous data transmission in line-of-sight systems. Owing to the continuously increasing popularity of displays and cameras, communication in sensor networks with display–camera pairs has become a promising area in both computer vision and wireless communication communities. However, measurement/sampling procedures for sensing data in wireless video sensor networks have not been established well yet. Consistency in channel measurements is an open issue, as precise calibration of the experimental settings has not been fully studied in the literature. This article focuses on establishing a scheme for the precise calibration of the display–camera channel performance. To guarantee high consistency in the experiment, we propose an accurate measurement scheme for the geometric parameters and identify some unstable channel factors such as the Moire effect, rolling-shutter effect, blocking artifact, inconsistencies in autofocus, trembling, and vibrations. In the experiment, we first define the consistency criteria based on the error-prone regions in the bit error rate plots of the channel measurements. It is demonstrated that the consistency of the experimental results can be improved by the proposed precise calibration scheme.
Keywords
Introduction
In the era of big data, the huge volumes of data from various sources have led to the possibility of launching a large number of new applications and technologies. An example would be the data-driven techniques for computer vision and machine-learning applications. 1 Similar to the traditional wireless sensor network, the camera-based wireless video sensor network is with multiple spatially distributed camera sensor nodes which operate autonomously and transmit data cooperatively through the network. The traditional closed-circuit television (CCTV) surveillance systems used in the field with their centralized processing and recording architecture together with a simple multi-monitor visualization of the raw video streams bear several drawbacks and limitations. One of the most relevant problems in traditional CCTV is the necessary communication bandwidth to each camera, and the computational requirements on the centralized servers strongly limit such systems in terms of scalability, installation size, and spatial and temporal resolution of each camera. For the traditional wireless sensor network, it processes and transmits the physical or environmental data which is not considered as multimedia data. Thus, the volume of data is much larger in a camera-based wireless video sensor network. The camera-based wireless sensor network takes advantages of both the traditional CCTV and wireless sensor network on the integration of multimedia data and flexible network structure, respectively.
The camera-based wireless video sensor network contain massive amount of data to be transmitted and analyzed through the network. For example, the camera systems are employed in the locations with potential high-security threat, such as airports, train stations, trains, and aircrafts. Moreover, it is also widely deployed in many public facilitates, for example, shopping malls, museums, parking garages, and hotels. The concerns on the camera system may also on generating data to analyze user behaviors for business promotion, traffic control, and so on.
As a ubiquitous sensing device, the mobile camera has been considered a low-cost and effective device for collecting varied types of data. It contains heterogeneous elements that can provide numerous benefits over the traditional homogeneous sensor networks. 2 More specifically, the display–camera pair has been considered a promising technology for building a wireless sensor network, owing to its advantages in terms of bandwidth, licensing, coexistence, and security. 3 Display–camera communication has recently gained significant attention owing to the extensive advances in mobile phone cameras.4–8 In the channel transmitter, the message is encoded and modulated into an image frame, for example, a barcode image, and is presented on a conventional display. At the receiving end, a mobile camera serves as the receiver. The advantages of such display–camera channels are nontrivial. First, the communication requires no extra hardware module, except for a camera–display pair, which is available on almost every off-the-shelf mobile phone. Second, unlike the existing short-range wireless communication technologies, it requires no transmissions in the ever-congested spectrum and, therefore, creates no inferences to other devices. Last, but not the least, the security and privacy can be controlled well during communication by adjusting the visible distance and direction.6,7 The potential applications of the display–camera communication include, but are not limited to, information retrieval in a shopping mall from a large display, teaching material distribution in a classroom from the projector, and multimedia file sharing from phone-to-phone between different users. The advantages are obvious and the potential applications are promising.
Researchers have been working on improving the channel throughput and reliability. The concept of display–camera communication is motivated by the fact that the capacity of a single barcode is too limited. Multiple barcode images are grouped into a video sequence to boost the capacity. Under such background, the stable decoding performance across the whole recording period is important. However, very few attention has been paid to the measurement/sampling procedures (i.e. the data-acquisition setup) for collecting sensing data from the display–camera channel. It is an important study for both standardizing the experimental procedure and analyzing the existing results. The calibration of experimental parameters is not a trivial problem. First, it is not an easy task to set the experimental parameters accurately. In particular, it is difficult to calibrate the capturing angles between the display and the camera, using conventional measurement tools such as ruler and protractor. In addition, it is found that the channel performance is sensitive to the experimental settings, especially when high channel throughput is required. As shown in section “Experimental results,” the channel performance often changes significantly, even if the experimental settings deviate by 2° in angle or 3 cm in distance. In the literature, some works focus on the case without perspective distortion,4,7 which is the ideal case for practical applications. Some other works consider a wide range of capturing angles, but no details have been provided on the measurement.5,6,8
Imprecise descriptions of the experimental settings and the sensitivity of the channel performance lead to issues of low consistency in the channel measurement results. However, consistency is the fundamental requirement of scientific experiments, as the demonstrations of experimental results should not be based on a single event. 9 In this article, we aim at addressing the issue of consistency in the display–camera channel measurements. The remainder of this article is organized as follows. Section “Proposed channel calibration scheme” describes our proposed channel calibration scheme. Section “Experimental results” shows the consistencies of the channel measurement results, considering and without considering the proposed calibration method. Section “Conclusion” concludes this article.
Proposed channel calibration scheme
In this section, some detailed treatments of the experimental setup are proposed to guarantee the consistency of the experimental results. The contributions are mainly in two parts.
Ensure accurate geometric setups for the experiments
To guarantee results with high consistency, the experimental parameters must be measured and set up with ultimate care. We divide the parameters into two independent sets, that is, the geometric and nongeometric parameters. The geometric ones include the display-to-camera distance, capturing angle between the camera and display, and barcode resolutions/sizes of display and camera. However, the ambient light intensity, non-uniformity of the display brightness, and image blurriness are classified as the nongeometric parameters, which describe the transmitted signal energy. In this article, we focus on the geometric parameters, as the experimental results are more sensitive to the geometric parameters than to the nongeometric ones. The capturing angle and the captured barcode size, in particular, affect the channel performance heavily 8 because of the change in the received signal energy. However, the nongeometric distortions can be compensated with some equalization schemes as shown in Wengrowski et al. 10
Avoid unstable channel states
An experiment with certain experimental settings (experiment state points) is considered as consistent only when “there is an open set around that point within which the result of that experiment is the same.”11,12 In each setup for the display–camera communication channel, one or multiple dominant error factors are present. The dominant factors can be a specific process of the decoding pipeline, for example, the barcode corner detection, image binarization, and symbol synchronization. It is important to identify these factors and ensure that they remain unchanged in other instances of the experimental setup. Therefore, it is crucial to identify the dominant error sources in the channel and avoid conducting experiments in the unstable states where the experimental results are sensitive to tiny deviations in the setup.
In the following subsections, details on the above-mentioned two aspects will be presented.
Precise setup for geometric parameters
To achieve a precise setup for the geometric parameters, we propose to use four reference points, to align with the barcode corners as illustrated in Figure 1(a). Given a fixed displayed barcode size, the four points are set such that the aligned barcode will possess a desired capturing angle, distance, and image resolution. Once the four barcode corners are aligned with the reference points and the displayed barcode size is fixed, all geometric parameters will be set accurately. The problem of setting the geometric parameters accurately has been simplified to the alignment of the four corners. The calculations of the four alignment points are explained with reference to the display–camera model illustrated in Figure 2.

Experimental setup: (a) demo with 20° capturing angle using Nexus 5 and the new iPad. The alignment points are circled. (b) Barcode pattern used in our experiment, and the illustration of slicing operation.
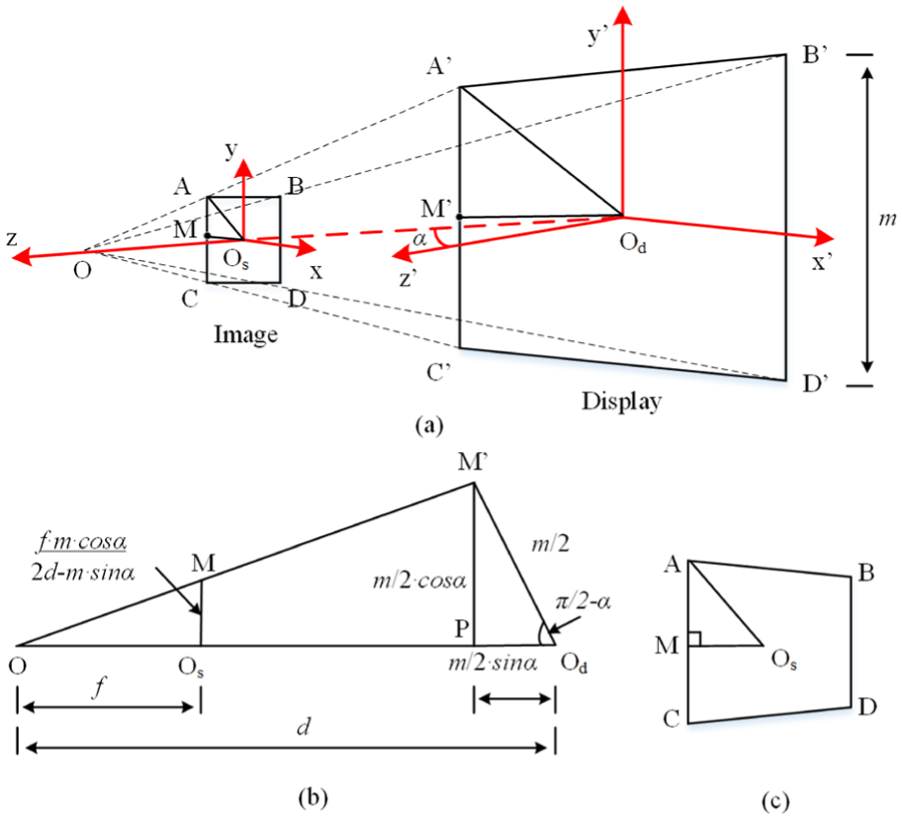
Pin-hole camera geometry model: (a) mapping from display plane
In the pin-hole camera model illustrated in Figure 2(a), the displayed barcode
Let the displayed barcode size be

where

Given that
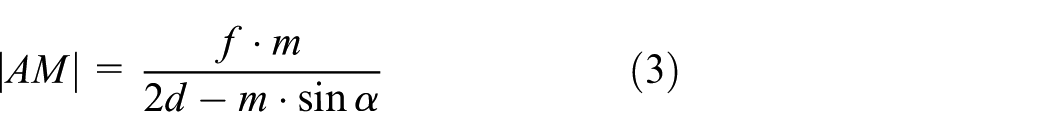
With

It should be noted that the above location, in length, should be converted to image coordinates, using the knowledge of the pixel size of the imaging sensor. During the experiment, the four corner locations will be calculated according to the predetermined parameters and the above geometric model. The computed coordinates will be marked in the preview window on the mobile application. Therefore, the problem of setting the geometric parameters accurately is simplified to the alignment of the four barcode corners to the reference points.
Avoid unstable experiment states
In this part, we discuss several undesirable factors in the experimental setup, which lead to unstable experiment states. The settings come from a wide range of factors including the trembling of the camera, modulation scheme of the light-emitting diode (LED) display, autofocus operation of the camera, sampling of the displayed pixels with the camera sensor, and effects of tiny vibrations. In the following subsections, detailed discussions will be presented for these factors.
Avoid rolling-shutter effect from complementary metal-oxide-semiconductor sensor
The rolling-shutter scheme is a popular data acquisition scheme for digital cameras with complementary metal-oxide-semiconductor (CMOS) sensors. It reads out the imaging data from the CMOS sensor pixels, row-by-row, sequentially, from the top to the bottom. 15 This is a common scheme in the state-of-the-art high-resolution CMOS sensors, which enables the sensor to continuously gather photons during the exposure process, and thus, increase the sensitivity of the imaging sensor. The major disadvantage of the rolling-shutter scheme is that the time difference between retrieving the pixel data from the top and the bottom of the sensor introduces a delay, and therefore, the rolling-shutter effect. 16 Thus, it is not appropriate for use in capturing scenes with fast-changing environments.
Unfortunately, the display–camera channel can be viewed as a periodic fast-changing channel over space due to the pulse width modulation (PWM) scheme popularly used in conventional displays.
17
The PWM scheme is used to control the brightness or the backlight intensity of a screen. Owing to the binary nature of the display backlight, a pixel can be turned either on or off, which corresponds to the maximum or minimum pixel intensity, respectively. To display grayscale images, the PWM driver turns on each pixel for a certain duration in each duty cycle to achieve the intermediate brightness levels. For a typical display driven by a PWM scheme, the full duty cycle is approximately
The generic binarization algorithm, such as the one in ZXing, 19 is a window-based binarization scheme which can be easily affected by any variations of image intensity, for example, caused by the PWM effect. The small change on binarization output leads to different corner-detection results. Meanwhile, any small change on the corner detection leads to a large difference in the following slicing and demodulation step. The sensitivity of the corner detection step is also discussed in section “Consistency experiment: with the proposed scheme.”
In order to reduce the rolling-shutter effect on the display with a PWM scheme, the brightness level should be turned to full so that the transmitted signals are kept static for each display pixel. As demonstrated in Figure 3, a rolling-shutter effect with alternate dark and bright patterns can be observed clearly in the left image with 50% display brightness, while it is eliminated in the case of full brightness level, and any automatic brightness adjustments are disabled. An alternate approach is to avoid using the display with PWM scheme; a list of the possible choices for PWM-free monitors can be found in Baker. 21

Barcode images with (left) and without (right) rolling-shutter effect from a Dell E2313H display 20 (driven by PWM scheme).
Avoid inconsistencies from autofocus operation
Autofocus refers to the camera operation that automatically adjusts the distance between the lens and the imaging sensor so that the captured image is visually sharp. 22 There are two types of autofocus techniques, active and passive autofocus. Active autofocus measures the distance between the camera and the object of interest, using an infrared beam, and adjusts the sensor-to-lens distance accordingly. Passive autofocus captures a series of video frames with varying sensor-to-lens distances and picks the best one by inspecting the image quality metrics, for example, the contrast, in each image. Passive autofocus is the dominant technique employed in the state-of-the-art mobile phone cameras. Thus, it is of our main interest.
Each trial of autofocus may, however, produce different results even if the geometric settings are fixed. This is mainly due to two reasons. First, the limited resources at hand, for example, the low quality of image sequences, strict time constraints, and limited computational power available for metric calculations. Second, the metric differences between the adjacent frames are usually very small, owing to the simple quality metric and the large depth-of-field of the mobile phone camera. 23 Therefore, a slight difference in the sensor-to-lens distance, across different images, produces significant changes in the image quality in a single experiment. In order to maintain the consistency during the experiment, we suggest turning off the autofocus function after one trial at the beginning of each experiment; the barcode image collection should start only after the autofocus operation has finished.
In order to freeze the autofocus function, a modification was made to the autofocus loops. As shown in Algorithm 1, an indicator counter is added to the generic autofocus handling algorithm 20 to fix the focus settings after the camera focus is properly set.

Avoid Moire effect from the display
It is well known that recapturing an image from the display without careful setup introduces the Moire effect. This is due to the aliasing from sampling the display pixel grid with the camera sensor pixels. 24 The barcode detection performance is heavily affected by the Moire pattern, as it introduces false barcode regions. Moreover, the pattern is very sensitive to the geometric settings. A tiny shift in the camera position can lead to huge changes in the Moire pattern, which affects the overall decoding performance. Researchers have been working on possible solutions to avoid the Moire effect in the recaptured image. Some suggestions, such as intentionally avoiding sharp focusing and preprocessing the image using a frequency-domain filter, have been made to eliminate the Moire patterns. However, these operations limit the sharpness of the barcode image and introduce inevitable losses into the images. Moreover, due to the uncontrolled capture environment, the Moire pattern is in irregular shape with spectrum across low- to high-frequency bands. It is difficult to design a band-pass filter to eliminate such artifacts.
Recently, Muammarand and Dragotti 24 modeled the structure of the display pixel grid in a two-dimensional (2D) square form and showed that the artifacts could be eliminated by simply setting the display–camera distance to a predetermined value. The distance could be calculated by the knowledge of the camera focal length and the display and camera sensor pixel sizes, that is

where
Capture distance with no Moire pattern (in meters).

It should be noted that this scheme works only when the display and camera planes are parallel. However, it brings insightful clues for the choice of equipment that can alleviate the Moire pattern. As
Avoid trembling and vibration
Display–camera communication is pervasive and sometimes ad hoc. The camera devices could be handheld, with no stable stations. This leads to difficulties in producing consistent channel measurements, because of irregular hand trembles. This leads to unexpected motion blurs in the captured images, which degrades the image quality and causes loss of parts of an image frame.7,26 In order to avoid abrupt changes in the communication channels, it is suggested that a stationary platform with adjustable freedom of viewing angle should be used to hold the camera. One example of such equipment is the mini tripod shown in Figure 1(a).
Besides the hand trembling, some tiny mechanical vibrations also cause unexpected camera motions. Early studies27,28 showed that the mechanical vibrations introduced inter-pixel interferences and limited the performances of an imaging sensor. The situations worsen in our case, since a display is used as the transmitter. On one hand, some inevitable Moire patterns are produced when the display and camera planes are not parallel. As discussed in section “Avoid inconsistencies from autofocus operation,” the Moire effect is generated because of sampling the display pixel grid with the camera sensor pixels. Thus, it is extremely sensitive to the vibrations in the display–camera channel. A small vibration of the camera or display may lead to a big change in the Moire pattern, which heavily affects the image preprocessing results, for example, binarization output. On the other hand, vibrations cause tiny shifts in the barcode corners in the captured images. This slight difference, in the pixel or even subpixel level, leads to very different results in the corner-detection and symbol-synchronization steps.
In the literature, researchers have proposed several approaches to solve the issues caused by vibrations. Siebert et al. 29 showed that the vibrations could be well estimated with a three-dimensional (3D) homography setup using two calibrated cameras. In our setup, a pair of consecutive images can be considered as images from two independent cameras. The vibrations between the two image frames can then be estimated using the same homography model, and the required compensations can be carried out. Advanced mobile phones offer image stabilization functionality at optical and software levels. For example, the iPhone 6 Plus 30 employs optical image stabilization, which takes advantage of the gyroscope and motion sensors, to measure motion data, and provides accurate information on the lens movement. The motion blur produced by shaking hands can then be compensated even under low-light conditions.
Therefore, we suggest that the experimental setup be stationed at a desk without any vibration sources such as computer cooling systems and hard disk motors. A tablet, which has no moving components, is a highly suitable display for our experiment, and phone models with image stabilizers for the cameras are preferable.
Experimental results
In this section, the experimental procedure is first introduced, and the experimental results, considering and without considering the proposed channel calibration scheme, are shown.
Introduction to experimental procedure
The purpose of the display–camera channel calibration experiment is to identify the range of the error-prone regions, which is important for error correction codes with unequal error protection (UEP) 31 and other advanced coding schemes. In this part, we first describe our experimental settings proposed to produce consistent results, followed by a methodology to analyze the experimental results.
Experimental setups
Given the considerations discussed in section “Proposed channel calibration scheme,” the experimental parameters are set as follows:
Display: new iPad with Retina display
Camera: Nexus 4/5 run in video graphics array (VGA)
Camera stand: mini tripod with adjustable orientation and height;
Barcode pattern: generic binary barcode with datamatrix-like structure as shown in Figure 1(b).
Barcode size:
Barcode dimension:
Distance: 21 and 15 cm from the camera to barcode center for Nexus 4 and Nexus 5, respectively, according to equation (4);
Capture angles: −20°, 0°, and 20°.
Brightness: 250–350 lx as measured by a lux meter.
It should be noted that our barcode pattern is not exactly the same as the datamatrix code. 32 The main difference is that our barcode pattern has an odd number of modules in each dimension (e.g. 87 in our setup), while the datamatrix code has an even number of modules. This change has been implemented to improve the detection accuracy of the top-right corner. With an odd number of modules along each dimension, a dark module is presented at each end of the finder pattern. It eliminates the need for estimating the top-right corner based on the detected ones at top-left, bottom-left, and bottom-right. Therefore, the detection accuracy can be improved.
It should be noted that our scheme for channel calibration is not limited to a specific barcode pattern. The barcode dimension is chosen such that it demonstrates a high-throughput (85 × 85 bits/frame) performance, which is of our main interest. The display–camera distance is fine-tuned to minimize the effect of the Moire pattern, according to equation (4). The settings of the capture angles cover a wide range of practical applications. For each angle setting, we precompute a set of four reference points as shown in section “Ensure accurate geometric setups for the experiments.” The users are required to align the reference points with the barcode corners. A simple demo of the 20° experimental setting is shown in Figure 1(a). It should be noted that the measurement procedure is also applicable to high-capacity quick response (QR) Code or other barcode patterns. This is due to the binarization and corner-detection processes of the generic 2D barcodes are the same, hence factors leads to inconsistency experimental results are similar for different barcode patterns. Besides the results on extreme cases (20°), the demodulation results under 0° condition is also reported. These settings cover both best and worst cases under practical setup. Thus, it is generalizable to other configurations, for example, 10°.
In each set of experiments, 500 images are collected to achieve high reliability, that is, a good enough confidence interval. The 95% confidence interval can be computed by 33

where
Result analysis: consistency measure
After collecting the barcode images, they are forwarded to the decoder and the demodulation BER plot is generated by assembling the error probabilities of each module according to the module position. As illustrated in Figure 4, the error plot is overlaid with the barcode image to show the position correspondences. The BER value at a given position in the xy-coordinates shows the performance of the corresponding barcode module. In this simple example, an error-prone module with an error rate of 0.1 is detected at the center of the barcode region.

Illustration of the bit error rate plot over the barcode region.
The BER plots of different experiments are compared to evaluate the consistency of the experiments. In this study, the locations of the error-prone regions, rather than the amplitudes of individual peaks, are of our main interest, because error-prone locations are the primary concerns of some advanced error protection schemes and channel studies. Therefore, preprocessing of the BER plots is necessary to eliminate the noisy spikes before evaluating the consistency. One generic approach is to apply a thresholding operation on the BER plots so that only the dominant peaks are retained, and the regions within the

The higher the metric, the more consistent the two experiments are.
Consistency experiment: with the proposed scheme
In this part, we demonstrate that the consistencies of the experiments can be maintained by accurately setting the geometries with the proposed scheme. As shown in Figure 5, the consistency metrics for the above distributions are computed as 0.56 for −20°, 0.39 for 0°, and 0.77 for 20°. It can be seen that the top-left and bottom-left corner regions are the error-prone positions in the error plots, regardless of the capturing angles. This is due to the datamatrix-like finder and timing pattern design. As can be seen in Figure 1(b), the top and right edges of the barcode consist of alternative black and white modules, which are used in the symbol synchronization. Errors in locating the barcode position heavily affect the symbol-synchronization accuracy. This is due to the red slicing lines for symbol alignment, which are drawn from the top to the bottom or from right to left. The top-left, bottom-left, and bottom-right corner regions suffer the most from the symbol-synchronization errors.

BER plots for our experimental results at −20°, 0°, and 20° capturing angles with Nexus 5 camera and the new iPad display. The consistency metrics for the three columns are: 0.56, 0.40, and 0.77 for the −20°, 0°, and 20° conditions, respectively.
It is also worth mentioning that the differences in the amplitudes of the two corresponding error plots are due to small alignment differences in the two experimental settings. As can be seen in Figure 6, the first set of images has higher detection accuracy in the bottom-left corner than the second set of images. Thus, smaller symbol-synchronization errors and lower amplitudes in the BER plots are obtained for the first set of images. Although various experimental conditions have been considered and controlled in the measurement process, there are still a lot of uncertainties which could generate slightly different experimental results. These factors contains but not limited to the pixelated effect of display pixels, blurring in the capturing process, and various noises from camera sensor.

Corner-detection and symbol-synchronization results for both experiments in the case of 20° capturing angle. Top: the detected bottom-left corners marked with red dots; Bottom: the corresponding symbol-synchronization performances at the bottom-left region: (a) first set and (b) second set.
The results for both Nexus 4 and Nexus 5 are summarized in Table 2. It can be inferred that, when the channel distortions are strong and deterministic, the experiments should have high consistency. For example, under −20° and 20° perspective distortions, the consistency scores are generally higher than those of the experiments at 0°.
Consistency scores.

Inconsistent experiments: without the proposed scheme
Slight deviations in the geometric parameters can lead to very different decoding performances, and therefore, very different error plots. Without precise calibration of the geometric parameters, the consistency of the experimental results cannot be guaranteed from independently collected images. In this section, we show that a small inaccuracy in setting the angle and distance can lead to a completely different decoding performance.
One set of experimental images are collected at an angle of −22° and a distance of 18 cm, using Nexus 4 and the new iPad. Such deviations can easily occur if the angle and distance measurements are not conducted properly. For example, by measuring the distance when the phone and display are not properly aligned (

Error plots of the experimental results by Nexus 4 and the new iPad with (a) precise geometric settings, that is, −20° and 21 cm; (b) −22° and 18 cm; and (c) synchronization error due to lens distortion in the right edge of the barcode.
It should be noted that the inconsistency between measurement results is an important phenomena but, to the best of our knowledge, it has not been reported in the literature. Following the suggested experimental procedure, repeatable experimental results can be generated. Moreover, though the results are more sensitive under a large viewing angle which is an extreme experimental condition. After understanding the error-prone locations under different experimental conditions, error correction code with UEP can be applied and improve the reliability of the communication system.
Conclusion
In this article, we established a precise calibration scheme for the geometric parameters in the display–camera communication channel. Four reference points were precomputed according to the predetermined geometric parameters. The problem of accurate setup of the parameters was simplified to the alignment of four corner with four reference points. Careful setting of the equipment and experimental parameters was needed to avoid unstable channel states such as the Moire effect, rolling-shutter effect, blocking artifacts, autofocus inconsistencies, trembling, and vibrations. In the experiment, the BER plots of the captured barcode images were analyzed and the consistency criteria were defined. We demonstrated that setting the geometric parameters accurately, and avoiding the unstable factors with the proposed scheme, could improve the consistency of the experiment significantly.
It should be noted that the proposed scheme is also applicable to the display–camera communication scheme without a fix pattern. General speaking, all display–camera communication systems require proper alignment of the detected pattern, which could be a barcode or an area without specific landmark. The factors mentioned in our measurement scheme, that is, rolling-shutter effect, inconsistencies from autofocus, and Moire effect, induce significant distortions into the captured images. These distortions lead to significant difficulties in the detection process and result in inconsistent experimental results and less stable communication performance. Therefore, the conditions specified in the proposed measurement scheme are also applicable on general display–camera communication scheme without a barcode pattern, such as Jo et al. 34
Footnotes
Declaration of conflicting interests
The author(s) declared no potential conflicts of interest with respect to the research, authorship, and/or publication of this article.
Funding
The author(s) disclosed receipt of the following financial support for the research, authorship, and/or publication of this article: The work of the first author was supported by the NSFC Project under grant 61702340, the NSF of Guangdong Province under grant 2017A030310382 and the Faculty Startup Grant of Shenzhen University under grant 2016052. The work of the second author was supported by the General Research Fund of the Hong Kong Research Grants Council under Project 16207114.