
Abstract
This article comparatively analyzed the performance of K-nearest neighbor, support vector machine, and artificial neural network classifiers for driver drowsiness detection with different road geometries (straight segments and curve segments) based on a driving simulator. First, vehicle performance measures (speed, acceleration, brake pedal, gas pedal, steering angle, and lateral position) were collected through sensors. These measures were analyzed, and their correlation with drowsiness on different road segments was examined. The analysis was based on data obtained from a study that involved 22 subjects in the driving simulator located in the Traffic Research Center, Beijing University of Technology. Second, six classifiers were constructed for six curve segments, respectively, while only one classifier was constructed for all straight segments because the waveforms by subtracting the road curvature from the steering angle in the curve segments were different from the waveforms of the straight segments. Furthermore, the less the radius of curvature, the more the difference. Third, the performance of K-nearest neighbor, support vector machine, and artificial neural network classifiers were compared and evaluated. The experimental results illustrate that the support vector machine classifier achieved the fastest classification time and the highest accuracy (80.84%). Support vector machine and artificial neural network are effective classification methods for detecting drowsy driving on different road segments.
Keywords
Introduction
Driver fatigue or drowsiness is one of the major causes of traffic crashes. Fatigue is a condition characterized by a reduced capacity that can be physical or mental. Fatigue can be induced by different external factors, while drowsiness is a natural state with the need to sleep. Accordingly, fatigue detection may be more difficult due to the complexity and variety of its characteristic. 1 Fatigue is usually accompanied by drowsiness. Brown’s 2 study showed that poor sleep or lack of sleep is one cause of driver fatigue. Fatigue and drowsiness are often used interchangeably. 3 The National Highway Traffic Safety Administration (NHTSA) estimated that about 100,000 crashes were caused by fatigue or drowsy driving each year in the United States. The crashes resulted in more than 71,000 injuries and 1500 deaths. 4 The study of Klauer et al. 5 showed that drowsy driving increases the crash risk four to six times. The study showed that at least 15%–20% of all crashes are related to fatigue and drowsiness. 6 The ability of a driver to operate a vehicle degrades substantially under the fatigue or drowsiness condition. Therefore, developing a model, algorithm, or designing a system, which can detect fatigue or drowsy driving, is important for the prevention of road crashes. In the past few years, many approaches have been proposed for fatigue or drowsiness detection. Generally, the approaches are divided into the following three categories:7–9
Physiological features–based method. The methods are based on physiological signals, such as brain waves, skin electric potential, heart rate, and pulse rate. Lal et al. 10 used electroencephalogram (EEG) to develop a fatigue countermeasure algorithm. Physiological features–based methods are regarded as the most accurate in fatigue detection. 11 Zhang et al. 12 proposed a multi-features-based fatigue detection method. The measures included EEG, electromyogram, and electrooculogram signals. Wang et al. 13 proposed an EEG-based method to detect driving fatigue using the correlation dimension. However, the measures are intrusive. The electrodes are attached to the body of the subjects, which make the driver feel inconvenient and annoying. 9
Visual features–based method. The visual features come from the driver’s head activity, eyes activity, facial expression, body sagging posture, and so on. Jo et al. 14 proposed a vision-based method that combined appearance features with statistical features. Wang et al. 15 detected the driver fatigue by monitoring his or her mouth movement. Azim et al. 16 proposed a video analysis–based fatigue detection system. Compared to physiological features, these approaches are non-intrusive. The methods generally use image processing to analyze the driver’s state. However, the image can be affected by lighting conditions or other factors, which may decrease the detection accuracy. 17
Driving behavior–based method. The method detects driving fatigue by analyzing vehicle speed, acceleration, steering angle, lateral displacement, brake pedal, and so on. The method is also non-intrusive. Compared to visual features, the feature acquisition of driving behavior is quite easy. And it cannot be affected by the light condition. 18 For safety reasons, these features are generally collected using a driving simulator. Krajewski et al. 19 detected drowsy driving by analysis of steering wheel behavior in the driving simulation lab. Eskandarian and Mortazavi 20 collected steering wheel signal in a truck driving simulation environment and used a signal processing scheme on steering wheel signal to detect the drowsiness. Sayed and Eskandarian 21 detected the drowsiness using vehicle parameter data in a driving simulator. King et al. 22 used a test vehicle to collect the data and proposed a simple algorithm based on the steering wheel movement, which demonstrated the potential for fatigue detection by driving behavior.
Each approach requires, first, finding the correlation between fatigue/drowsiness and the corresponding features, regardless of whether they are the vehicle-related or driver-related features obtained through the sensors. The existing researches have shown that the correlations do exist. 1 Second, a classification method should be proposed based on the features. Generally, the classification approaches are divided into the following two categories. The first is to directly input the features into a predefined model to detect the fatigue/drowsiness. The percentage of eyelid closure over the pupil, over time (ePERCLOS) proposed by Wirewille and Ellsworth 23 is a typical example. The second is to use pattern classification technique to detect the fatigue/drowsiness. K-nearest neighbor (KNN), artificial neural networks (ANN), support vector machine (SVM), and Bayesian networks (BN) are very popular techniques for the classification. Yeo et al. 24 used SVM to classify EEG into four frequency bands and then detected the drowsiness. Hu and Zheng 25 proposed a method of detecting drowsiness using SVM to analyze 11 eyelid-related features extracted from Electro-Oculogram. Shen et al. 26 showed that the accuracy of the probabilistic-based multiclass SVM classifier was better through comparing a probabilistic-based and a standard multiclass SVM classifier. JH Yang et al. 27 developed drowsy-driver detection systems using the paradigm of BN. YL Liang et al. 28 used SVM to propose a real-time method of detecting the distraction.
The above researches show that the techniques, ANN and SVM, are effective in detecting driver fatigue or drowsiness. As we all know, accuracy and real time are two important indicators for fatigue or drowsy driving detection. Therefore, performance analysis of KNN, ANN, and SVM classifiers is very necessary for fatigue or drowsy driving detection. In addition, although there have been numerous studies about detecting driver fatigue or drowsiness, few studies considered road geometry and curvature in drowsiness detection. Sayed and Eskandarian 21 removed the effect of curvature from steering wheel signal to detect the drowsiness. It is deduced that the effect of curvature on driver drowsiness detection may vary in different road geometries. Accordingly, this article focuses primarily on driver drowsiness detection with different road geometries (straight segments and curve segments) and performance comparison of KNN, SVM, and ANN classifiers. First, vehicle performance measures (speed, acceleration, brake pedal, gas pedal, steering angle, and lateral position) were analyzed and evaluated to examine their correlation with drowsiness on different road segment types. Second, the classifiers were constructed for each curve segment, while only one classifier was constructed for all straight segments because the waveforms by subtracting the road curvature from the steering angle in the curve segments were different from the waveforms of the straight segments. Furthermore, the less the radius of curvature, the more the difference. Third, the performance of KNN, SVM, and ANN classifiers was compared and evaluated.
The rest of the article is organized as follows. Section “Experiment and data collection” presents the experimental design, which includes participants, apparatus, scenario, and experimental process. Section “Data analysis and feature extraction” presents the data analysis and feature extraction. Next, section “Driver drowsiness detection” presents the driver drowsiness detection using KNN, SVM, and ANN classifiers and performance comparison of the classifiers. Section “Conclusion” summarizes the conclusions and proposes future work.
Experiment and data collection
The alert and drowsy driving experiments were conducted at the Car Simulator Laboratory located in the Traffic Research Center, Beijing University of Technology. During the experiments, drivers drove a car simulator under alert and drowsy states. Data were recorded through the sensors.
Participants
A total of 25 subject drivers were recruited to drive the car simulator. Driver age ranged from 20 to 35 years with an average age of 25 years. All participants were licensed drivers. Drugs and alcoholic drinks were banned during the experiments. All of the subjects received no less than 400 RMB as payment at the end of the experiments.
Apparatus
The experiments were based on Autosim simulator system located in the Transportation Research Center, Beijing University of Technology. The body of the simulator is technologically remolded from a Toyota vehicle, and the steering wheel, brake, parking brake, and safety belt are identical to a real vehicle. Sensors were used to collect data. The data sample frequency is 30 Hz. Three software tools were used for the simulation experiment. The first is Evariste, which is used to create experimental scenarios. The second tool, Simword, is used to control the scenarios. The third is Scancer, which is used to record the data. Eye movement data were recorded by a head-mounted eye tracking system.
Scenario
The driving scenario consists of a 10-km urban road, which is composed of straight and curve segments, as shown in Figure 1. The radii of curvature for the three left-turn curves are 200, 500, and 800 m, and the radii of curvature for the three right-turn curves are 200, 500, and 800 m. Let L200 denote the left-turn curve with the radius of curvature of 200 m. Similar definitions also apply to R200, L500, R500, L800, and R800. Let S denote the straight segments.

The scenario.
Experimental protocol
The protocol was designed for driver drowsiness detection in a simulator. During the experiments, drivers drove the simulator under alert and drowsy states, respectively. Each driver was required to complete two driving tasks, a morning task (8:30–11:30 am) and a night task (1:00–5:00 am). A participant practiced the operation of the simulator before performing the tasks. The experimental tasks were performed when the participant became familiar with the operation. For the morning task, drivers were required to have at least 8 h of sleep before their testing date. Subjects were picked up to the Car Simulator Laboratory 1 h before the start of the task. For the night task, drivers were required to keep awake for about 17 h before the experiments began. They arrived at the lab at 1:00 am. Drivers were required to drive for about 1 h on a circular highway ahead of the actual test to insure they were drowsy. After completing the driving, drivers were required to fill out a questionnaire regarding their evaluations of the simulator and subjective feelings of the experiments. And then, the actual test was immediately conducted. After completing the task, drivers were required to fill out another questionnaire.
In order to assess the effectiveness of drowsiness detection, it is essential that the ground truth is labeled. In this work, the drowsiness of the tested drivers was validated in three ways: the sleep–wake cycle, video recording, and the questionnaire.
Data collection
The vehicle parameter data included speed, acceleration, steering angle, brake pedal, gas pedal, and lateral position. These data were recorded at a frequency of 30 Hz from sensors through simulation software.
Data analysis and feature extraction
A statistical analysis and significance testing of the data collected during the experiment were conducted. Six variables, speed, acceleration, brake pedal, gas pedal, steering angle, and lateral position, were studied in this article. First, each variable was studied by analyzing the mean and standard deviation. The t-test was used to determine whether there was a significant difference between the variables during alert driving and drowsy driving. The results indicate that lateral position and steering angle are correlated with drowsiness, which corresponds with the previous research.1,29–31
While driving, drivers make two categories of steering adjustments to drive a vehicle: 1
Micro-corrections. These adjustments are for lane-keeping. Thus, the adjustments are small-amplitude oscillations in steering angle.
Macro-corrections. These adjustments are to change lanes or negotiate a curve. Thus, the adjustments are large-amplitude steering adjustments.
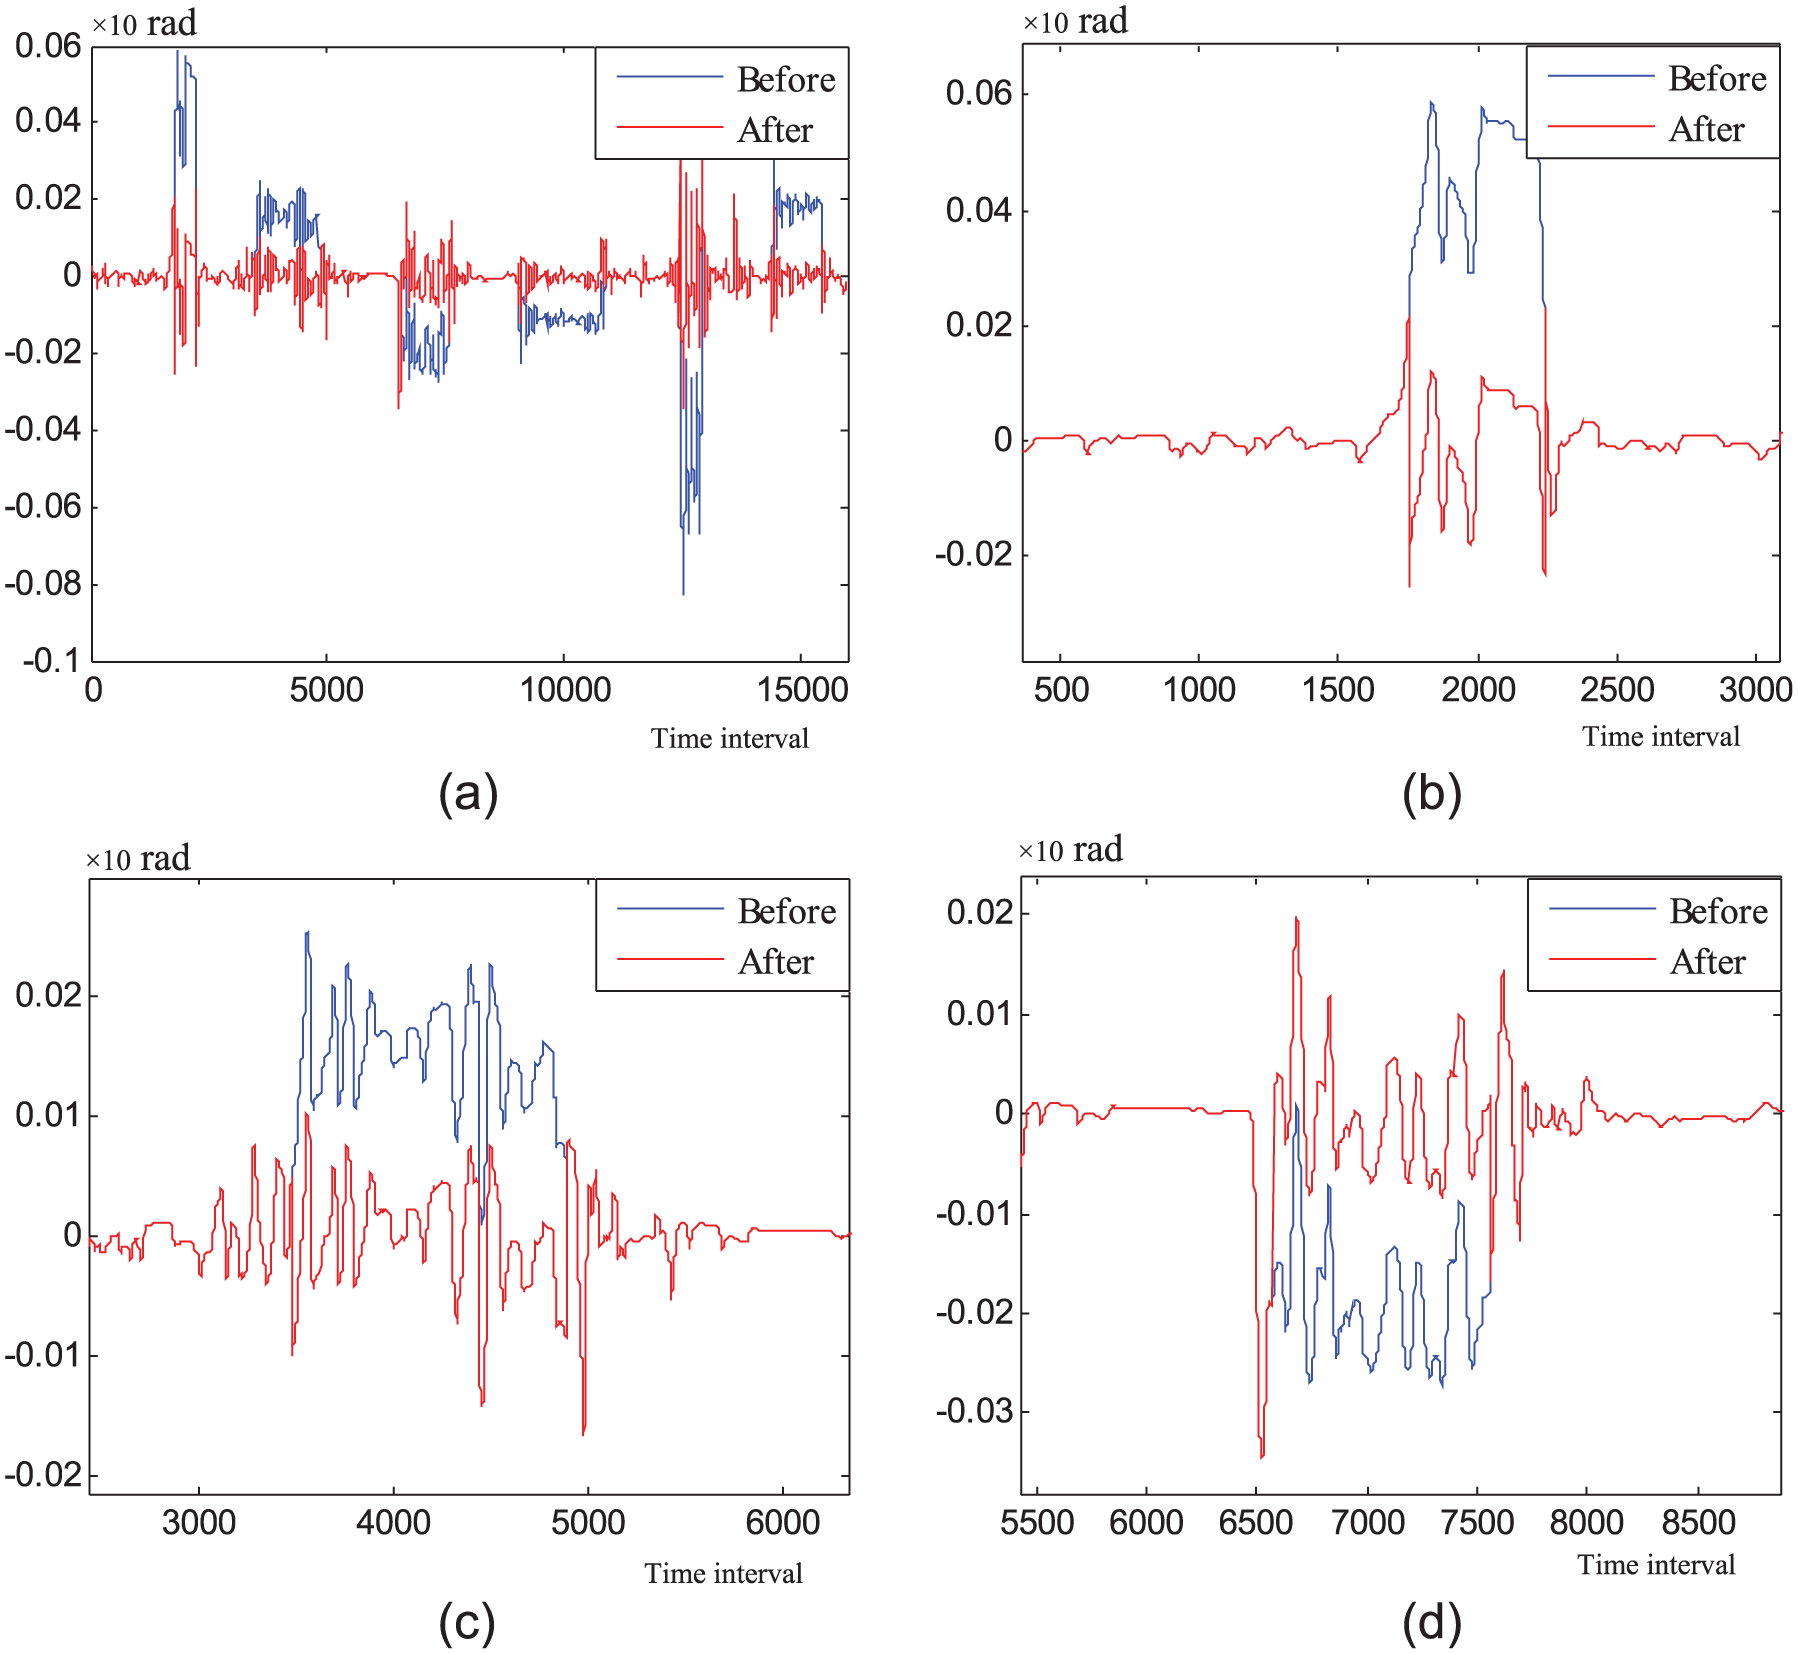
The scenario used in the experiments included both straight and curve segments. In the straight segments, the steering angle waveforms consist only of the small-amplitude adjustments for lane-keeping, while in the curve segments, the waveforms contain both road curvature and the component of steering adjustments to keep the vehicle in the center of the lane. 29 Eskandarian et al. 29 proposed that the effect of road curvature may be removed from the steering signal by subtracting the trend from the original steering wheel angle signal. The steering angle signals collected during the experiments were analyzed and tested using the method proposed by Sayed and Eskandarian. However, the results were unsatisfactory. Steering angle data of subjects 12 and 18 are taken as the examples to illustrate. Steering angle data of subjects 12 and 18 before and after road curvature removal are shown in Figures 2 and 3, respectively. Figures 2(a) and 3(a) show the steering angle data of subjects 12 and 18 who drove the car simulator on the whole road. Figure 2(b)–(d) shows the enlarged partial details of Figure 2(a). Figure 3(b)–(d) shows the enlarged partial details of Figure 3(a). From Figures 2(b) and (d) and 3(b)–(d), we can find that the waveforms by subtracting the road curvature from the steering angle in the curve sections are different from the waveforms of the straight sections. Generally, the less the radius of curvature, the more the difference. Therefore, one classifier is not enough to classify drowsiness for different road geometries. Considering these different waveforms, we constructed different classifiers for different road segments in the next section.

Steering angle data of subject 12 before and after road curvature removal.
Steering angle data of subject 18 before and after road curvature removal.
Driver drowsiness detection
As shown in section “Data analysis and feature extraction,” the features, lateral position and steering angle, have been extracted. Classification can now be performed. The goal of drowsiness detection is to classify the driver’s state into two different possible states/classes: alert or drowsy.
Drowsiness detection using three classifiers
Our experiments were conducted on a Windows 7 machine with a 2.50-GHz CPU and 4.0-GB RAM. In total, 22 drivers completed the actual experiment and 44 samples were obtained. Three kinds of classifiers were used: KNN, SVM, and ANN. The 10-fold cross-validation was used to evaluate the performance of the classifiers. Lateral position and steering angle during the first 13 s when the subject entered the different road segments were selected as input feature vector for classification. It means that the number of input feature vector is 780 (two features, the data collected during 13 s and the collection frequency of 30 Hz). The features were normalized and labeled as either “alert” or “drowsy” before proceeding to build a classifier.
Drowsiness detection using KNN classifier
KNN does not have the training process. The block diagram of drowsiness detection using KNN classifiers is given in Figure 4. We used Euclidean distance as distance metric. Since the number k of nearest neighbor can influence the accuracy of the overall classification, we tested with six different k values: 1, 3, 5, 7, 13, and 19. As described in section “Data analysis and feature extraction,” the classifiers were constructed for each curve segment, respectively, while only one classifier was constructed for all straight segments. Namely, there were seven KNN classifiers, among which six classifiers were constructed for six curve segments, respectively, and one classifier was constructed for all straight segments.
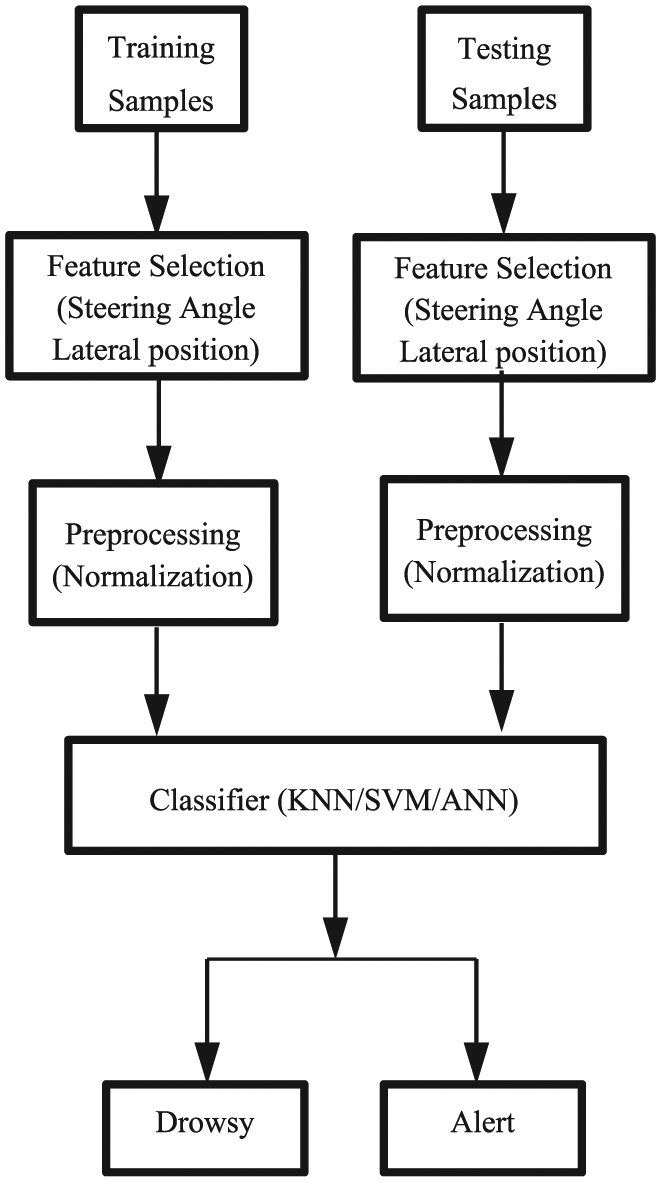
Block diagram of drowsiness detection.
Drowsiness detection using SVM classifier
Unlike KNN, SVM has both training and testing processes. The block diagram of drowsiness detection using SVM classifiers is also given in Figure 4. In these experiments, radial basis function (RBF) kernel was employed. Accordingly, there are two parameters, the RBF kernel parameter σ and the cost parameter C, to be set. In our experiments, we tested with six different σ values: 0.1, 10, 15, 50, 90, and 200 and C was set equal to 1. Similarly, there were seven SVM classifiers, among which six classifiers were constructed for six curve segments, respectively, and one classifier was constructed for all straight segments. The classifiers were tested by the 10-fold cross-validation.
Drowsiness detection using ANN classifier
Like SVM, ANN has both training and testing processes. The block diagram of drowsiness detection using ANN classifiers is given in Figure 4. In this article, a two-layer feedforward neural network was selected. Number of neurons in the input layer is 780. Number of neurons in the output layer is 1. Number of neurons in the hidden layer is not fixed. We tested with five different numbers of neurons in the hidden layer: 10, 20, 30, 50, and 100. The sigmoid was used for the hidden layer, and the linear was used for the output layer. Gradient descent backpropagation method with momentum and adaptive learning rate was used for neural network training. 32 The network was trained by gradient descent backpropagation method with momentum and adaptive learning rate, with an initial learning rate of 0.01. The training was terminated when the total sum of squared errors became less than 0.0001. Similarly, there were seven ANN classifiers. The classifiers were also tested by the 10-fold cross-validation.
Classification results
Classifier performance measures
Let us consider a drowsiness detection that seeks to determine whether a driver is drowsy. Detection outcomes are labeled either as drowsy (positive) or alert (negative). Classifier performance was evaluated with three different measures: true positive rate (TPR), false positive rate (FPR), and accuracy (ACC).
Classification result analysis
KNN classification results
TPR, FPR, and ACC of the classifiers were calculated. Table 1 presents the performance of KNN classifier when different values of k are considered. From Table 1, we observe that the best value for the k is 3. It seems that k values between 1 and 5 are suited for drowsiness detection tasks in the experiment. KNN is very simple to understand and easy to implement. However, the classifiers show low accuracy. Table 2 shows the total execution time in seconds.
Performance measures of KNN classifier.
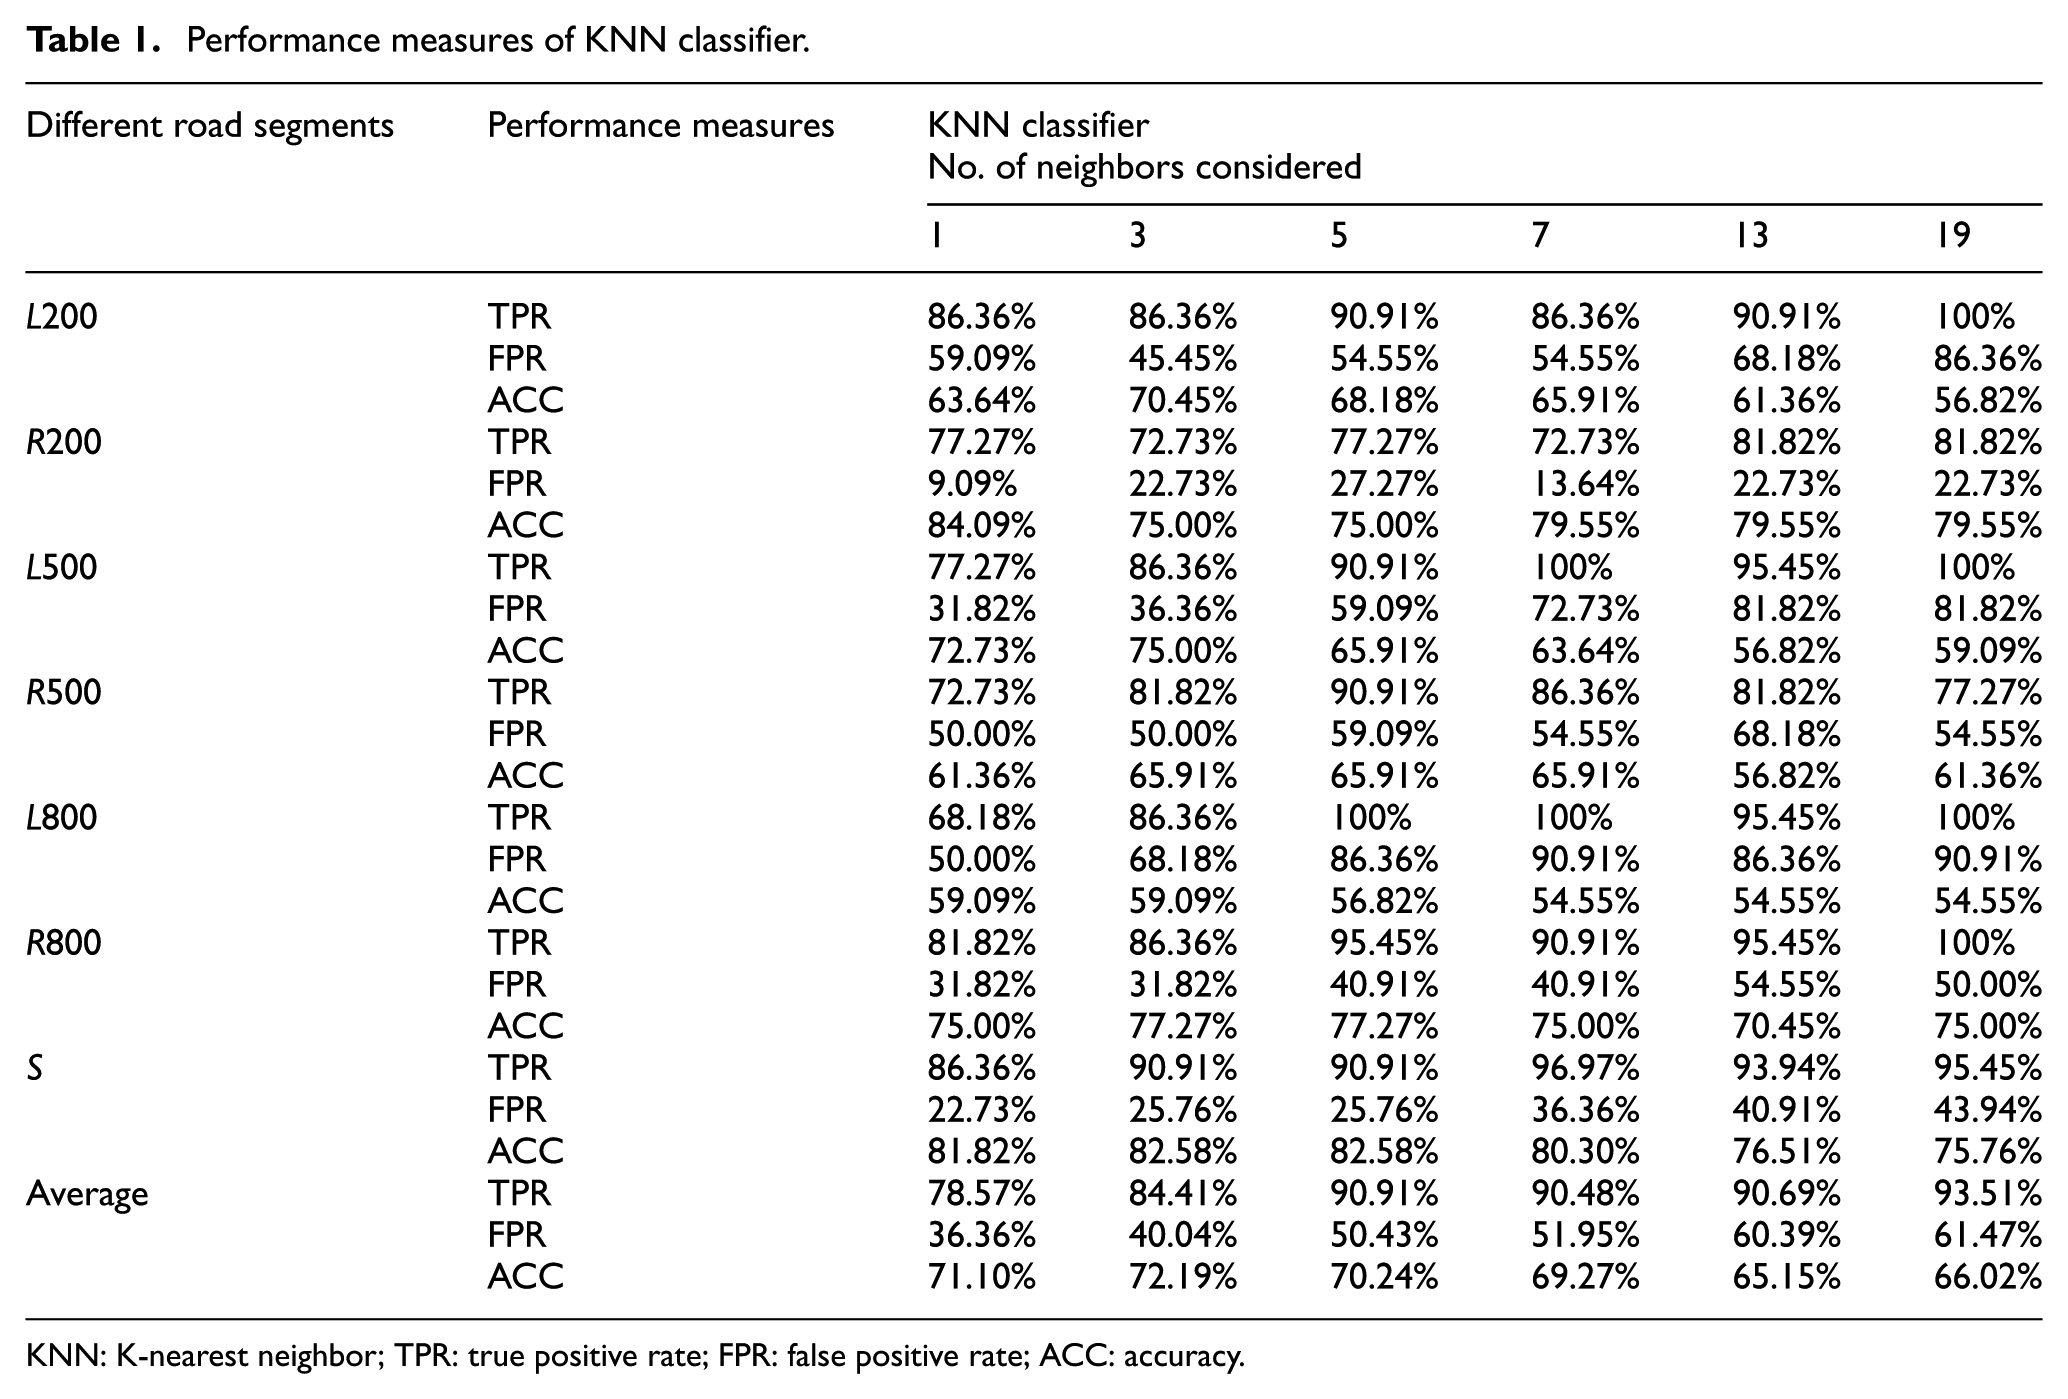
KNN: K-nearest neighbor; TPR: true positive rate; FPR: false positive rate; ACC: accuracy.
Execution time of KNN classifier in seconds.

KNN: K-nearest neighbor.
SVM classification results
TPR, FPR, and ACC of the classifiers were calculated. Table 3 presents the performance of SVM classifier when different parameters of σ are considered. Table 4 shows the training time and classification time in seconds. From Table 3, we observe that the best value for σ is 15. It seems that σ values between 10 and 50 are well suited for drowsiness detection tasks in the experiments.
Performance measures of SVM classifier.
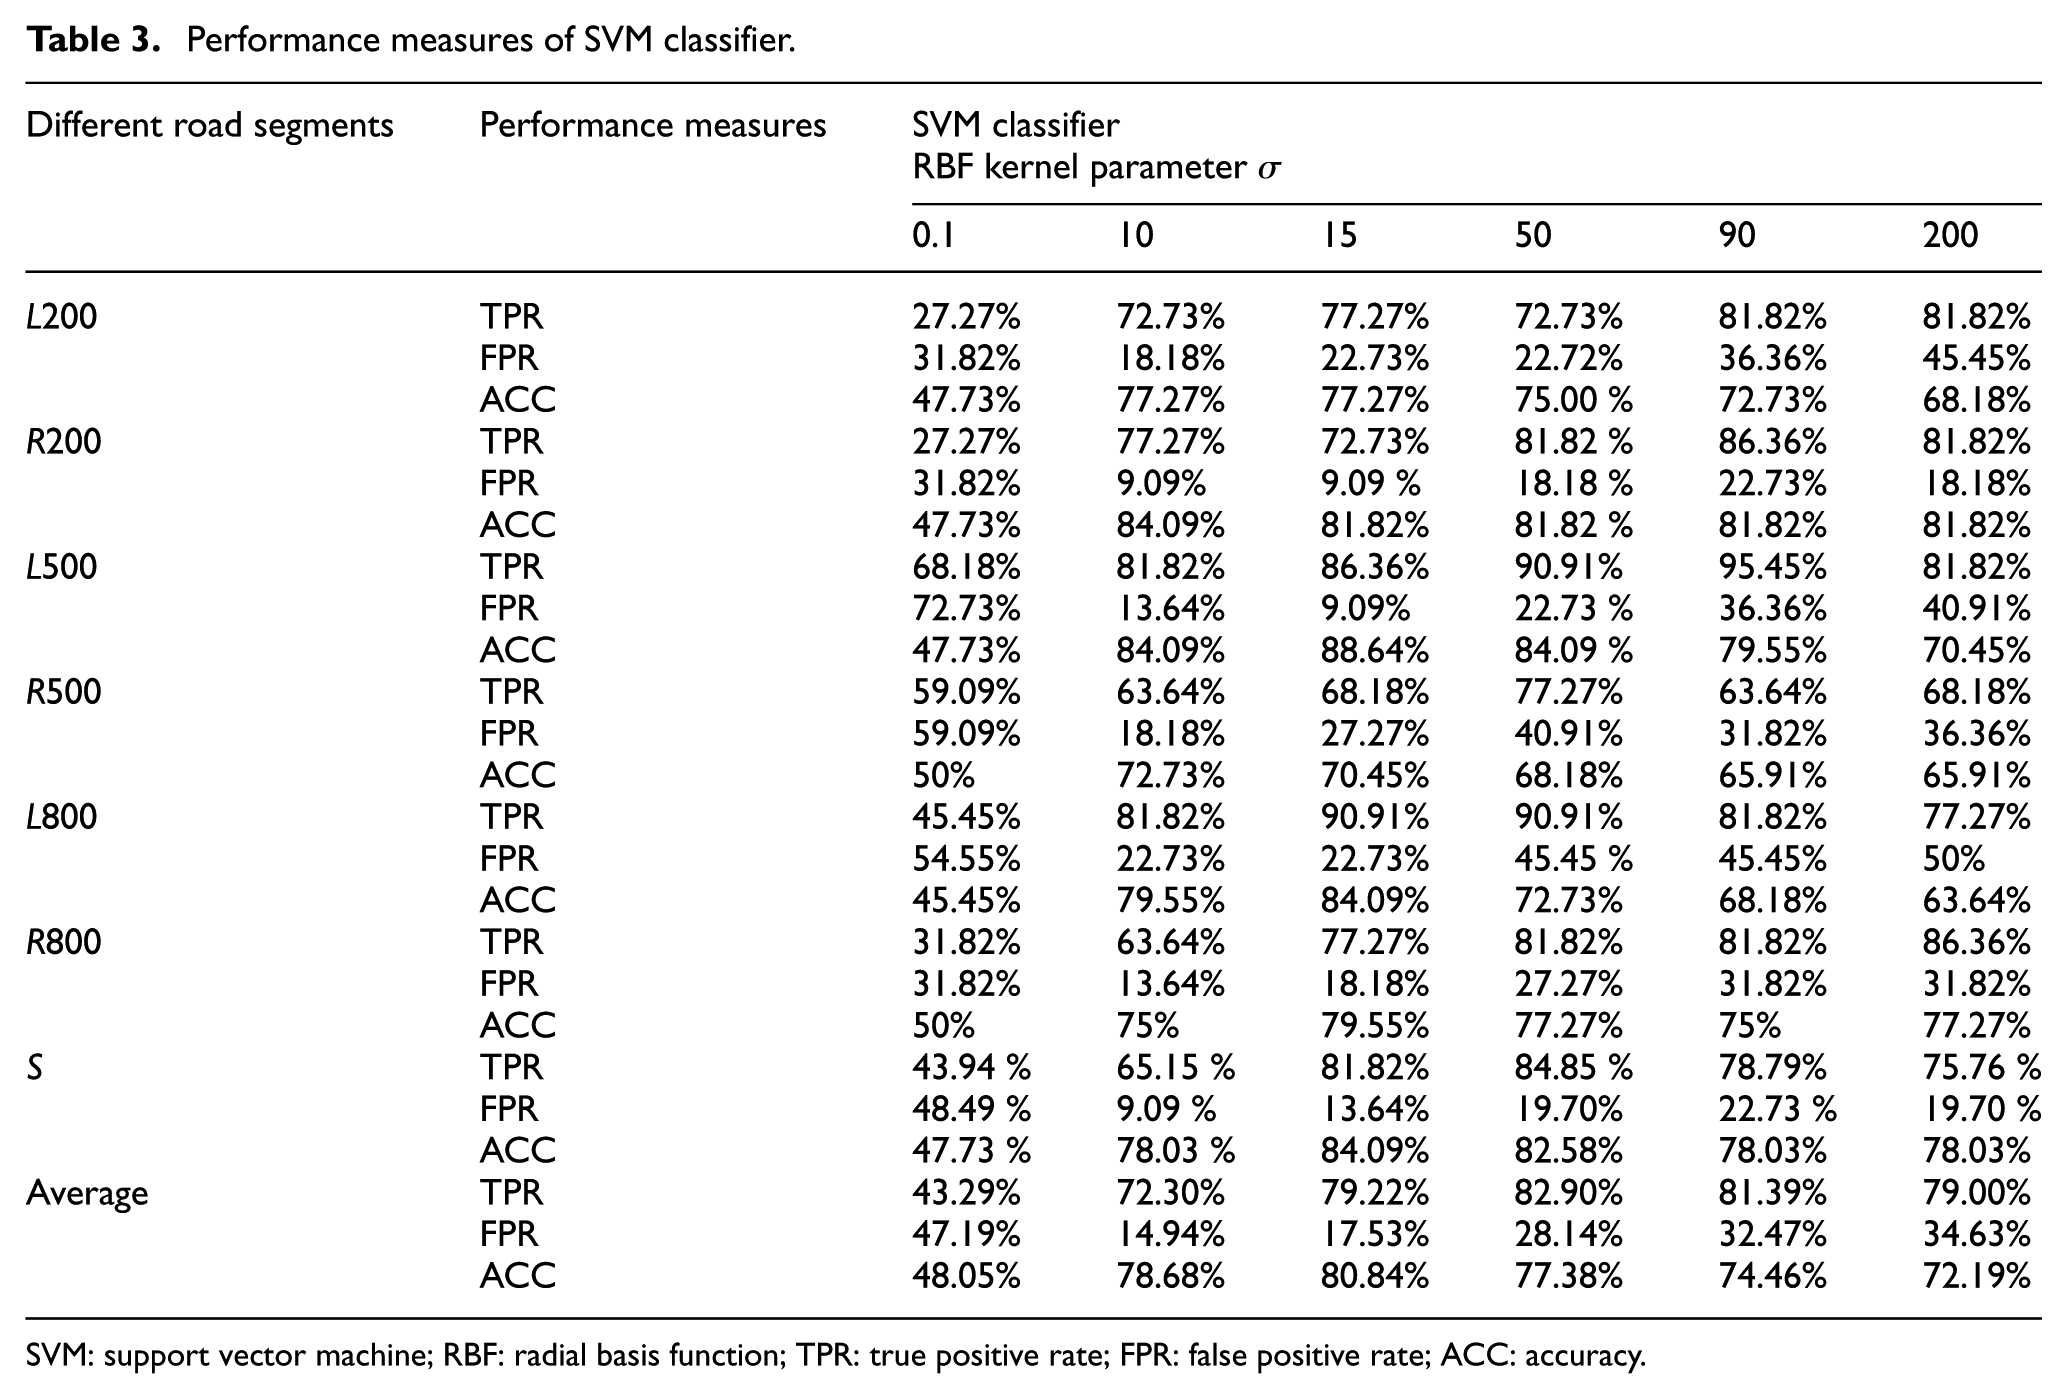
SVM: support vector machine; RBF: radial basis function; TPR: true positive rate; FPR: false positive rate; ACC: accuracy.
Execution time of SVM classifier in seconds.

SVM: support vector machine; RBF: radial basis function.
ANN classification results
As described in section “Data analysis and feature extraction,” the network was trained by gradient descent backpropagation method with momentum and adaptive learning rate, with an initial learning rate of 0.01. The training was terminated when the total sum of squared errors became less than 0.0001. We calculated TPR, FPR, and ACC. The results are shown in Table 5. According to this table, the classifier with 100 neurons in the hidden layer performs the best in terms of accuracy. Table 6 shows the training time and classification time in seconds.
Performance measures of ANN classifier.

ANN: artificial neural networks; TPR: true positive rate; FPR: false positive rate; ACC: accuracy.
Execution time of ANN classifier in seconds.
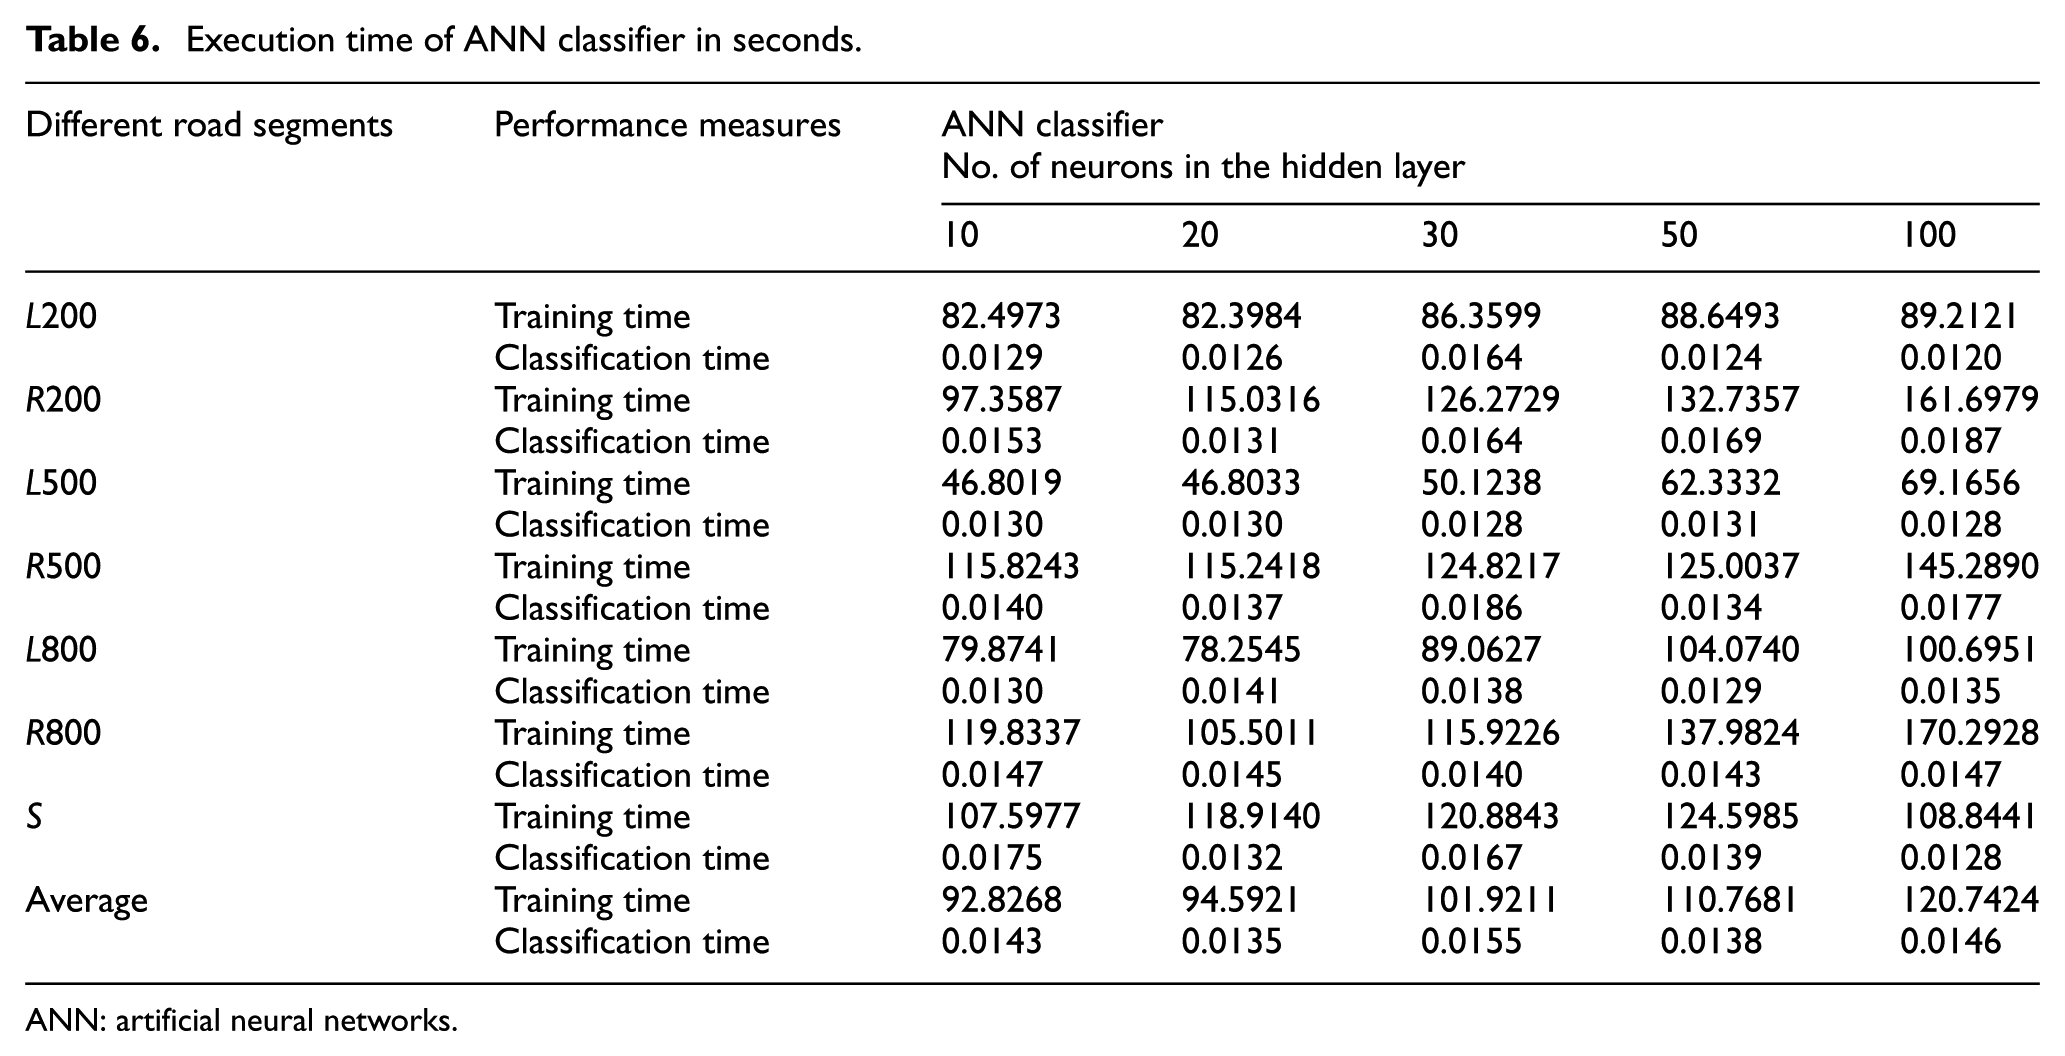
ANN: artificial neural networks.
Discussions
The classifier with the best performance measures was selected and compared for KNN, SVM, and ANN classifiers. For KNN classifier, the highest accuracy of 84.09%, with a TPR of 77.27% and an FPR of 9.09%, was achieved at curve segment R200. For SVM classifier, the highest accuracy of 88.64%, with a TPR of 86.36% and an FPR of 9.09%, was obtained at curve segment L500. For ANN classifier, the highest accuracy of 90.91%, with a TPR of 100% and an FPR of 18.18%, was obtained at curve segment L500. In general, classification time is more useful than training time in practical application because training can be performed offline and is only needed to be performed once. Accordingly, the average accuracy and classification time of three types of classifiers are compared in this article. The results are shown in Figures 5 and 6. The Friedman test was used to examine the significant difference in the accuracy among three classification methods because the data did not fit a normal distribution. The SPSS software and STAC 33 were used to perform statistical analysis. The results (the test statistic value χ 2 (2, 7) = 9.556, p = 0.008 < 0.05) show that there is a significant difference among three classification methods. Accordingly, it is meaningful to conduct pairwise comparisons to identify the differences between the classification methods. Nemenyi post hoc test was used for pairwise comparisons. The results are shown in Table 7. We can see from Table 7 that there is no statistically significant difference in the accuracy between SVM and ANN. Significant differences from KNN are found for SVM (p = 0.015) and ANN (p = 0.048). We can find that the SVM classifier achieved the fastest classification time and the highest average accuracy (80.84%) when σ is equal to 15. The ANN classifier, created with 780 inputs and 1 output, came last in classification time. Compared to SVM, classification time of ANN is much longer. Overall, SVM and ANN are better choices for drowsiness detection.

Average accuracy.

Classification time.
Results of pairwise comparisons.

KNN: K-nearest neighbor; SVM: support vector machine; ANN: artificial neural networks.
The experimental results are encouraging. It can be seen that SVM and ANN classifiers achieve satisfied results in the classification. The study of Eskandarian et al. 29 reported that ANN had a TPR of 85%. S Lawoyin 34 detected drowsiness using SVM to analyze the steering wheel signals and achieved an accuracy of 81.25%. Our study is consistent with the results of these previous researches. SVM and ANN are effective classification methods for detecting drowsy driving with different road geometries.
Conclusion
This article reveals vehicle performance measures of drowsy driving on different road segments based on a driving simulator. Vehicle performance measures (speed, acceleration, brake pedal, gas pedal, steering angle, and lateral position) were analyzed and evaluated to examine their correlation with drowsiness on different road segment types. We find the waveforms by subtracting the road curvature from the steering angle in the curve segments were different from the waveforms of the straight segments. Furthermore, the less the radius of curvature, the more the difference. Therefore, the classifiers were constructed for each curve segment, respectively, and only one classifier was constructed for all straight segments. Finally, we found that the SVM classifier achieved the fastest classification time and the highest accuracy (80.84%). SVM and ANN are effective classification methods for detecting drowsy driving with different road geometries.
A limitation of this study is that only three types of curve radii were studied, which may not be sufficient to effectively develop a drowsy-driver detection system. Accordingly, future studies will use more roadway geometries. In addition, there might be a significant difference between the driving behavior–based measures during real driving and simulating driving. Hence, further studies are needed to analyze the performance of the classifiers based on a field study.
Footnotes
Academic Editor: Bryan(Byung-gyu) Kim
Declaration of conflicting interests
The author(s) declared no potential conflicts of interest with respect to the research, authorship, and/or publication of this article.
Funding
The author(s) received no financial support for the research, authorship, and/or publication of this article.