
Abstract
The early detection and monitoring of kidney disease continues being an important problem in medicine. The diagnosis and treatment of patients with this disease usually require expensive medical equipment that is difficult to install. Patients or medical centers may not always be able to afford such equipment. This work proposes the creation of a wireless sensor network for medical environments; it will assist medical professionals in the diagnosis and monitoring of patients with renal symptomatology. This work will focus on the analysis of symptoms that accompany this disease and the design of a system which will help determine types of kidney diseases. The proposed system will incorporate new hardware mechanisms and an intelligent system. It will be designed through a multi-agent architecture based on virtual organizations. This architecture will include a new model of agents, specifically designed to be incorporated into computationally limited devices. This hardware will be characterized by its low cost and ease of use. A case study has been carried out in order to validate the proposed architecture. In order to validate the proposed architecture, we designed a case study that aims to provide a technological tool for medical professionals and makes it possible to determine any diseases related to diuresis. The initial results are promising.
Keywords
Introduction
Kidney disease affects 10% of the world population. 1 In the United States, more than 100,000 people are diagnosed with kidney failure every year, 2 a serious condition in which the kidneys no longer remove waste from the body. Deaths from kidney diseases have doubled in the past 20 years, making it one of the 10 most common causes of death. 3 Kidney diseases have no cure, and they are progressive, silent, and do not present any symptoms until advanced stages. 4 Many countries lack the resources to purchase the necessary equipment for the proper diagnosis of the disease in its early stages.
It is vitally important to design new tools that enable us to detect kidney anomalies in their early stages and to provide patients with a treatment that will improve their quality of life. Thanks to the remarkable progress in the field of electronics, we are now able to create advanced systems that greatly change and improve our lives. What specifically gives us this possibility is the continuous decrease in the size of devices and lower production costs. These advancements enabled scientists to develop low-cost sensors and communication systems. They propose new solutions to a wide range of problems in many different areas. From smart homes, sports devices, and cars to home care and medicine, these solutions have greatly improved the quality of our life. This article will focus on the design of a new, low-cost tool capable of diagnosing and monitoring kidney disease. Sensor networks can gather useful and detailed information on patients’ health, which can then serve as a basis for diagnosis and assist medical professionals in making decisions related to treatment and care.
Embedded or external sensors that make up a wireless sensor network (WSN) 5 are used to monitor the physical parameters of our environment. They have a great capacity to acquire data and act in the environment. In combination with ambient intelligence (AmI), 6 we obtain a system that is capable of processing and transmitting the information captured by these sensors. In recent years, sensor networks have become increasingly important and they have been employed in a wide range of areas that affects all aspects of our society. Their great capacities allow for the construction of context-sensitive systems able to analyze complex and flexible processes. On the basis of such analyses, services are then provided to users. At present, we are unaware of any system that would be capable of monitoring urine output (the amount of urine produced at a given time). There has also been no system which would provide medical professionals with intelligent information that could serve for the diagnosis and treatment of this disease. The absence of such a system makes it imperative to research sensors and mechanisms. This knowledge will enable us to develop solutions required to detect abnormalities in the patient’s urine output. Multi-agent systems (MASs) are currently of great interest to researchers, and this is because they incorporate techniques derived from artificial intelligence; this means that they can be used to resolve problems imitating human reasoning.
This article presents an MAS 7 which is based on virtual organizations and is able to interconnect sensors. Its principal aim is to provide a real-time monitoring service of diuresis. In addition to the MAS, this article presents a low-cost wireless hardware specifically developed to monitor diuresis in patients. The computationally limited devices make Platform for Automatic coNstruction of orGanizations of intElligent Agents (PANGEA) 8 an ideal platform, since it allows for the deployment of agents embedded in sensors in a way that is simple, fast, and scalable. The communication between the different components is flexible and light, in a way that consumption is optimized and battery life lengthened. The MAS monitors the volume of urine excreted by patients during a specific period of time. In addition, the system analyzes the data, determining pathologies such as polyuria, anuria, and oliguria.
The system created as a result of this work can be used in hospitals or in the patient’s place of residence. Therefore, this work considers usability and reduced economic cost as primary factors of the proposed solution. The WSN and the hardware components that are involved in the case study are small in size. This grants the patients greater mobility, who may often need to move between their home and the hospital, carrying a bag for several days.
This article is organized in the following way: section “Background” reviews related literature, analyzing current solutions and the techniques used. It also describes the requirements of this kind of solution. Section “Proposed architecture” describes the architecture proposed in this work, with a special focus on the new model of embedded agent. Section “Case study” describes the case study that was designed to evaluate the architecture in a real environment. Finally, in section “Conclusion,” we present the results and the conclusions obtained.
Background
This section consists of two sub-sections. The first section focuses existing technological solutions for monitoring urine output. Section “Background” focuses on the present proposals for weight measuring techniques, an aspect which is essential in the proposed intelligent system.
Technological devices
Monitoring urine output is one of the most commonly used indicators in tracking certain kidney diseases. 9 Currently, there are different solutions such as the UniMiter, produced by the Unomedical 10 company, or the 2000 Kendall Curity Precision 400-mL Urine Meter 11 produced by the American company South Kendall Medical Services. These devices consist of a bag with a double compartment, and its white meter background enables the medical practitioner to easily obtain the measurement of the fluid levels. Thus, this system is manual and requires a medical professional to read the values. It is a widely used device in the majority of hospitals across the world. Due to its low cost, it has neither electronic sensors nor a measuring device; all the measures have to be taken manually. Furthermore, as these devices come into direct contact with the urine, they cannot be reused on other patients and must be discarded every 4–6 days.
Urinfo 2000, is a new device, described in Paz and Paz. 12 This device directs the patient’s urine into a small valve which then transforms the liquid into a uniform drip system and subsequently turns the generated drops into exact measurements through an optical drip counting system. 13 This system provides an accurate and easy measurement since it incorporates a small display. It also has a small container with an optical drops counter and a urine collection system that uses a set of disposable bags. The optical system uses infrared light technology to provide automatic measurement, and the calculated amount of urine excreted by a patient is relatively reliable, with a mean error of 5 mL. In this work, 14 the authors conducted a comparative study using a prototype of the device based on infrared technology, as is shown in Figure 1. This study compared their measurements and results with other analog devices, it used a sequence of measurements excreted by several patients, over a period of 6–9 h. Manual measures were performed using analog devices such as the UniMiter, and also automatic measures with the use of Urinfo 2000. The urine volume measured by both devices was manually validated by a laboratory technician using a measuring cylinder with an accuracy of ±1 mL of reference. After a total of 453 measurements, 167 of which were performed with the analog device and 286 with the automatic device. The percentage of deviation with the latter was calculated to be 8%, compared with a much higher 26% obtained from use of the analog device. In their conclusion, the authors of this study emphasized that the use of a digital system eases the medical professionals’ work and increases accuracy in data collection.

Urinfo 2000 device.
However, the main problem of the automatic device is its high cost, since its optical counting system includes high-priced hardware, limiting its use in medical centers and hospitals. Another problem with this device is that it is not connected to the medical data center. In the year 2015, the Chinese company Million 15 launched a device that is similar to the automatic devices described above, and it also uses a drip counting system to measure the quantity of liquid stored in the container.
This device, called Urine meter MU1200, 16 has succeeded at reducing the cost of such products; however, it is still impractical when it comes to real-time monitoring. This is because it is not equipped with an external connection and urine measurements cannot be monitored remotely.
A review of the state of the art indicates that there are few research papers focusing on urine measurement systems. Some notable works have been carried out by Otero et al.17,18 They include a device equipped with two capacitive sensors which take constant measurements of the height of the of liquid, accumulated in the two chambers of the container. The urine enters the vessel, first through the smaller chamber. Once it is filled, it overflows into a second larger chamber. The first chamber provides accurate measurements of the urine excreted, while the second avoids the need for frequent interventions by nurses. The measures are sent via Bluetooth connection technology to a Java program that runs on a computer. It is in charge of calculating the quantity of urine from this information and monitors the patient’s progress. The authors estimated that the error in the measurements is 2% in comparison with the errors made in manual measurements. Although the sensor sends data to the computer every hour, it is not able to monitor in real time. In addition, when using Bluetooth wireless communication technology, a computer must be located nearby, which complicates the process. Moreover, the implementation of the system is more expensive. Although this solution has a lower final cost than the solutions described above, it is still expensive for the hospitals. The authors have estimated its cost to approximately US$400 for each device, an expense that the vast majority of medical centers cannot afford.
Measurement systems
A review of the current measurement systems identifies load cells as the principal element. A load cell is a physical item that can translate the pressure of an element into an electrical signal. 19 The best-known types of load cells are: 20
Hydraulic load cells (Figure 2). They have a piston or a cylindrical design. When a force is applied, a motion is exerted on the piston, producing a change in the pressure of the Bourdon tube, which is connected to the load cell.
Pneumatic load cells (Figure 3). They are based on the use of a piston, on top of which a pressure is exerted. Depending on the load, we obtain a greater or lesser value in the pressure gauge, and are able to determine the magnitude of the load applied to the piston.

Hydraulic load cell. 20
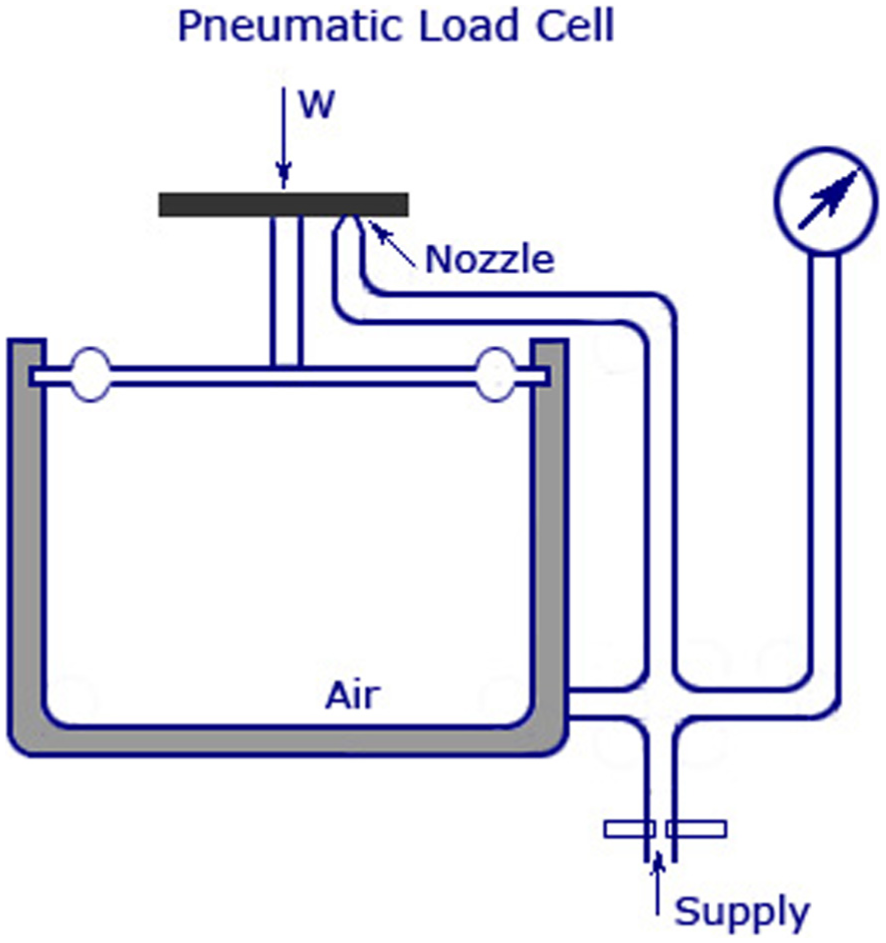
Pneumatic load cell. 20
This work seeks to automate the measurement and monitoring of the urine excreted by a patient. At the same time, the device aims to provide information about the current patient data. The analysis of this information is provided by the PANGEA multi-agent platform. PANGEA, apart from its ability to deploy agents embedded in small devices, is also a simple and low-cost architecture. With respect to the technologies used so far, the employment of this architecture means a considerable improvement in the collection and analysis of data. The cost of the proposed solution is less than US$15, while the cheapest solution described in the state of the art amounts to US$400. This makes our solution an affordable tool for medical centers worldwide. The size of the device designed in this work is greatly reduced in comparison to the devices outlined in the state of the art. The proposed device manages information in a way that makes it possible to store and transmit it wirelessly. Thus, data can be integrated with the different monitoring platforms. In comparison to the rest of the studied solutions which are not universal, our solution is non-invasive and works with any type of bag, regardless of the size or its manufacturer. From the examination of the existing solutions, it is evident that the development of a universal, versatile, and low-cost device is necessary.
Proposed architecture
The architecture proposed in this article aims to provide a solution for medical environments, ensuring the use of limited resources (microcontrollers with low computing capacity), hybrid and dynamic topologies, quality service, data redundancy, and high security, in order to solve the shortcomings of the systems observed in the state of the art. Another objective of the proposed architecture is the ability to dynamically adapt to the context changes that occur in the medical environment and to the particular needs of each individual. In order to achieve these objectives, the use of distributed artificial intelligence is required, as well as organizational aspects, which will provide the system with capabilities similar to those in human societies. Organizational aspects also need to be included. However, existing multi-agent architectures do not take into account aspects of organization that allow defining rules to manage the inclusion of agents, reorganization, and communications in the system.
For this reason, our work proposes the use of an open MAS PANGEA. 8 It has been previously created by the research group, and it allows system components to enter or leave the platform dynamically. Also, it can be part of the architecture at any time, meeting the specific demands of the system. Table 1 compares the characteristics of the different MAS platforms. It should be noted that open MASs are a relatively new solution that enables autonomous entities to freely join and leave the system. A MAS must offer services on demand. Consequently, the agents that join the platform are responsible for informing the network of the services that they can offer to the other entities in the architecture.
Comparison of multi-agent systems.

MAS: multi-agent system; SOA: service-oriented architecture; JADE: java agent development framework; FIPA: foundation for intelligent physical agents; SACI: simple agent communication infrastructure; ACL: agent communication language; IRC: internet relay chat; OS: operating system.
Figure 4 shows the different virtual organizations and leading actors that form the multi-agent architecture designed in this work.

Virtual organization scheme agents.
As shown in Figure 4, the architecture clearly has two distinguishable parts. The top part of the image shows the agents that manage the PANGEA platform. The bottom part of the image shows the virtual organizations specially designed for the problem of urine output, as well as the case study designed to evaluate this work. The main components of the MAS are described below.
PANGEA MAS
It is developed by the BISITE Research Group of the University of Salamanca. It facilitates the creation and implementation of case studies based on WSNs. It is an open MAS based on organizational theory and represents virtually organizational structures. Unlike other current systems, such as THOMAS 23 or java agent development framework (JADE), 22 it allows for the deployment of agents in computationally limited devices. Some of the distinguishing features of PANGEA is its rules engine and its load distribution system. This allows the system to adapt to the computational needs of the system at a given moment. It enables the development of retro-compatible MASs with the standard foundation for intelligent physical agents (FIPA)-agent communication language (ACL) 24 and the simple creation of type beliefs-desires-intentions (BDI) and case base reasoning (CBR)-BDI agents. We will now explain the most important features of the agents that form this platform:
Manager agent. Responsible for monitoring the correct functioning of the architecture. It makes periodic checks to verify if there are any overload problems in the communication among the elements that form the architecture.
Information agent. This agent is also known as the “yellow pages” agent or directory agent. Its main function is to inform the elements accessing the architecture, about the virtual organization, which is responsible for providing a particular service.
Organization agent. One of the most important roles in the MAS, and this agent creates and supervises the proper functioning of the virtual organization.
Sniffer agent. this agent is responsible for preparing reports about the use of the architecture. It provides information on the hours during which the system is more overloaded. It also indicates the most requested services and the different information flows that occur during the communication between two entities.
Normative agent. Its main function is to ensure compliance with the implicit rules in the MAS. It is responsible for monitoring whether an entity can communicate with another, that is, if an entity can access a given virtual organization at a given time.
Database agent. This is the only role of the platform with the ability to access to the database management system, focusing on tasks related to integrity and data consistency. If an entity of the platform wants to perform any operation on the database, it must request this capability from the database agent.
Given this brief analysis of the agents responsible for managing the PANGEA platform, we will now explain in detail the main functions of each virtual organization designed to provide a solution to the problem of this study.
Control center organization
The agents in this virtual organization are responsible for monitoring and analyzing the data provided by the urine sensor organization and for sending alarms or signal events in certain situations. The organization is designed as an intelligent system. An analysis agent with advanced capacities is designed to process a series of rules that define the behavior of the organization. According to these rules, the analysis agents acquire knowledge, analyze situations, and send alerts or recommendations to system users. In addition, this virtual organization includes agents that are specialized in information analysis and presentation of results. The presentation is done primarily through reports and statistical papers, which are used in the final application of the user. If an agent of the organization has an anomaly in terms of operation, this organization must solve or duplicate the functionality of the agent experiencing the problem, without interfering with the rest of the system.
Application interface organization
A virtual organization whose agents are responsible for interacting with the end users of the system. This organization designs the agents, known as connectors or adapters, which incorporate data adaptation mechanisms. They adapt the original format of the physical sensing layer to the different applications. In the case study presented in this article, this organization interacts with the user through a website and a mobile application. In this way, two types of agents, the web agent and the mobile agent, act as a bridge between the services offered to the users and the multi-agent architecture.
Urine sensor organization
This organization contains each of the embedded agents that are deployed at each of the measurement sensors. The embedded agents are independent and they communicate with PANGEA through the use of a light and open communications protocol, such as message queue telemetry transport (MQTT). 25 The agents with the MQTT role act as a gateway and are responsible for connecting these messages with the rest of the platform.
Hardware design
This section describes the operation of the hardware designed with the specific aim of achieving a successful case study as outlined in section “Case study.” This work uses a gauge load (Figure 5) cell. Its main operations is based on the existence of an element that detects the force applied to the cell, that is based on the deformation of an element whose structure is usually formed by copper wires.
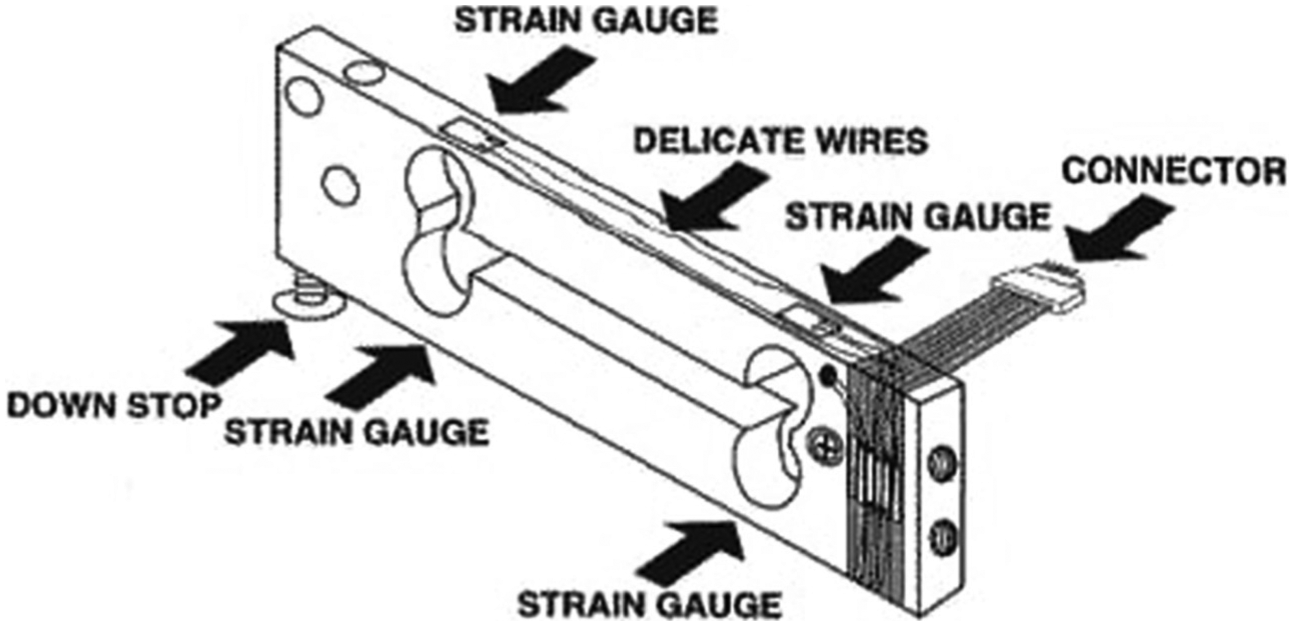
Strain gauge load cells. 20
Below, we describe the gauge cell used in this work in greater detail. These types of cells measure the electrical resistance in response to a force applied to the device. Usually, the element that measures the resistance, also known as deformation meter, is composed of a very fine wire manufactured with a material of copper or aluminum. This gauge element is based on a grid design. When the pressure is applied on this element, a linear change in the resistance occurs. The resistors used in the deformation gauges tend to be 120, 350, and 1000 Ω. The resistors used in each of the load cells have a different sensitivity tension, named “gauge factor.” When using deformation meters made of metallic material, the most commonly used in the majority of devices, the tension is close to 2.
However, experimentally, we see that the deformations that occur in a deformation meter are relatively small, approximately a few millistrain

The electrical resistance, which gives us a force magnitude that is being exerted on the device, is very small. Consequently, the majority of electronic devices that we could use to measure the obtained value will not be suitable, because they cannot precisely detect the correct value. Therefore, it is necessary to use an electronic device that is capable of measuring the values and changes that occur in the electrical resistance and changing that unit into something that we can measure with a unit of mass (g). To do this, we are using an amplifier module named HX711. Its operation is based on the use of four resistors with a strain, shown in Figure 6, which together form the “Wheatstone bridge.” 26

Wheatstone bridge. 20
If Vin is a tension that is constant and known, then the resulting Vout is measured in the following way

where Vin and Vout are the voltages of input and output; R1, R2, R3, and R4 are the resistance. We deduce that Vout is 0. However, if there is a variation in one of the heating elements, the Vout will be affected, as it is based on the following equation (Ohm’s law) (equation (2))

If we change one of the resistances in the Wheatstone bridge, we can easily measure the resulting value in Vout and get the force applied to the cell load (Figure 7).

Full-bridge strain gauge circuit. 20
At the electronic level, the datasheet for the HX711 module indicates that five pins (red, black, white, green, and yellow) should be used (Figure 8). Its colors are typically used for load cells. The red, black, green, and white wires are connected to the deformation meter in the Wheatstone bridge, and the yellow wire is an optional wire which prevents any interference.
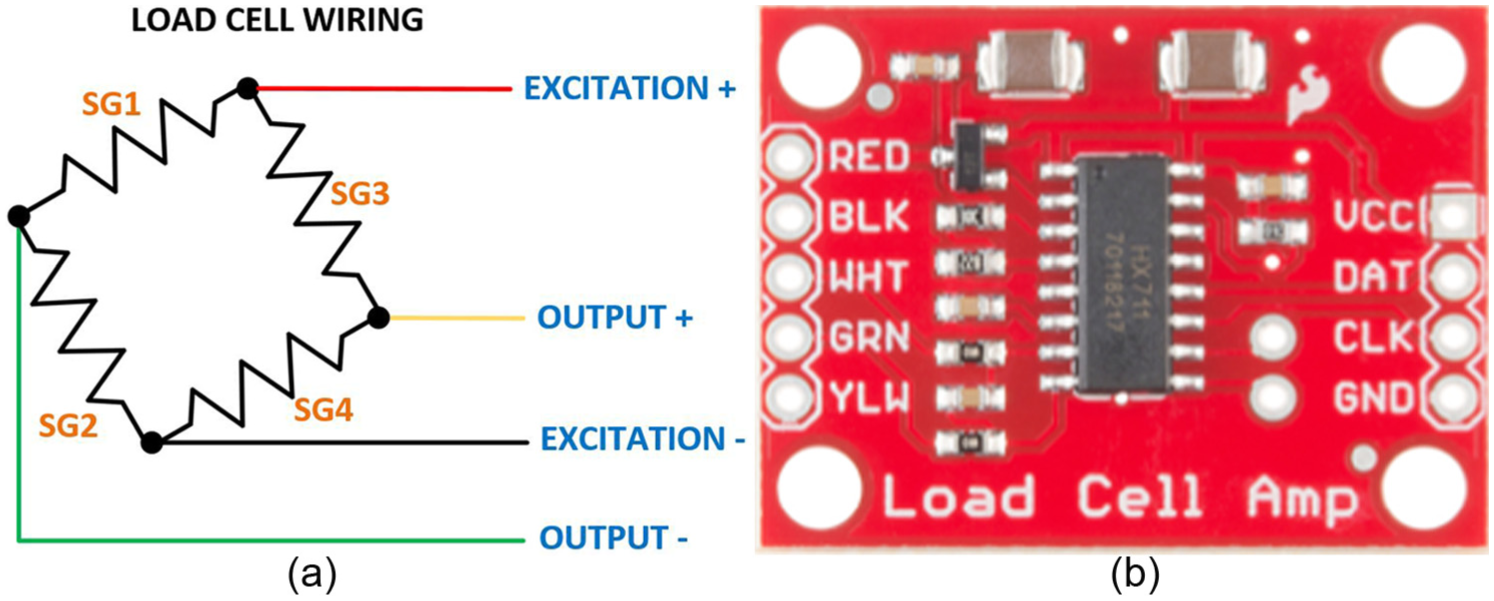
Load cell wiring. 20
To detect these diseases, it is necessary to know the amount of liquid produced by an individual during a specific interval of time. For that, we have designed a sensor, which can measure the liquid passed by an individual and relay that information to a central computer. Given that the sensor is mobile, it can be carried by the patient or used by persons with disabilities. Due to existing Wi-Fi connections in most hospital and elderly residences, we chose to use a hardware that supports 802.11 standards, thus allowing us to provide a simple, low cost, and rapid implementation. Figure 9 provides a diagram of the architecture presented in this case study.
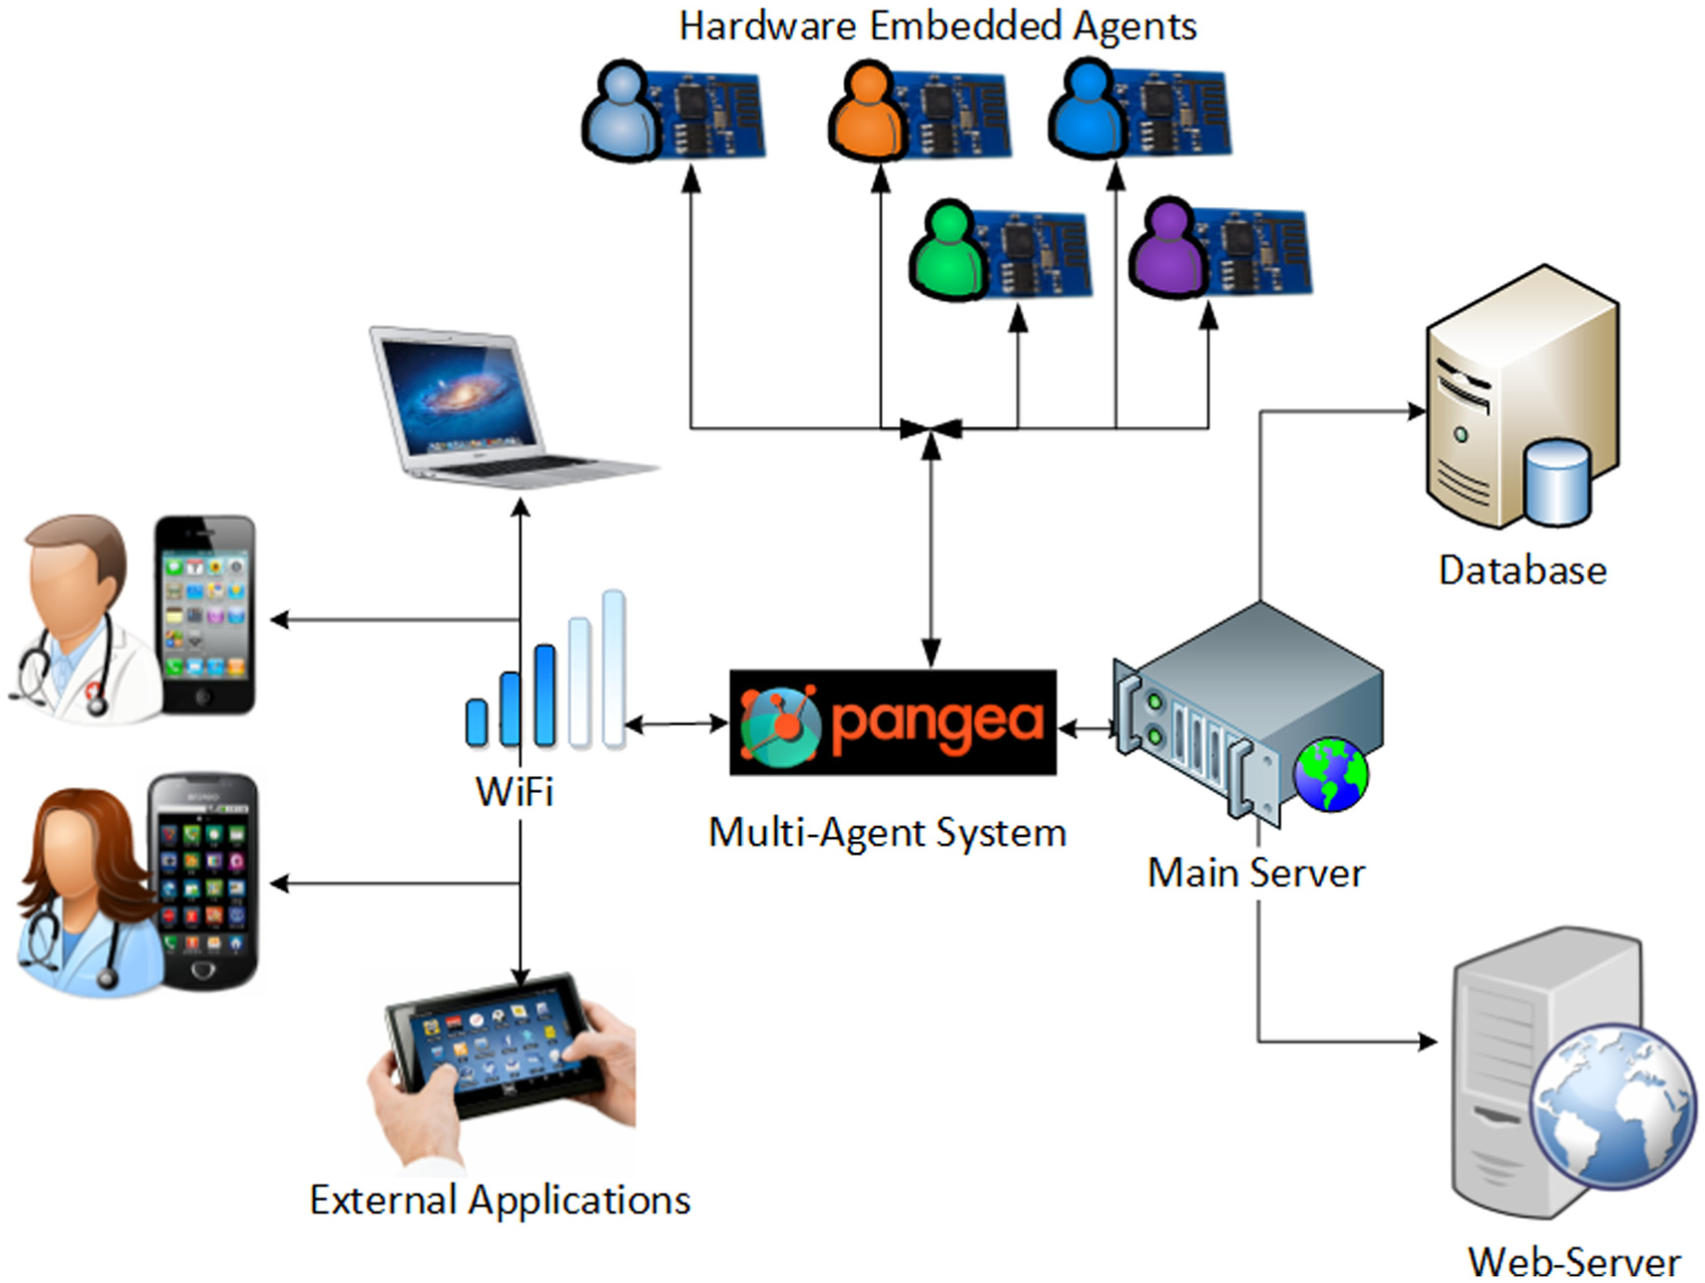
Overview of the architecture deployed.
The use of PANGEA as a central, interconnecting element of the different platform components, allows for greater efficiency in terms of communication, extending the battery life of the sensor carried by the patient, and making it possible to interconnect sensors using the MQTT protocol. PANGEA is useful for its ability to connect with devices that require a simple code development and have limited bandwidth. Table 1 indicates the battery life and the number of messages that can be sent per hour. It compares the use of a light communication protocol, such as MQTT (machine-to-machine (M2M)/Internet of Things) for embedded hardware, with that of a traditional system based on the client–server structure that uses service-oriented architecture (SOA). From the results displayed in Table 2, we can observe efficient battery consumption in relation to the number of messages per hour when the MQTT protocol is used.
Battery consumption using different communication protocols.

HTTPS: hypertext transfer protocol secure; MQTT: message queue telemetry transport.
Figure 10 shows the electronic scheme of the sensor developed in this work, whose main goal is measuring diuresis.
Microcontroller—Wi-Fi (ESP8266-E12). It is responsible for capturing the load cell data and sending it back to a central server, using the MQTT protocol. Its main technical features: it is a system on chip (SoC) with a Wi-Fi connection, and it is manufactured by Espressif Systems. It is based on a 32-bit architecture and the processor runs up to 180 MHz with a memory flash SPI Winbond W25Q40BVNIG of 512 kB. It features an operating voltage of 3.3 V and 16GPIO, i2C, universal asynchronous receiver-transmitter (UART), and analog-to-digital converter (ADC). The most attractive feature of this hardware is its low consumption, which means that it can be used in final service designs for users, where the sensors must be independent. The consumption of hardware is shown in Table 3, with a temperature of 25° and a source of power of 3.3 V.
Amplifier (HX711). its main function is to change the voltage levels (changes in electrical resistance) measured in the load cell to digital data. The communication between this amplifier and a microcontroller unit is performed using the TTL-232 communication interface. Its operational voltage is 2.6–5.5 V with less than 10 mA of operational consumption.
Load cell. strain gauge load cell, with a load range between 0 and 50 kg and with a rated output: 1.0 ± 0.15 mV/V.
Batteries management (MCP73831T). this module was used for the maintenance and charge of LiPo batteries. The nurses or other personnel responsible for the maintenance of the system can very easily recharge the batteries used for the device. This module has the auto-off feature, so when fully charged, it disconnects and turns off, indicating that the process has finished. The charging current is approximately 15–500 mA.
Voltage regulator (LDO ADP122). the device will have a 650-mAh battery and a voltage of 3.7 V. As the load cell and the microcontroller have an operating voltage of 3.3 V, it is necessary to reduce the tension.

Electronic scheme designed in this work.
Consumption of each of the components.
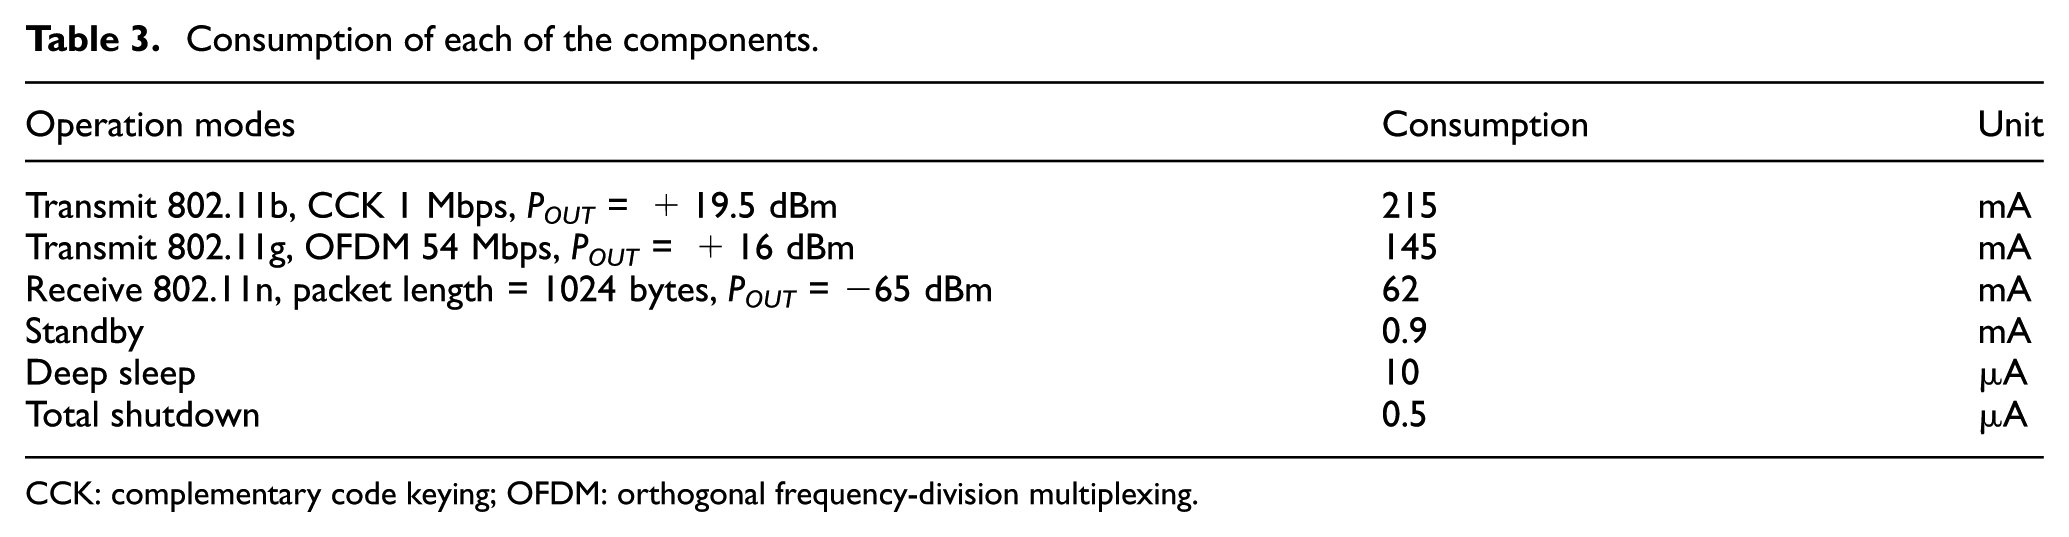
CCK: complementary code keying; OFDM: orthogonal frequency-division multiplexing.
The main components, which form the developed prototype hardware, are shown in Figure 11. The total cost of all the components for the production of the pilot device was 13€. This is a much lower cost with the other solutions available on the market today.

Hardware prototype.
Considering the characteristics and consumption of the battery, we analyzed the periods of time in which the sensor was used. Table 4 shows the device’s battery life, according to the number of seconds between two consecutive data transmissions. Calculations of the battery consumption were made when it was in both active and sleep modes. In active mode, battery consumption was 80 mA when data were being sent. While in sleep mode, it was 20 μA. The time taken to send the data in the active mode was 2 s. After studying the data, the final measurement used was 300 s (5 min), since the levels of urine do not vary significantly in shorter time intervals. Furthermore, its autonomy is of nearly 2 months, which is sufficient time to carry out the vast majority of clinical trials related to major kidney diseases. The battery is easy to replace and can be replaced at the time of a maintenance check.
Days of use of the battery according to the downtime.

The connection between the embedded applications and the designed platform is via Wi-Fi. This is because it is available in the majority of medical centers and eases the implementation of the WSN described in this work. The remote nodes are pre-configured access credentials to the wireless network of the building, sending the data by load cell every 300 s. It can be modified during this time, according to the needs of the patient.
Case study
The main objective of this section is to describe a scenario in which anomalies are detected according to the amount of fluid that passes through the patient’s urethra. Diuresis is defined as the amount of urine produced at a given time. This is an important data in the medical environment when a precise diagnosis of the patient is required. The average volume of urine in a healthy individual is shown below in Table 5. This information has been provided by health professionals and it can also be found in medical research, such as the work of Thayer and Morris. 27
Urine output at different ages.
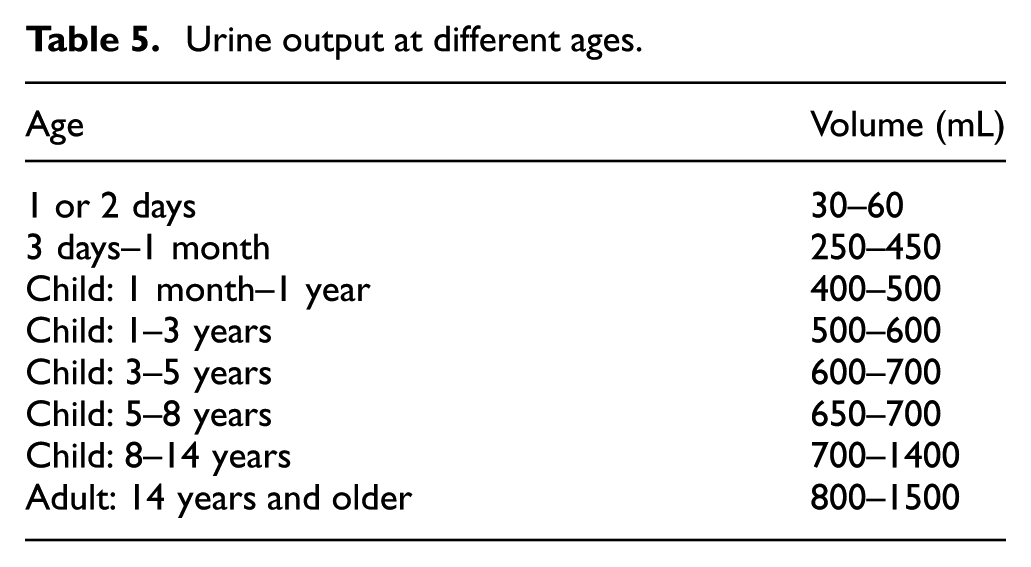
Empirically, we verify that the volume of urine produced by a healthy child or adult during the night period should be half of that formed during the day.
In the field of medicine, it is very important to detect anomalies or alterations produced in diuresis in order to detect possible kidney diseases. Therefore, it is important to investigate technological solutions that will make it possible to monitor the amount of fluid expelled by a patient in a certain time. The most important alterations in the production of urine, according to the amount of urine excreted in a particular period (Table 6),28–30 are as follows:
Polyuria. An increase in the output of urine of 2500 mL or more of urine in 24 h. It can be due to polydipsia or renal diseases, which must be verified with more specific tests.
Anuria. Urine output less than 100 cc a day, or the absence of urine.
Oliguria. Urine output of less than 500 mL and more than 100 mL of urine in 24 h.
Frequent urination. Frequent urination with small urinary volumes.
Nocturia. More abundant urine at night than during the day.
Urine output and diseases.

The sensor returns the percentage according to the volume measured. These values make it possible to calculate the percentage of content in the urine bag, enabling us to make any necessary adjustments after a period of time. To obtain the volume in the urine bag, we perform a simple extrapolation of the data. In our case study, we use a bag with a capacity of 2000 mL, considering that the relationship between volume of urine and weight is given by a factor of [1.015, 1020]. Based on this relationship, we extrapolate the volume of urine. In Figure 12, we see that one of the final prototypes that was implemented as a pilot in the rooms of the patients who participated voluntarily in the test. The casing of the designed device was made by a three-dimensional (3D) printer in order to install it on the existing medical equipment.
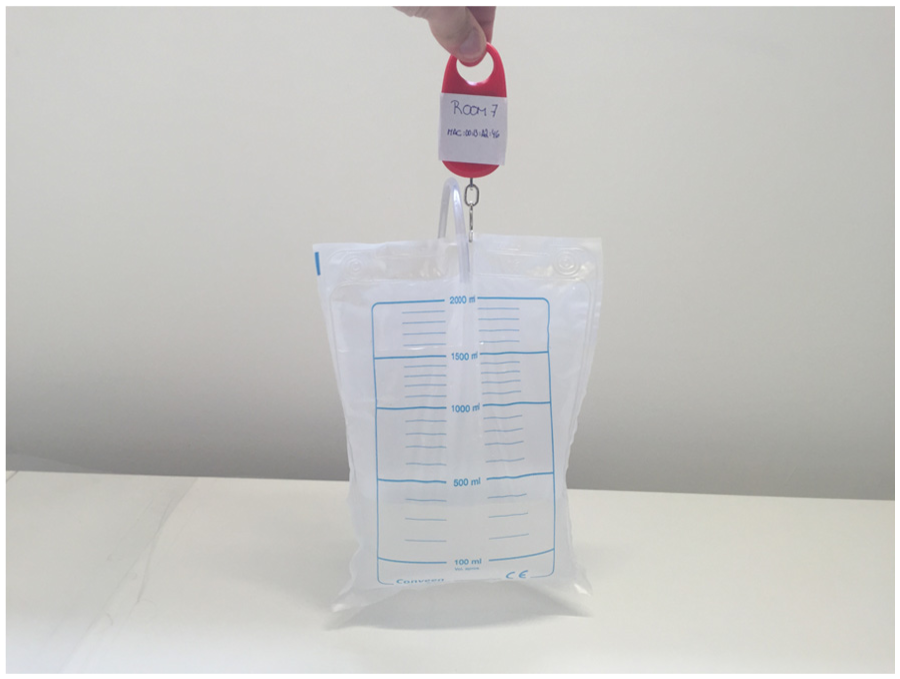
Final prototype.
Visualization central platform
In order to evaluate the proposed system, we have developed a software system which is responsible for monitoring and displaying the data collected by the sensors used by each of the patients. In addition, we designed an alarm system to notify all the agents involved (doctors, nurses, patients, etc.) of any incidents that occur in the system. All these elements have been tested in a real environment with real patients, who have voluntarily made use of the measuring system during the validation phase. To preserve and ensure the protection of the patients’ personal data, their real names have been changed.
The visualization platform, shown in Figure 13, was used by the health professionals in the center; both nurses and doctors used this tool. With the authentication system, staff members could access their own dashboard which contained all the patients under their care. With this tool, doctors see relevant data for each patient, their clinical histories, or the results of medical tests. However, the main objective of this platform is the monitoring of all the sensors that measure the excreted urine. In Figure 13, we can see how the main screen is structured. The central zone contains a map with the distribution of the rooms on the hospital floor. For this case study, we used a total of five sensors per patient. Each one was placed in a different room on the same floor of the building. In each of these rooms, there were two level indicators. The green indicator showed the percentage of battery level and the orange indicator showed the percentage level of urine in the bag. In cases where an abnormal value is detected, the application will display an icon that reflects this situation, in addition to the corresponding indicator. Two cases have alerts: room 7, where the level in the urine bag has exceeded the established threshold, and room 4, where the device battery level is under 20%.

Web visualization platform.
The right side of the screen displays a list of events that have occurred in the last few hours. One of the features of the platform is to show the data history recorded by each sensor, enabling the doctor to perform a clinical study on the basis of urine excretion levels during a given period of time. An additional element is an application for smart mobile devices that will be connected permanently to the system, allowing doctors to access their patients’ data, regardless of their physical location.
As shown in Figure 14(a), the application displays the historical data of all events that have occurred in the system in the last minutes, as with the web visualization platform. If the doctor wants to display the data from different sensors, they can sort it according to the rooms in which the sensors are installed, as shown in Figure 14(b). In Figure 14(c), we can see how the mobile alerts are displayed: the central server sends them instantly to the user to inform them on different occurrences.

Mobile application: (a) list of historical data, (b) sensor data, and (c) alert notification message.
From the mobile application and the visualization platform, the health professionals can create all the alerts that may be necessary. Using a simple formula, it is possible to display the threshold values which, if exceeded, will trigger an alarm in the system. As we can see in Figure 14(c), the doctor in charge of the patient in room 7 has configured the system to send alerts when the level of urine excreted is more than 86%. An alert status will be sent to the mobile application. At the same time, the on-duty nurses, assigned to the patient in question, are informed of this alert through their internal emergency warning devices.
Results
Doctors from the Faculty of Medicine of the University of Salamanca, as well as two nurses from the unit’s renal pathophysiology fully participated during the development of the platform and in particular during the validation tests. The testing scenario took place in a hospital in the city of Salamanca, with the voluntary participation of four patients. The information about the patients is summarized in Table 7.
Description of the patients involved in the study.

The patients’ rooms were located on the same floor of the same building. The building has a Wi-Fi connection and did not require the installation of any additional hardware for secure remote connectivity. The system is able to monitor patients on different floors, and even in different buildings.
In the tests carried out as part of this case study, we compared the historical values of urine excreted over 24 h by a healthy patient to those of the patients testing the pilot system. In the first case, the patient in room 12 is studied. As shown in Figure 15, the values of urine excreted from the healthy person (in red) over a 24-h period do not at any point exceed 1500 mL. This value, as discussed in preceding paragraphs, would be the limit of urine that a healthy person excretes during one day. However, the levels of the patient in room 12 (in green) are far greater than those of the first user, measurements indicate that 1500 mL of urine has been excreted before 16:00. The measuring device recorded that the excreted level of urine exceeded 3500. In this case, the system determined that the patient suffers from polyuria, since the limit of 2500 mL/24 h was exceeded, which is considered the minimum level required to diagnose this disease. As a result of the data obtained by the system, the medical team conducted more exhaustive tests and they were able to confirm the ailment.

Room 12 patient data.
Additionally, we compared the data from the same healthy user with the data of the patient in room 4. In Figure 16, we can see how the patient-registered values (green color) very similar to those registered by the healthy user (red color). In this case, this test alone was insufficient to determine whether the patient is suffering some kind of kidney disease.

Room 4 patient data.
Figure 17 shows the result of a data analysis obtained over 24 h for the patient in room 2 (green). These data were compared with data from the healthy patient (red color). In this case, the study determined that the diuresis for a day was 370 mL in total. The level of urine excreted, falls within the range of values (100–500 mL) corresponding to the renal pathology oliguria. The medical professionals were therefore able to determine that the patient suffered from this ailment and proceeded to perform additional medical tests, which confirmed the initial diagnosis given by the system.

Room 2 patient data.
Another study, also conducted as part of this case study, determined that the patient in room 7 suffered from nocturia. As mentioned in section “Case study,” this medical condition is characterized by high levels of urine excreted by the patient during normal sleeping hours. As it is shown in Figure 18, the patient had passed more than 73% of total urine during the night. This information was very essential to the health professionals who were in charge of the patient. During the next few days, the levels of urine passed by the patient at night time were very similar to those shown in Figure 18, indicating that the patient suffers from this condition.

Room 7 patient data.
Conclusion
This article proposes the use of an MAS combined with a WSN for the remote measurement of urine excretion in patients. The different hardware components that have been employed in this work are of low cost, what makes this proposal stand out from the others, making it an accessible and affordable system to all users and medical centers. The use of the PANGEA multi-agent architecture reduced the time spent on developing the case study, since it allowed for the quick and easy deployment of light agents in computationally limited devices.
The designed wireless devices follow a self-diagnosis protocol for fault tolerance. When wireless data transmission is not possible, the measured values are stored in the microcontroller’s internal memory. Once the connection is restored, all the data that had been stored are sent. In this way, the loss of data due to connection problems is avoided. Likewise, the system continually examines the correct functioning of all the nodes in a centralized way. If one of the nodes does not send the data to the predefined place, the system emits an alert, warning the medical staff of the incident.
In the conducted case study, the participating nurses underscored the major improvement implied by this system in comparison to the traditional system of measurement. They highlighted its ease of use and high precision since taking measurements using the traditional method always incurs errors and requires patients to travel to the hospital. The patients that kindly agreed to take part in the case study pointed to the non-invasive feature of the system, as well as its ease of use and reduced size. In the case of dependent patients, their family members found the system quite attractive. This is because an automatic alarm is emitted when the levels of urine in the bag are excessive. This provides great comfort to the carers who no longer need to watch the levels in the urine bag.
The proposed system has a clear sales potential due to the low cost of its electrical components. This reduced cost joint with its great practicality makes it possible to market it in a short period of time. During the testing phase, it was confirmed that a number of healthcare organizations had expressed their interest in the designed device. Additionally, it could be used for other medical purposes, such as blood transfusions or in the monitoring of intravenous fluid bags. The selling technique could be based on hiring the device or its mass production, which would make it even cheaper. During the prototyping phase, companies in the health field have begun conversations with the authors of this work. They showed interest in starting business relations and launching the device on the health market.
For future lines of research, we should mention the great possibility of the proposed system to adapt to other case studies, such as dropper systems, which supply serum and medicine to patients. These liquids are also contained in bags, similar to those used to collect urine. In this case, the designed device would measure the level of other liquids. The ability to measure the amount of liquid contained in a dropper can also greatly ease the work of medical staff, since they will be informed on time of the need to replace a bag.
Footnotes
Academic Editor: Jose Molina
Declaration of conflicting interests
The author(s) declared no potential conflicts of interest with respect to the research, authorship, and/or publication of this article.
Funding
The author(s) disclosed receipt of the following financial support for the research, authorship, and/or publication of this article: This work was supported by the Spanish Ministry, Ministerio de Economía y Competitividad and FEDER funds. Project SURF: Intelligent System for integrated and sustainable management of urban fleets TIN2015-65515-C4-3-R.