
Abstract
This article presents a new signal processing method of estimation of direction of arrival using the phase difference between sensors. The new method is essentially a narrow-band technique for automotive radar. A delay of the reception time is caused by the physical gap between sensors in the incident signals to the sensor arrays, and it results in a phase difference between input signals. The new method predicts the ideal phase value and the phase value of the input signal. The point that minimizes the phase error for every sensor is estimated as direction of arrival. The simulation result shows that the new method offers significantly improved estimation resolution and direction-of-arrival estimation compared to conventional methods.
Keywords
Introduction
Recently, the number of vehicles equipped with an automotive radar is increasing steadily. The automotive radar is typically used for advanced driver-assistance systems (ADASs),1–3 which include advanced smart cruise control (ASCC) for automatic adjustment of distance between vehicles and blind spot detection (BSD). The most important factor for using these systems is the location of objects because the locations of objects must be accurately identified for the stable use of the systems.
The conventional radar sensors were used to get information about the distance and speed of objects, but various systems have been introduced with the development of radar technology. For example, the importance of the direction-of-arrival (DOA) estimation algorithm, which has combined the high-resolution digital beamforming method with sensor array, has increased. The DOA is estimated as the direction of reflection of the incident signals. The digital beamforming method uses a sensor array 4 and is divided into parametric and spectral methods depending on the signal processing method. 5 In this study, the spectral method based on spatial spectrum was used. The spectrum-based beamforming method finds the point that has the maximum value in the results of spatial spectrum that have the incident direction as a variable and is classified into beamforming techniques and subspace-based methods. The beamforming techniques include Bartlett and Capon algorithms,6,7 and the subspace-based methods include multiple signal classification (MUSIC) algorithm.8,9
In this article, a new algorithm to improve the DOA estimation is proposed. The new method is essentially a narrow-band technique for automotive radar. In the new method, DOA is estimated by investigating the phase difference by a time delay. The steering vector is built by calculating a phase difference by the physical gap between sensors. The phase of the steering vector can be determined by the arrival angle to sensor arrays, but the actual angle information for the phase of the input signal is hard to extract because the steering vector is combined with the complex envelope. To obtain the angle information of objects in the phase of input signal, the actual phase difference was estimated. The new method estimates the DOA as the point where the difference between the estimated ideal phase difference in the sensor array and the phase difference from the actual input signal is minimized. The new method was experimentally verified to estimate the DOA more accurately than the conventional algorithms, and the spectrum results confirmed a higher resolution of the new method. The spectral resolution was quantified using kurtosis, 10 which is used as a measure of the sharpness of spectral beamforming, and it was found that the new method has a higher resolution compared to the conventional algorithms.
Radar system
Figure 1 shows the structure of the frequency-modulated continuous-wave (FMCW) radar. 11 It consists of the antenna unit where an electrical radio frequency (RF) signal is converted to an electromagnetic wave, the transceiver unit that generated the RF signal and processes the received RF signal, and the signal control and processing unit that controls the RF signal and processes the received signal. The antenna unit contains the linear patch array antenna, and the signal control and processing unit handles the schedule of FMCW modulation and radar scanning. The transmission channel is a single channel, and the receiving channel consists of M uniform linear arrays.
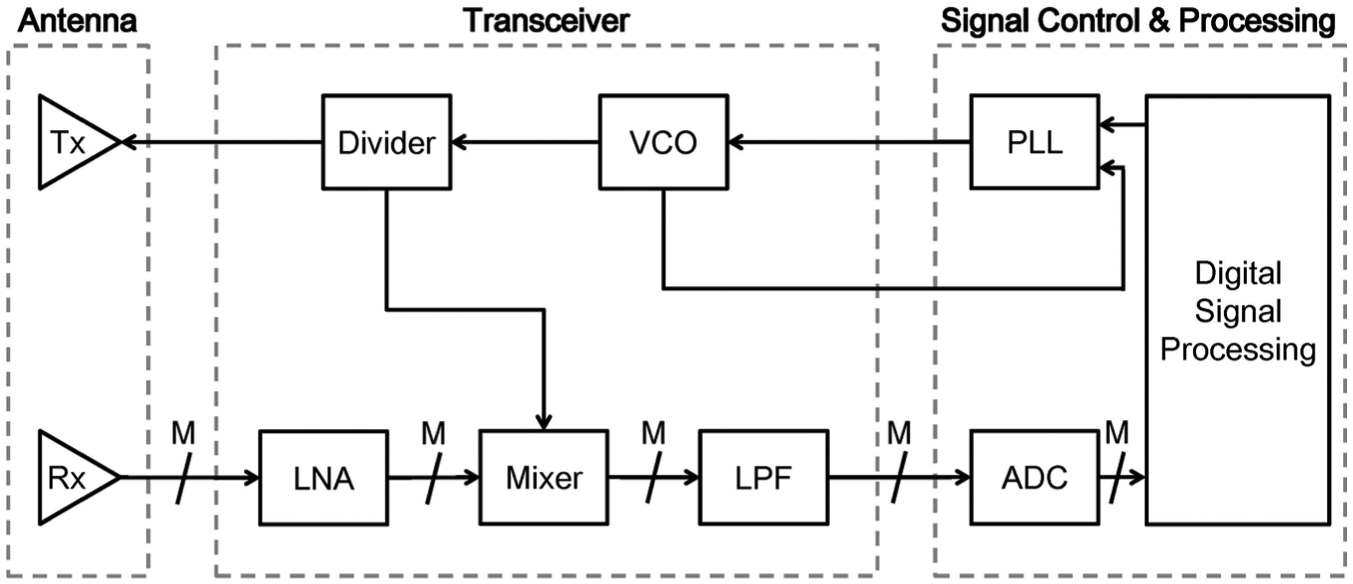
Radar system structure.
DOA estimation algorithms
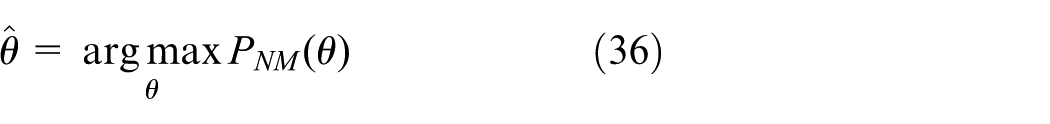
In the DOA estimation algorithm, the spectral technique is a method of estimating the DOA as
Beamforming techniques
The beamforming technique is one of the basic DOA estimation methods using a sensor array. The spatial spectrum is formed using the output values obtained by orienting the sensor array to all directions. The direction representing the maximum value is estimated as the final DOA


In equation (1),
The input signal

where

The output y of the sensor array consisting of M sensors is a linear combination of sensor outputs with the weight of each sensor as a coefficient and is expressed as follows

where

where R denotes the covariance matrix of the input signal. The weighting vector
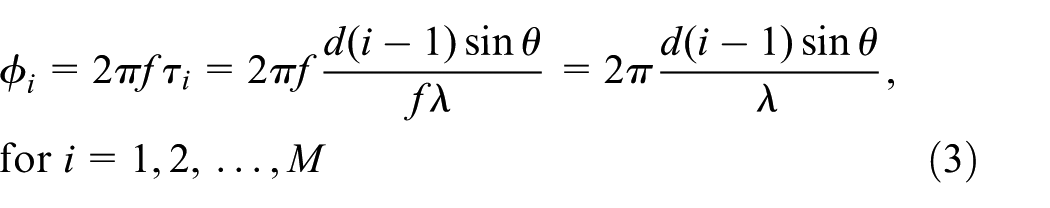
Figure 2 shows that a time delay is generated according to the sensor by the gap of the sensor array, which causes a phase difference.

Time delay and phase difference.
Bartlett beamformer
The Bartlett beamforming algorithm maximizes the signal output by giving a large weight to the input signal from a specific direction.
The weighting vector

By substituting equation (8) in equation (7), the spatial spectrum of Bartlett beamforming can be expressed as follows

Capon beamformer
The Capon beamforming algorithm maintains a constant gain for the input signals from a specific direction and gives a smaller weight to the noise. The optimization problem to satisfy these conditions is as follows
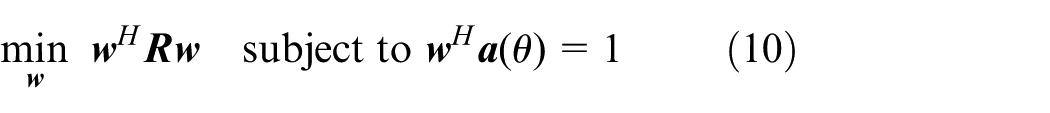
The above optimization problem maintains the gain of a specific direction at 1 and minimizes the noise to increase the signal-to-noise ratio (SNR). To find the solution of equation (10) using this, the weight vector

By substituting equation (11) in equation (7), the spatial spectrum of Capon beamforming can be expressed as follows

The MUSIC algorithm
The MUSIC algorithm is a subspace-based algorithm which uses the characteristic that every steering vector corresponding to the incident signal is at right angle to the noise space. The covariance matrix


where


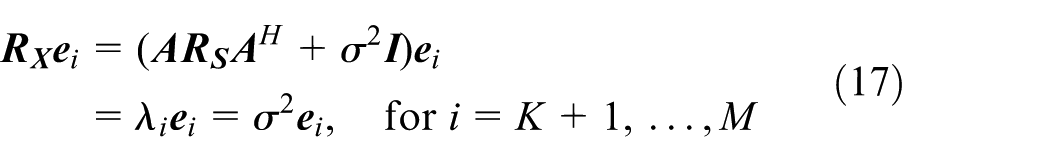
From the above equations, the following results are obtained


When the power of noise is equal to the eigenvalue, the eigenvector is at right angle to the steering vector. This eigenvector is called noise eigenvector and the noise subspace

Using a random steering vector

A new DOA estimation method
A delay of the reception time is caused by the gap between sensors in the incident signals to the sensor arrays, and it results in a phase difference between input signals. The new method uses the ideal phase value for M sensors in the specific direction
The equation for finding the difference between the ideal phase angle and the actual phase angle of the input signal is expressed as follows

where

The point that minimizes the difference for every sensor in equation (24) is estimated as the DOA. The optimization problem to satisfy this condition is as follows
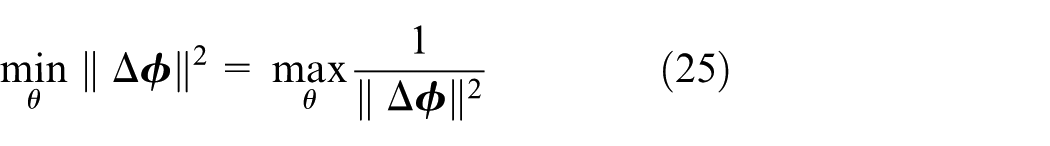
The optimization problem in equation (25) is to estimate the DOA as the


The above equations can be used to determine
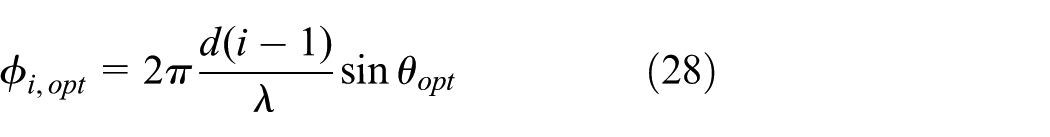
Equation (28) expresses the phase angle


where

Equation (31) can be used to determine the phase angle
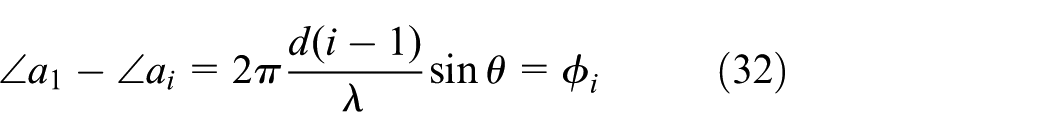
Using equations (31) and (32),

From the above equation, it can be seen that the difference in the phase difference of input signals between the two sensors is the same as the phase difference of the steering vector in the sensors 1 and i.
Figure 3 illustrates the new method for the direction

Input signal phase difference
Equation (33) can be rewritten as

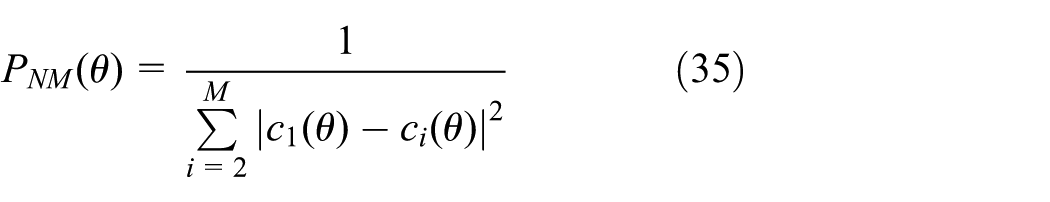
The above equations can be used to form the spatial spectrum and applied to equation (25) to obtain the following equation to estimate the final DOA
Experiment results
The data obtained using the 77-GHz FMCW short-range radar (SRR) in a chamber environment was used as input signal. Figure 4 shows the chamber photograph. In this chamber, radar signal was generated by single and dual target simulator.

Radar chamber.
The input signal ranged between
Figure 5 shows the spatial spectrum calculated with each method when the actual angles of objects are

Log-scaled spectrum
Figure 6 shows the averages and standard deviations of errors resulting from the difference between the actual angle and the estimated angle for a total of 1952 data with 8–12 data for each angle. Bartlett and MUSIC have the same values for all data. The standard deviation of Capon is relatively large. This result confirms that the new method has a smaller error of DOA estimation than the Capon algorithm.

Average and standard deviation of DOA estimation error
Table 1 shows the average errors of the actual and estimated angles and the average standard deviation at each angle for all data. The new method has the smallest average error, which is smaller than 1°. Furthermore, the new method has the smallest standard deviation compared to the conventional Bartlett and Capon algorithms.
Average error and average standard deviation in 1952 scan data

MUSIC: multiple signal classification.
Compared to the conventional algorithms, the new method forms a sharper main lobe for the estimated angle and has almost no side lobe, as shown in Figure 5. To quantify this sharpness, kurtosis was used. Kurtosis is a measure of deviation of the probability distribution and is used to measure how much the observation values are crowded at the center.
The equation for kurtosis is expressed as follows

where
The kurtosis of normal distribution is three, and it approaches zero as the distribution becomes more even. When the distribution becomes biased, the kurtosis becomes larger than three. Thus, the kurtosis value can be used to determine whether the distribution is even or biased. The greater the kurtosis value is, the higher the resolution becomes.
Figure 7 shows the kurtosis values for the DOA estimation results of each algorithm. To apply these kurtosis values, only the values within

Average kurtosis in each angle.
Figure 8 shows the average kurtosis value for each error when there is an error between the estimated angle and actual angle of the DOA for each algorithm. This result confirms that the DOA estimation error of the new method is smaller than those of the conventional algorithms and the average of kurtosis values is very large when the DOA estimation has an error.

Average kurtosis in each DOA estimation error.
Table 2 shows the average of kurtosis values for each algorithm for all data. The average kurtosis values of the conventional algorithms are smaller than three, indicating that they are more even than the normal distribution. The average kurtosis of the proposed value is very large at 31.9140. This suggests that only the main lobes with a peak value have large values and side lobes have small values, resulting in a biased distribution of the spectrum. This result confirms that the new method of DOA estimation has the best performance with the highest resolution.
Average kurtosis in 1952 scan data

MUSIC: multiple signal classification.
The above results verified that the new method shows better performance in the accuracy of DOA estimation compared to the conventional algorithms.
Figure 9 shows the normalized spectrum of the new method, Bartlett, Capon, and MUSIC algorithms with respect to actual DOA of
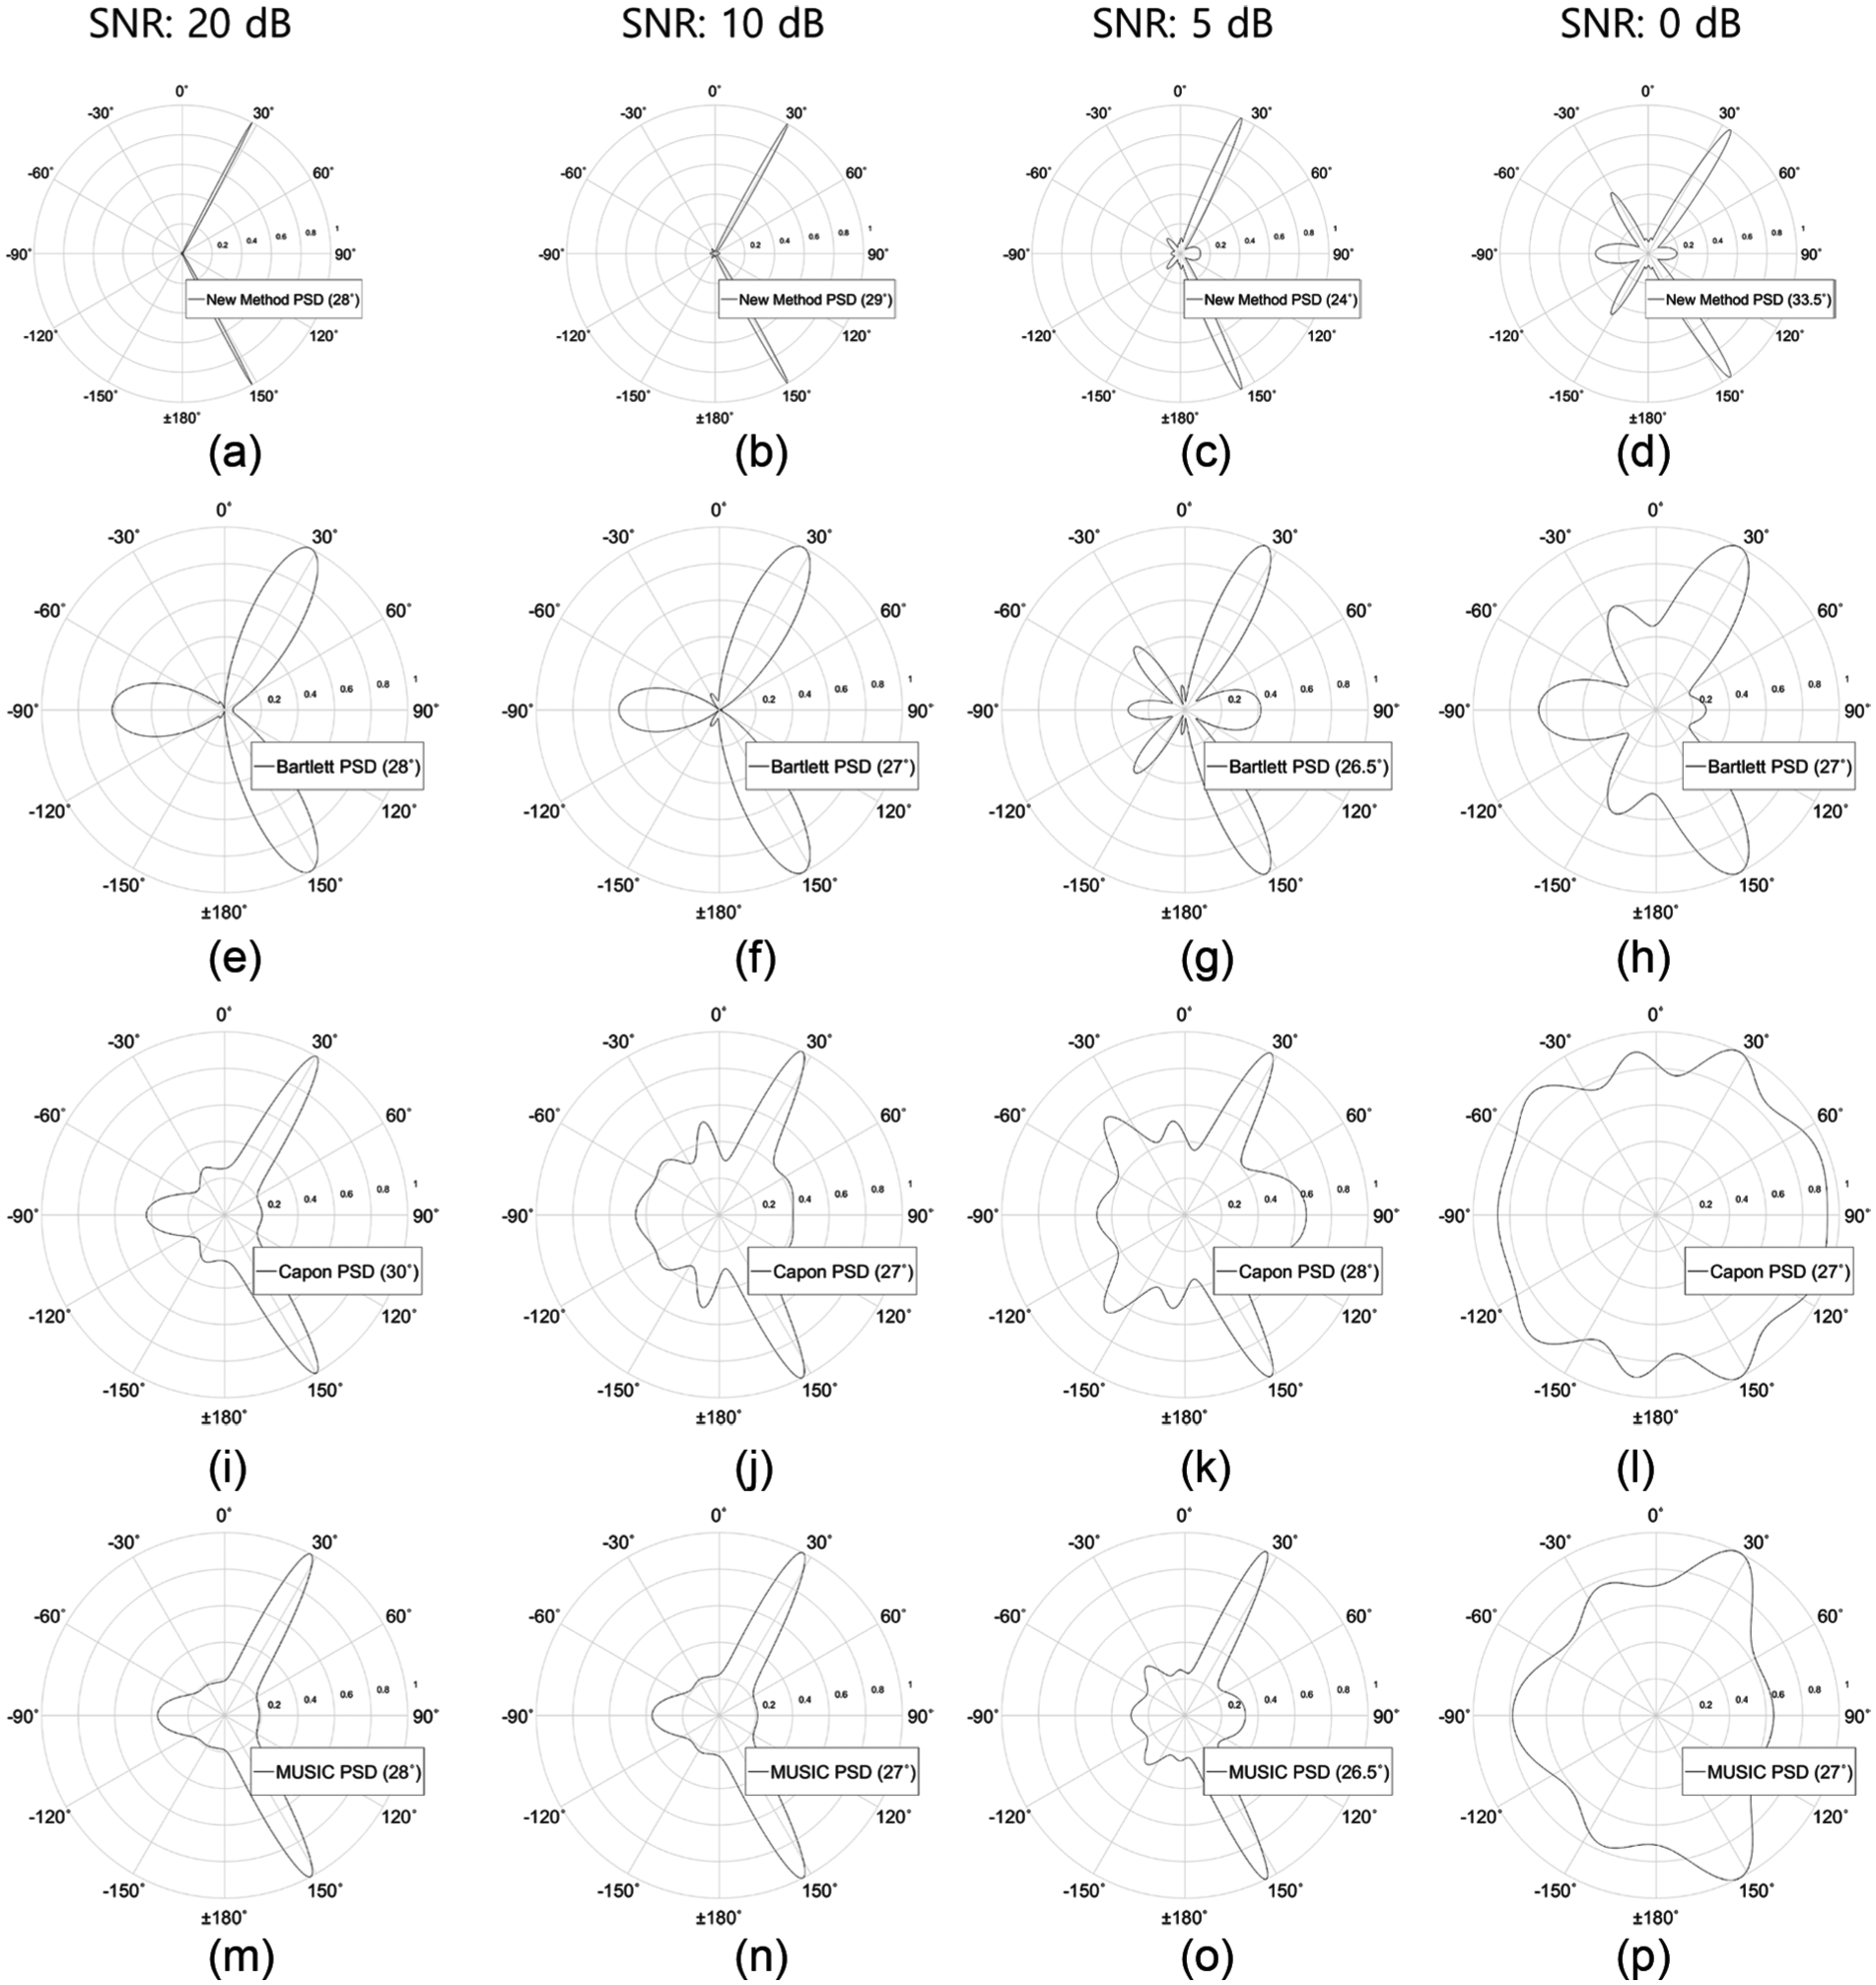
Normalized spectrum when SNR is set to 20, 10, 5, and 0 dB (actual DOA: 28°): (a)–(d) New method results, (e)–(h) Bartlett results, (i)–(l) Capon results, and (m)–(p) MUSIC results.
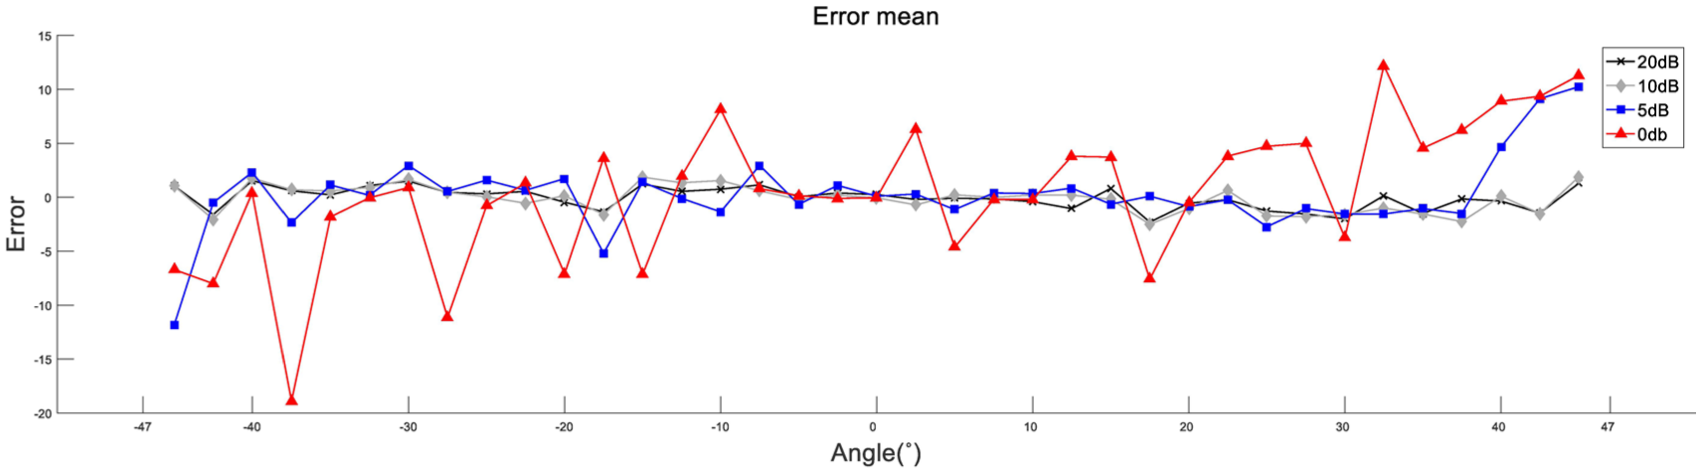
Average DOA estimation error of the new method when SNR is set to 20, 10, 5, and 0 dB
Average DOA estimation error and standard deviation for various SNRs (mean ± SD).

SNR: signal-to-noise ratio; SD: standard deviation; MUSIC: multiple signal classification.
To verify the performance of the DOA estimation under multiple target conditions, we conducted the DOA estimation using the long-range radar (LRR) signal acquired from the chamber, normal road, and the parking lot. The number of sensors in an LRR sensor array was 8 and the sensor gap was 1.8λ. In the case of the chamber data, the number of targets was set to two, and Figure 11(a) shows the DOA estimation results. Figure 11(b)–(e) shows the results for the real data under multiple target conditions. The DOA estimation results of conventional algorithms show that spectrums of specific object are too small to be estimated, and the two close objects are not classified due to low resolution. However, the new method estimates the three targets at least or more and has better resolution that the conventional algorithms.
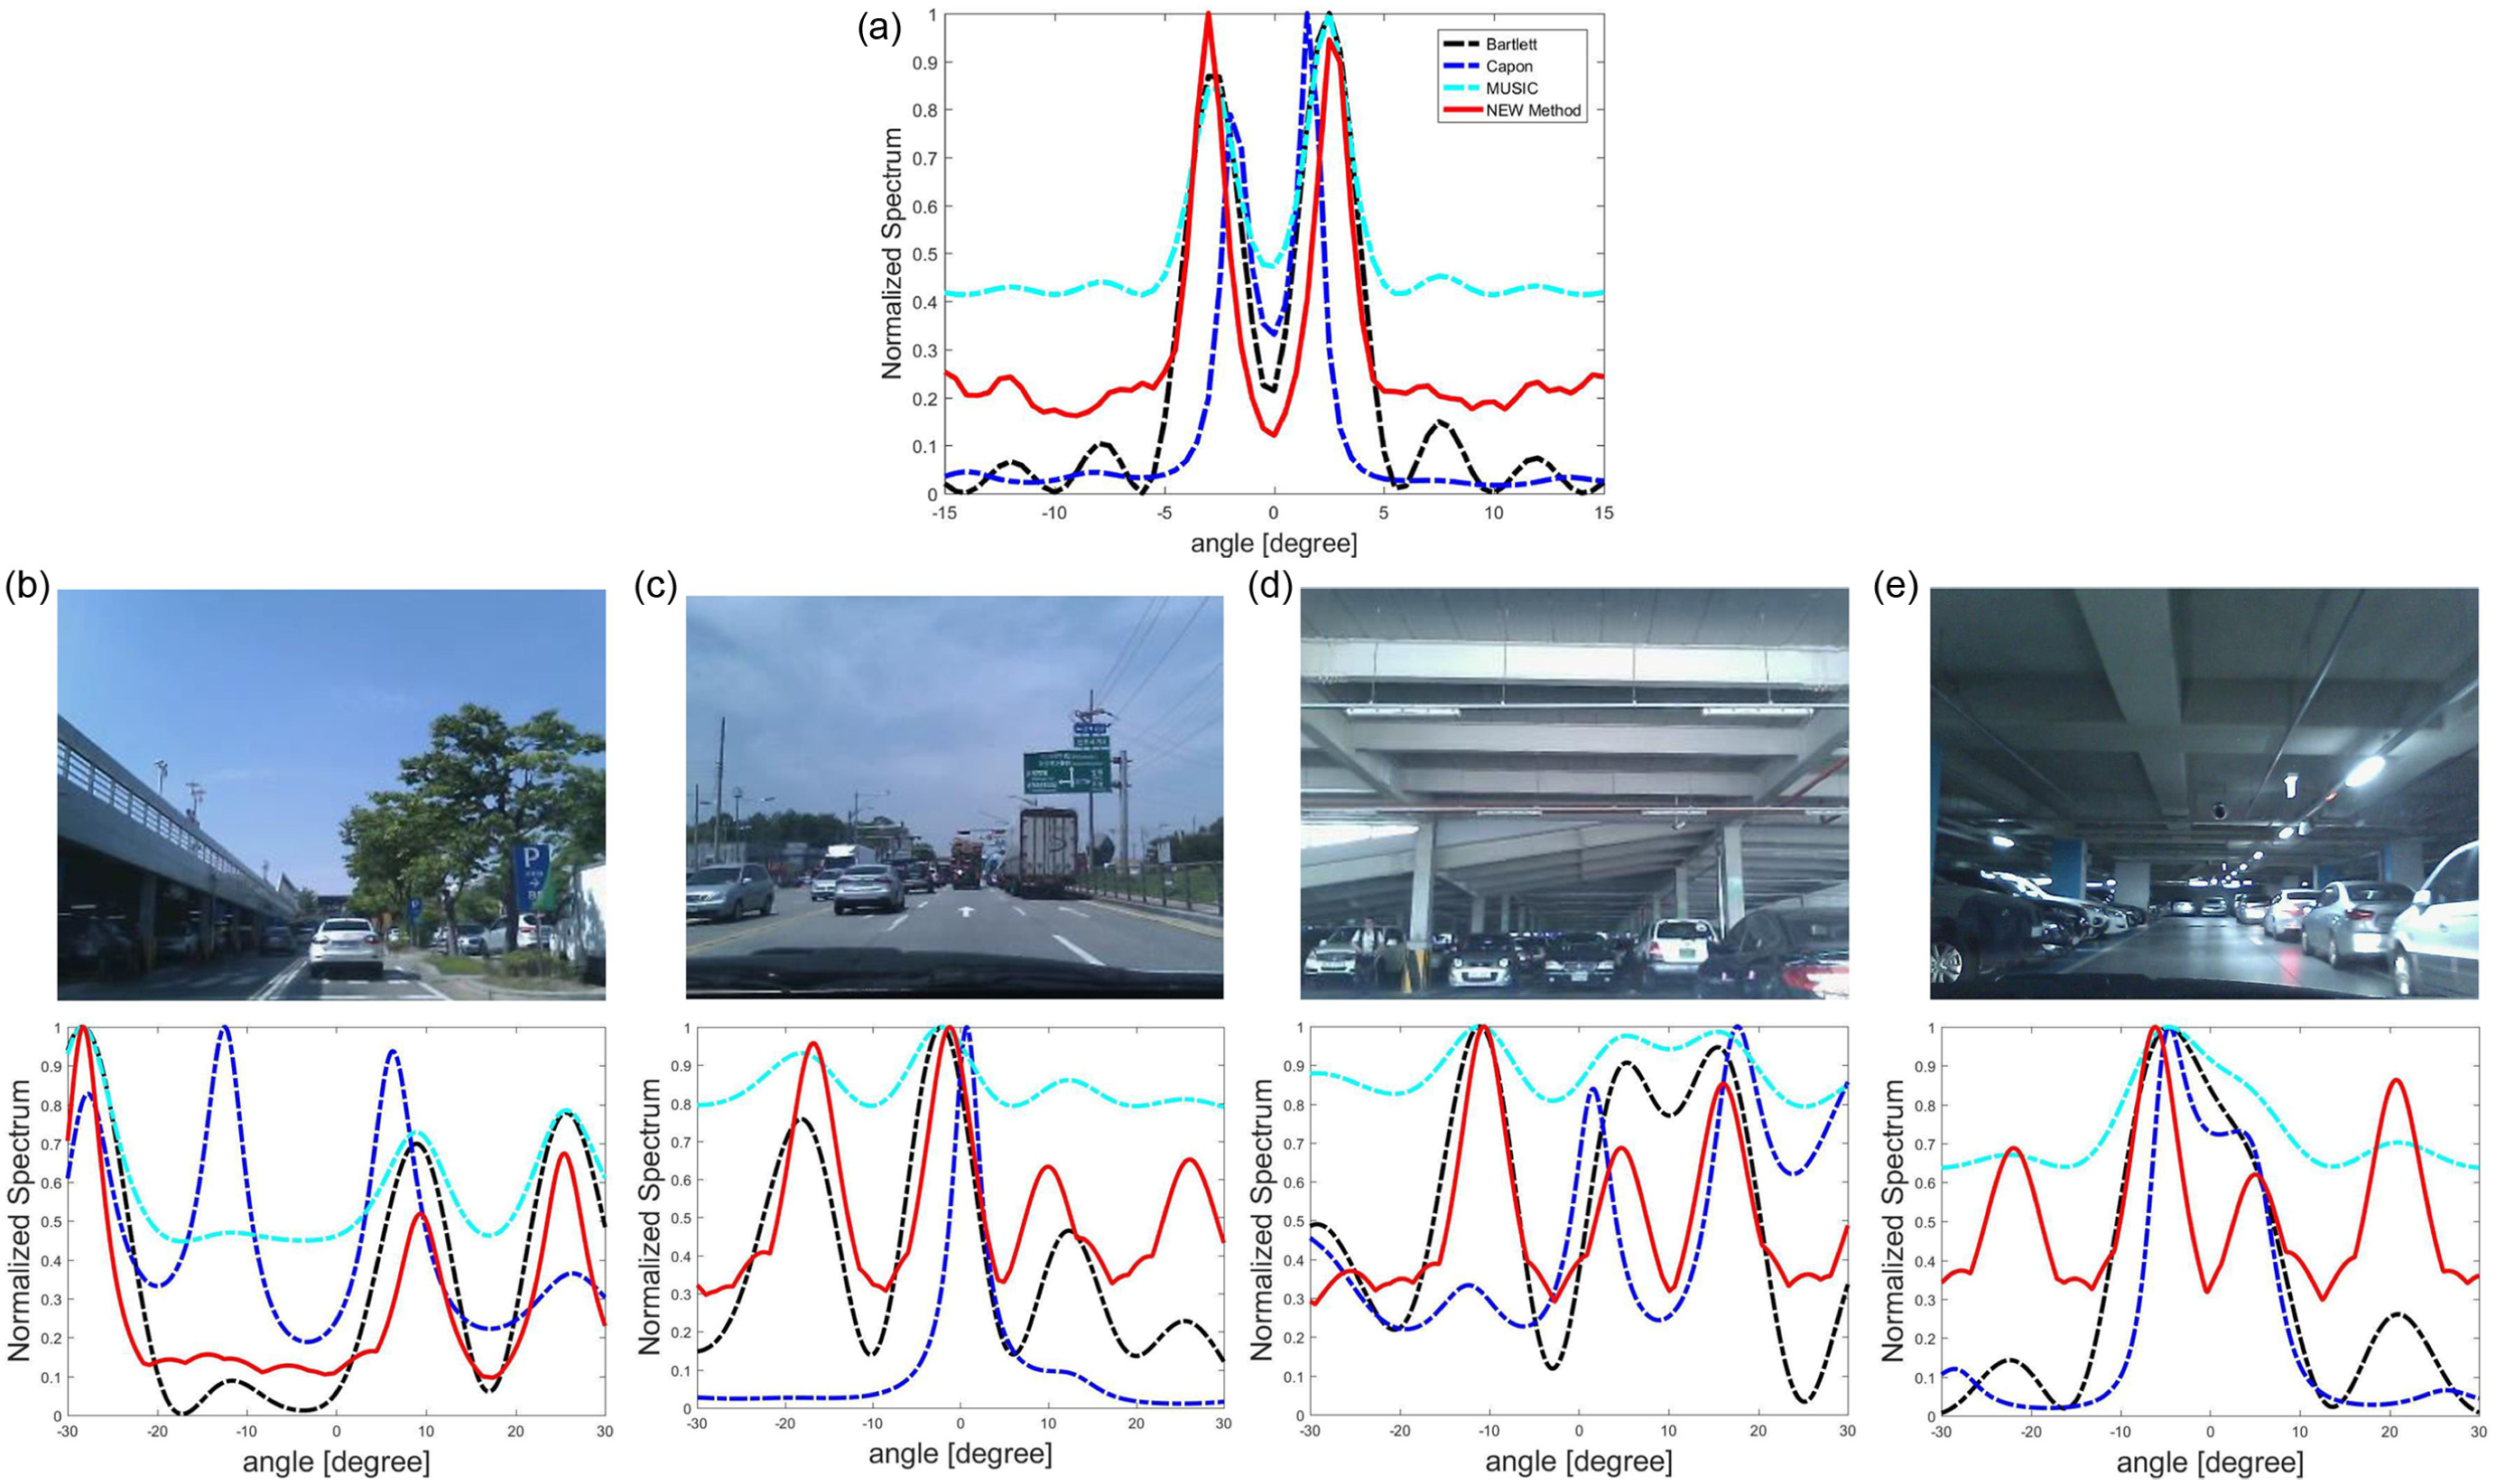
Normalized spectrum of multiple targets in chamber and actual road conditions: (a) result in chamber, and (b)–(e) results in actual conditions.
Conclusion
This article proposed a new DOA estimation method for more accurate estimation compared to the conventional DOA estimation algorithms. To compare the estimation error, the difference between the angle of actual objects and the angle of DOA estimation was verified. For comparison, Bartlett, Capon, and MUSIC algorithms, which are the conventional DOA estimation algorithms, were used. The data obtained from the 77-GHz FMCW SRR and LRR in a chamber environment and actual road conditions were used as the input signals.
The new method was found to have the smallest error of DOA estimation compared to the conventional algorithms as shown in Table 1. Furthermore, the new method formed very sharp main lobes and almost no side lobes as shown in Figure 5. Kurtosis was used to quantify the sharpness, and the new method showed the best performance with the highest resolution as shown in Table 2. Moreover, the performance of the DOA estimation under various SNRs and multiple target conditions was verified in the Figures 9–11. This result confirms that the new method has a similar error of DOA estimation compared to Bartlett and MUSIC as SNR changes. Also the results in Figure 11 showed better DOA estimation results under multiple target conditions.
The results of this study experimentally verified that the new method has better performance than conventional algorithms in terms of DOA estimation and resolution.
Footnotes
Academic Editor: Kye-Shin Lee
Declaration of conflicting interests
The author(s) declared no potential conflicts of interest with respect to the research, authorship, and/or publication of this article.
Funding
The author(s) disclosed receipt of the following financial support for the research, authorship, and/or publication of this article: This work was supported by the Technology Innovation Program (10051134, Middle Range Radar (150 m) Development for Euro NCAP AEB) funded by the Ministry of Trade, Industry and Energy (MI, Korea).