
Abstract
In the context of Internet of Things, virtualization of wireless sensor networks is a crucial technology for sharing sensors as infrastructure. In our previous work, we proposed a brain-inspired method for constructing a robust and adaptive virtual wireless sensor network topology and showed that the method of constructing links between modules has crucial effect on robustness and adaptivity of the constructed virtual wireless sensor network topology. However, the best way of constructing a robust and adaptive virtual wireless sensor network topology is still unclear. Therefore, in this article, we use an analytical approach and propose a method for clarifying robustness of a topology according to the method of constructing links between modules. We add a new tool to a binary-dynamics model which is an analytical method for investigating percolation dynamics on a modular network. Evaluation by simulation showed that graphs in which the number of nodes selected as endpoint nodes of inter-module links and the degrees of the endpoint nodes before the link addition are large have robust connectivity in terms of the point of fragmentation of the network into modules when we fix the degree of the endpoint nodes after the link addition. After the point, the internal structure of modules may matter more. We additionally investigate an applicable range of our proposed method.
Introduction
In the context of Internet of Things, various devices, such as sensor nodes or actuator nodes, are deployed all over the world and each subset of them compose a local network. When we consider user’s various service demands, these networks are required to cooperate with each other. Therefore, mechanisms for sharing networks as infrastructure are quite important. As a crucial technique for sharing substrates of networks, virtualization of wireless sensor networks (WSNs) has been attracting a great deal of attention. 1 One way of virtualization of WSN is to construct a logically connected overlay network for each application. In a virtualization scenario, multiple sensors in multiple WSNs can be used as shared infrastructure, with some sensors integrated for running each application. The virtualization of WSNs improves manageability and flexibility.
When we integrate local networks, modular structure emerges. A module consists of a group of nodes connected densely by a large number of intra-module links and modules are connected sparsely by a few number of inter-module links. Such modular structure can be seen in many real networks such as Internet, social networks, or biological networks. An artificial network integrated by interdependent systems is highly vulnerable to targeted attacks or cascading failures and results in fragmentation. 2 In sensor networks, the robustness of the connectivity is a crucial issue because the robust structure of the networks leads to low overhead of maintaining stable services running over them. The study of the way of connecting sensor networks to earn the robustness thus leads to improve the cooperation of deployed sensor devices. Therefore, it is important to investigate effect of modular connection pattern on efficiency of a network, especially robust connectivity.
In our previous work, we proposed a brain-inspired method for constructing a robust and adaptive virtual wireless sensor network (VWSN) topology. 3 We showed that the method of constructing links between modules has crucial effect on robustness and adaptivity of the resulting VWSN topology. 3 However, the best way of constructing a robust and adaptive VWSN topology, and particularly of constructing links between modules, is still unclear. Toward clarifying this, we use an analytical method to study robustness of a topology according to the method of constructing links between modules. Note that we regard a network topology as an undirected graph in analytical theory.
In this article, we use an analytical approach and show the way of connecting modules so that a constructed network has the most robust connectivity. We propose a method to investigate percolation dynamics on a modular network, especially graph ensembles after addition of inter-module links. In consideration of addition of inter-module links, we add a new tool to a binary-dynamics model 4 which is an analytical method for estimating robustness of modular networks.
Our main contribution is that our analytical method considers the link addition and can be applied to make a policy for embedding a new link. Existing studies can be applied only for estimating robustness of given graph ensembles. However, our proposal enables to investigate percolation behavior according to different embedding patterns of inter-module links when a probability distribution of intra-module graph ensembles and that of inter-module link ensembles are given independently. Note that rewiring strategy in which the probability distribution does not change can make the problem for the analytical theory simple. However, link additions are more general than rewiring in the actual environment. Also, our virtual topology construction method proposed in our previous work 3 is composed of constructing intra-module topology and adding inter-module links to connect them. Therefore, in this article, we focus on the link additions for improving our method proposed in our previous work. 3
Through simulation evaluations, our analytical results are in good agreement with numerical simulations in a configuration model network. Additionally, we show that it is hard to apply our proposal to the graph in which the number of nodes is small because the target of our approach is average properties of random graph ensembles. For the similar reason, we show that the result of analysis cannot completely capture the result of a percolation process on a graph having special structural properties, such as ring-shaped structure.
Related work
Many researchers have studied percolation processes on various types of graphs using a generating function approach. In this type of approach, the expected size of the giant component of a random graph ensemble can be derived from a probability distribution as given by a degree distribution or a distribution of types of links. We can then estimate robustness of a graph by evaluating percolation transitions of the size of the giant component. However, prior studies have focused on estimating robustness of given graph ensembles and not considered changes in graphs, such as link additions.
A generating function approach has been proposed for estimating robust connectivity of random graph ensembles.
5
In this method, the targeted ensemble of random graphs is defined by a generating function
Another important analytical method is a binary-dynamics model for evaluating percolation and other dynamic processes. 4 This method is relatively simple. In this method, the probability distribution of links is used to obtain the percolation behavior of the network. The probability distribution of links represents modular structure, degree–degree correlation within modules, and degree–degree correlation between modules. The type of the percolation model can be configured by changing the definition of a response function. The detail of the binary-dynamics model is shown in the next section. The binary-dynamics model can be applied to broad classes of graphs by configuring the probability distribution according to the node types or link types.
Almost all existing methods, however, focus on evaluating percolation processes on graph ensembles where a probability distribution is given, and the problem of how to embed links for constructing a robust topology is not examined. Therefore, we propose an analytical method that takes into account changes in the probability distribution due to addition of inter-module links.
Method
Binary-dynamics model
Before we explain our proposal, we explain the binary-dynamics model in detail. For convenience of explanation, we denote the type of a degree-k node belonging to module i by
In the binary-dynamics model, each node takes one of two states: active or inactive. An inactive node of which a neighboring node is active changes its status to active stochastically. The dynamics of binary state of nodes can be regarded as a percolation process. The probability that an inactive
In the binary-dynamics model, when the probability that an
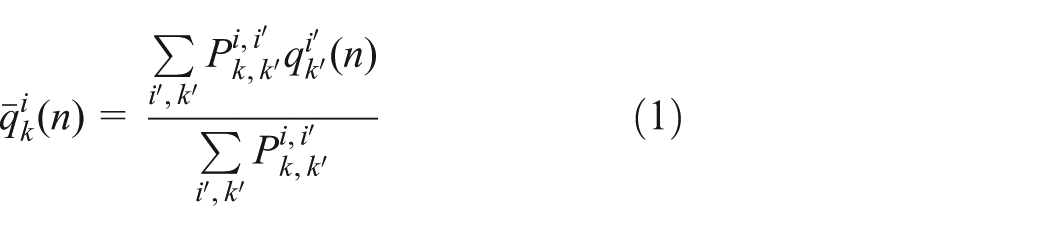
Then,

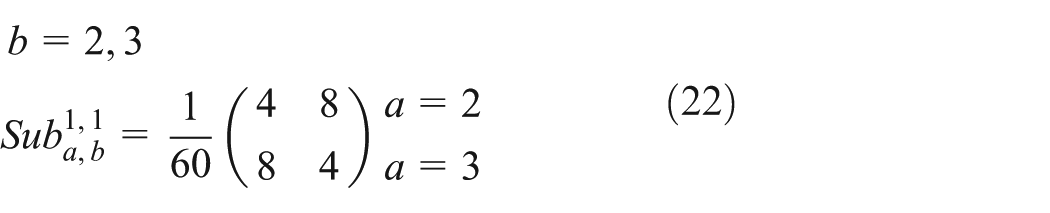
where
From the above, the ratio of the number of active nodes to all nodes at step n, denoted as

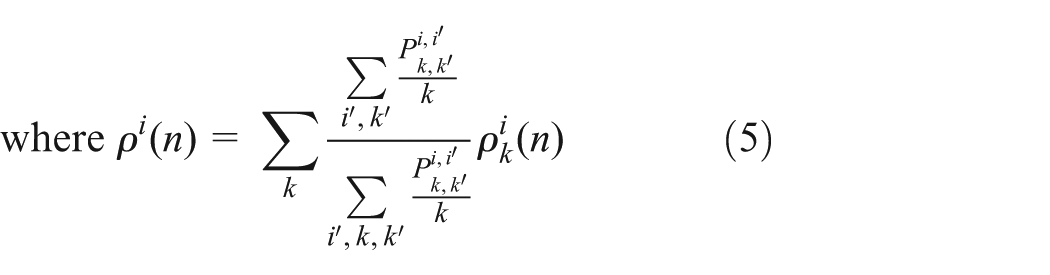
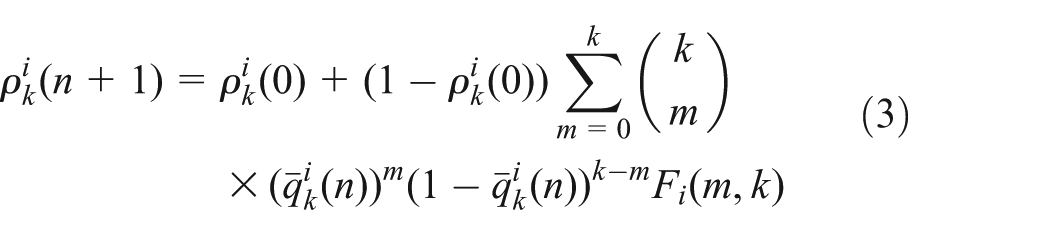
In percolation, the ratio of the active nodes to all nodes at which the dynamics (i.e. the iterative calculation of equations (1), (2), and (4)) converge describes the size of the giant component. Thus,
It is true that
Deriving link probability distribution after addition of inter-module links
To investigate differences in robustness depending on the connection patterns between modules using the binary-dynamics model, we analyze site percolation when the connection patterns between modules are changed and the probability distribution of links within each module is given. However, we need to consider the change in the probability distribution of links within each module according to addition of inter-module links.
In this article, we consider that two previously isolated modules are connected by newly created a fixed number of inter-module links, and that these links connect a number of nodes with a fixed degree k in module i to a number of nodes with a fixed degree
First, we define tensor

We define

We consider the conditions specified by equations (6) and (7) to calculate the probability distribution of links after addition of inter-module links, denoted by tensor

where
In this article, we consider the case that the number of modules is two and the number of types of inter-module links is one. When the type of inter-module links is

Focusing on module i, if we consider that the degree resulting from the addition of inter-module links is d, then we add
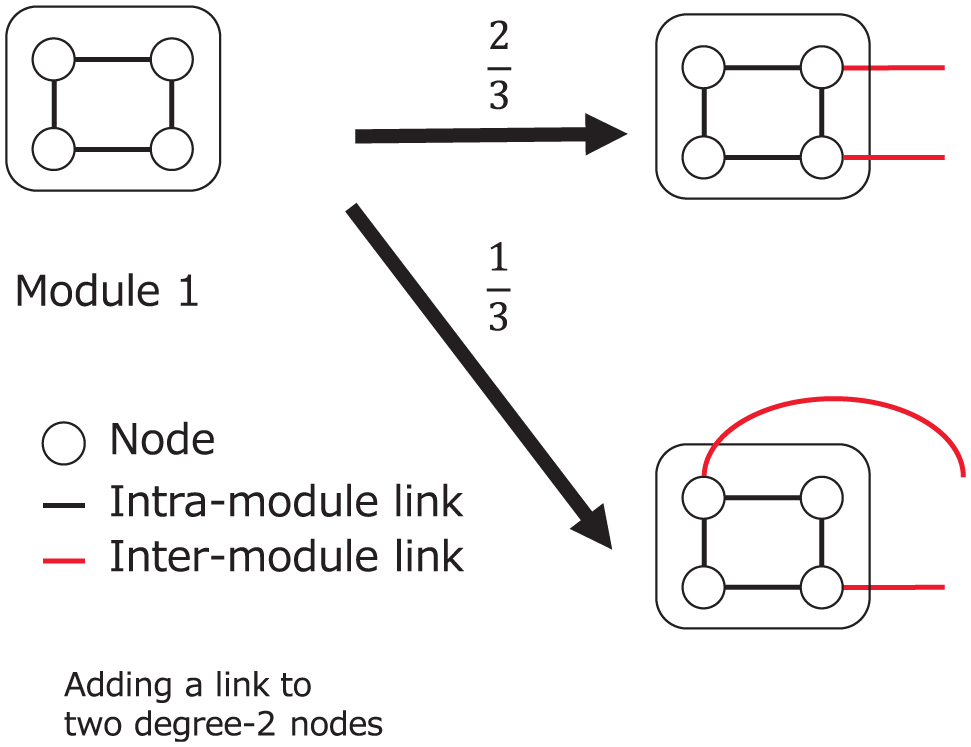
For example, we assume we use the topology shown in Figure 1 and add an inter-module link to a degree-1 node. In this example,
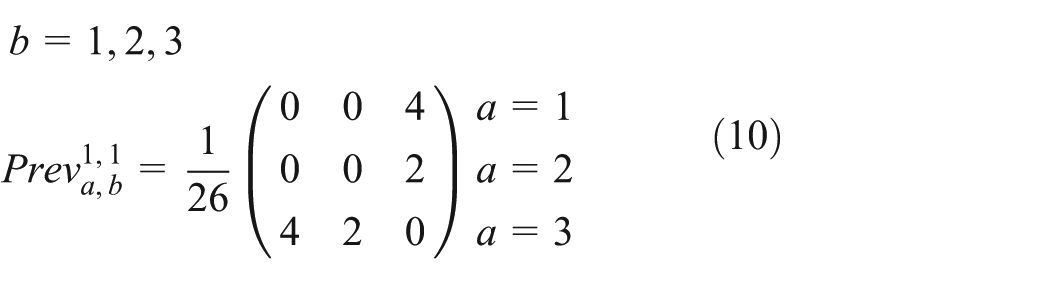

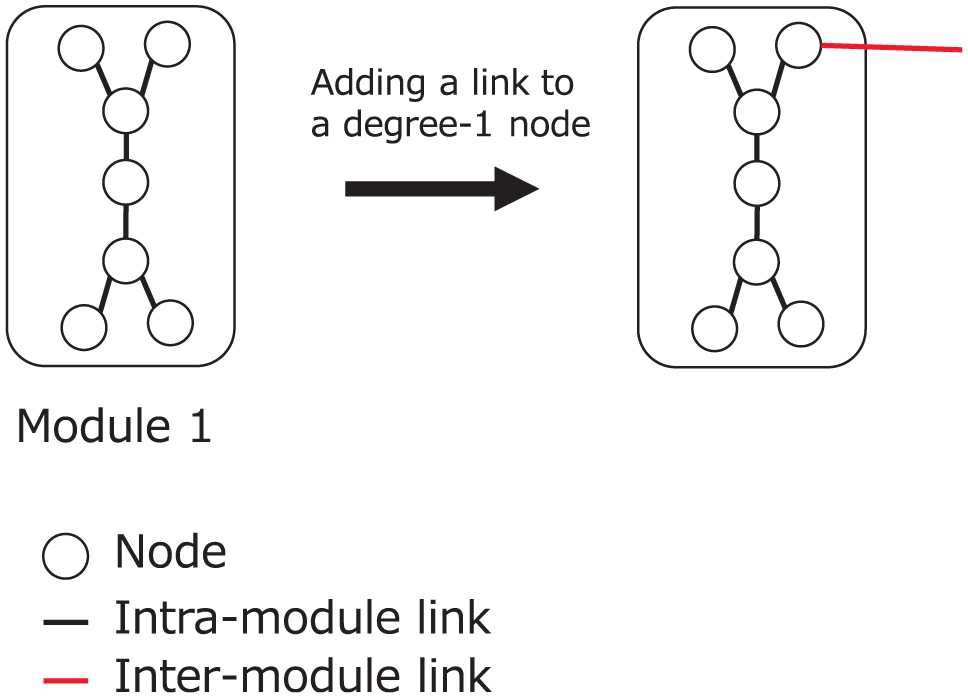
Example of inter-module link addition.
Next, we define the magnitude of influence by link addition. Here, the magnitude of influence means the ratio of the number of intra-module links which change their type because of the change in degree of their endpoint nodes. The magnitude of influence by link addition to a degree-k node is k times as large as that by link addition to a degree-1 node because the number of links changing their type is proportional to the degree of the node that receives the inter-module links. Also, the magnitude of influence by addition of

where H is the Heaviside step function. As the networks considered here have only two modules and also as just one fixed value of d and
Moreover, when we add some links to a degree-k node, the probability that degree of its neighbor is
where
When we calculate


Example of link addition in which different probability distributions arise according to the connected node.
However, the case of adding links to multiple nodes is not considered in equation (14) because the equation cannot describe the change in link type from


Example of multiple links addition in which different probability distributions arise according to the connected node.
This problem can be solved by replacing
To calculate

where N is the total number of nodes and

Note that

Therefore, when the expected total number of nodes is given,
Constraints of input variables
In our approach,

We can rewrite the above into a constraint on

Because the lower bound depends on N, there are cases where the desired graph cannot be constructed if N is small.
Simulation evaluation
We investigate robustness according to the connection patterns of inter-module links using our proposed method. To evaluate validity of our proposal, we compare the analysis results with the numerical results. In numerical simulations, we evaluate the site percolation process on a graph constructed by a configuration model according to
The method for constructing a graph based on
Constructing a graph within each module Calculating a degree distribution of each module from Calculating the number of each type of intra-module links from Selecting a pair of endpoint nodes of each intra-module link from the candidates at random and connecting them.
Adding inter-module links Calculating the number of the specified type of inter-module links from the ratio of Determining a set of the candidates for the boundary nodes at random according to the connection pattern of inter-module links; Selecting a pair of boundary nodes of each inter-module link from the candidates at random and connecting them.
In numerical simulations, we assume that inactive nodes are failed nodes.
Percolation on graph ensembles with a given probability distribution
Simulation settings
We assume that the number of modules is two and the probability distributions of intra-module and inter-module links are given by equations (29) and (30), respectively. Equation (29) describes that the degree distribution of each module is uniform. In this case, the ratio of the number of intra-module links to inter-module links is 200 to 3. The expected total number of nodes is 1000 when we analyze the percolation process using our proposed method. We analyze the site percolation process with various combinations of d,


In the percolation process, we use two modes of node removal: random failure and targeted attack. In random failure mode, a removal node is selected uniformly at random, while in targeted attack mode, a removal node is selected in order of decreasing degree. We then define a response function for each node removal mode in order to analyze the site percolation process using our method. In the binary-dynamics model, 4 the response function for the site percolation is defined as follows

where


where
Here, we consider that analytical results are obtained by iterative calculation of equations (1), (2), and (4).
Analysis of percolation in random failure mode
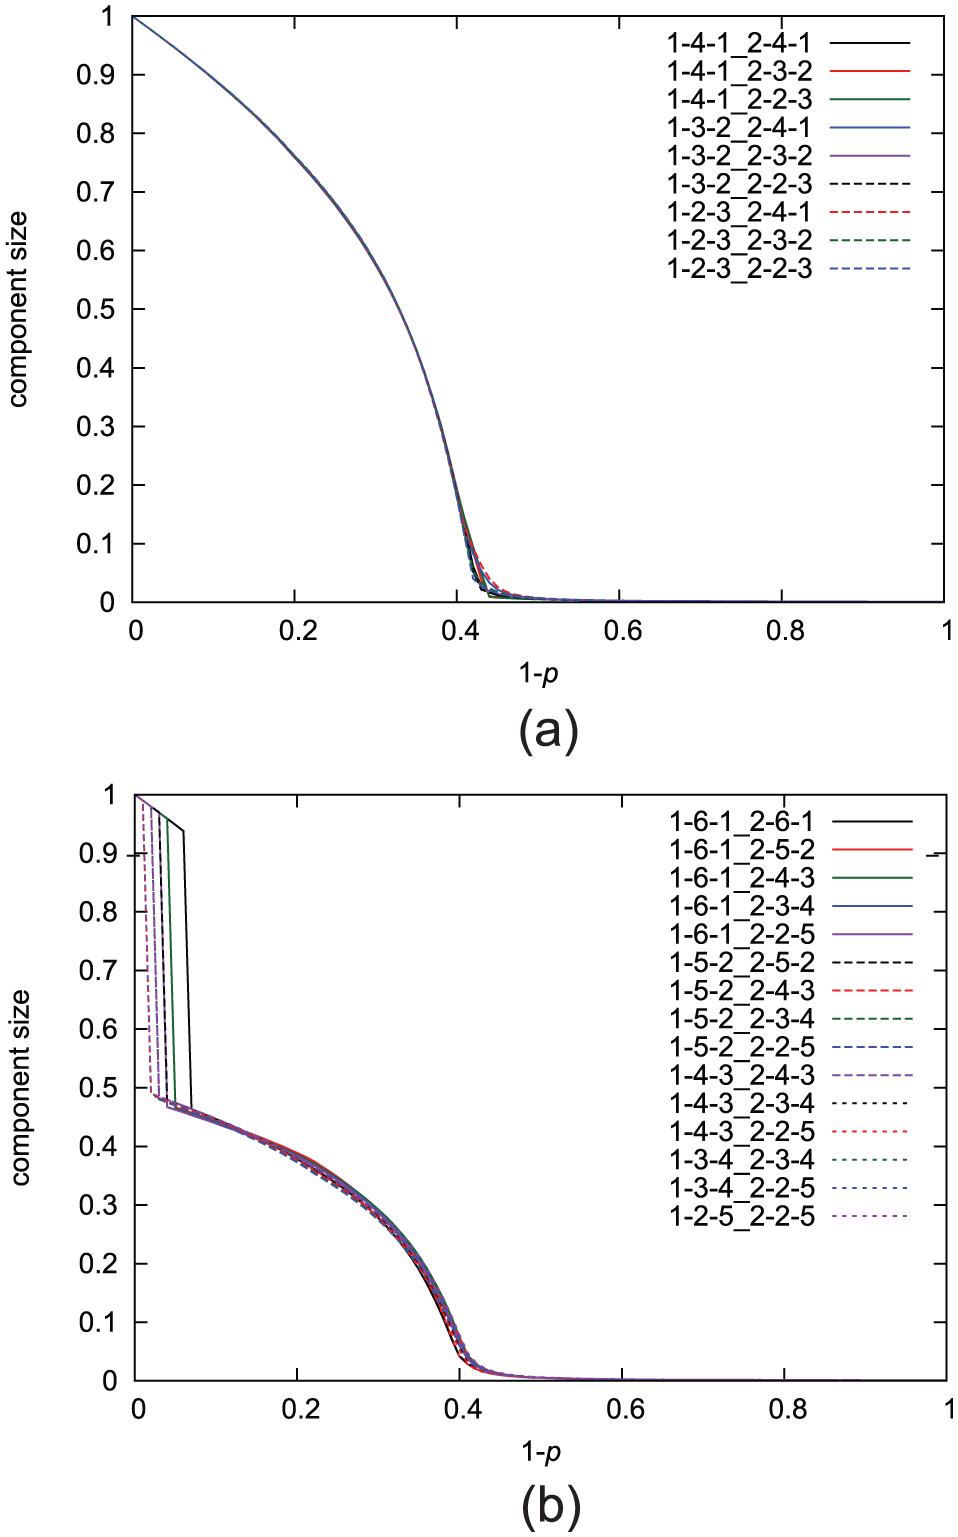
The results of analysis in random failure mode are shown in Figure 4. We evaluate the percolation with various combinations of d,
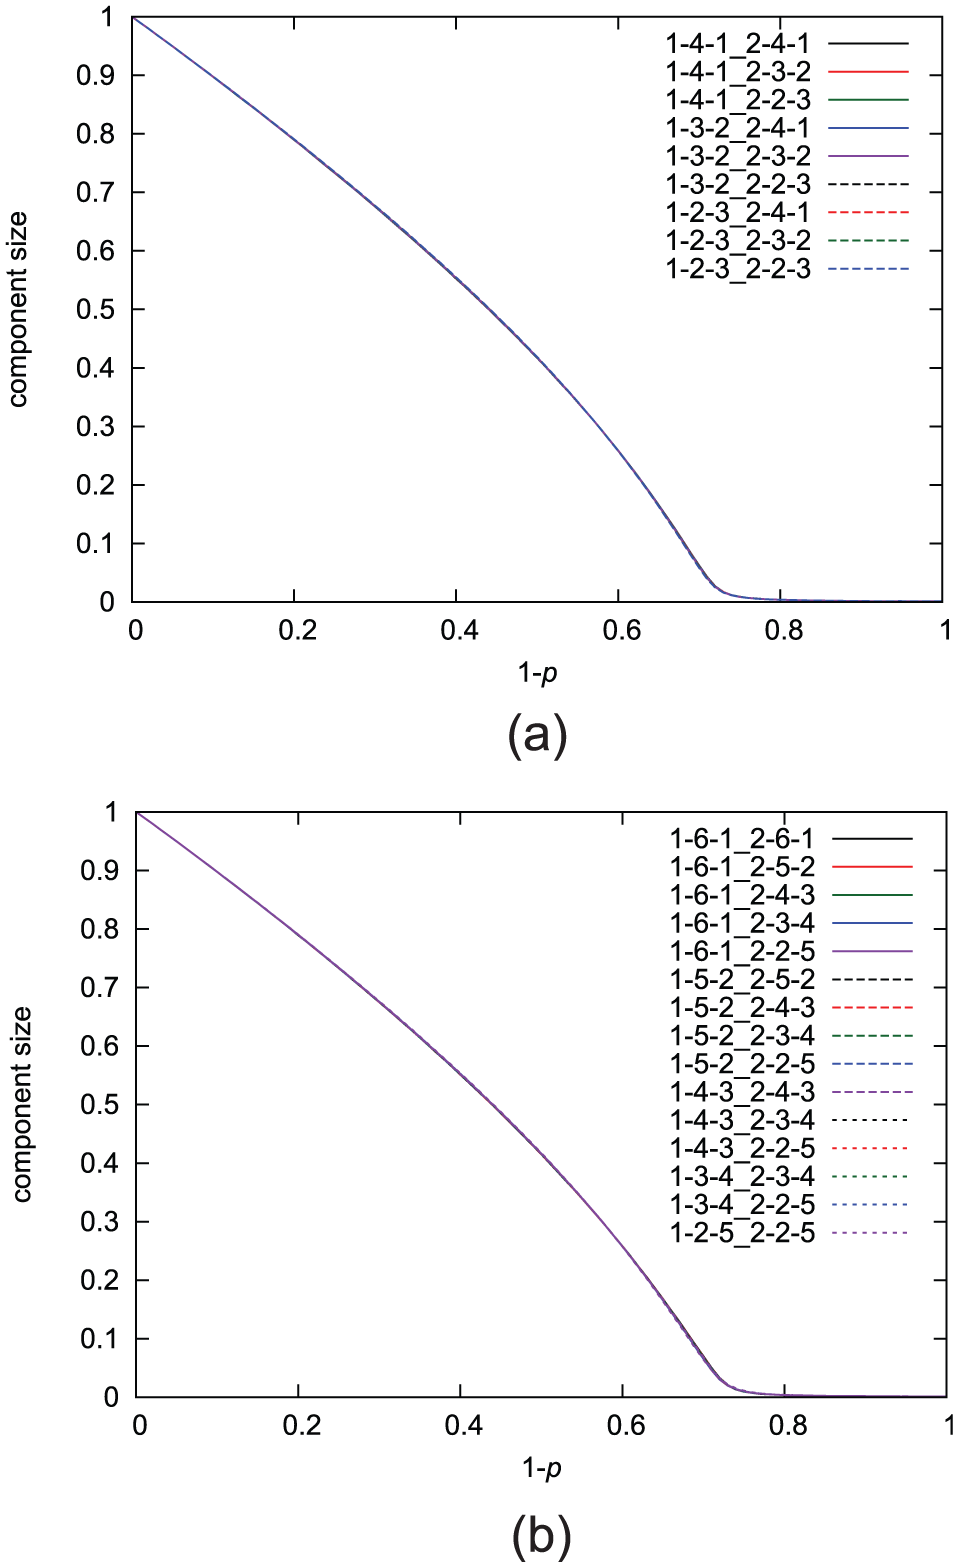
Analytical results of percolation analysis in random failure mode: (a)
As shown in Figure 4, there is little difference depending on the connection pattern of inter-module links in random failure mode.
To evaluate validity of our analytical results shown in Figure 4, we construct a graph with the number of nodes set at 1000 and investigate the site percolation process on it in random failure mode. The number of trials is 500. Figure 5 shows the results of the site percolation process in random failure mode with k and
Numerical results of the site percolation process on graphs in random failure mode with k and
To compare the graphs in which the number of boundary nodes is the same, we show the results of the site percolation process in random failure mode with

Numerical results of the site percolation process on graphs in random failure mode with
Analysis of percolation in targeted attack mode
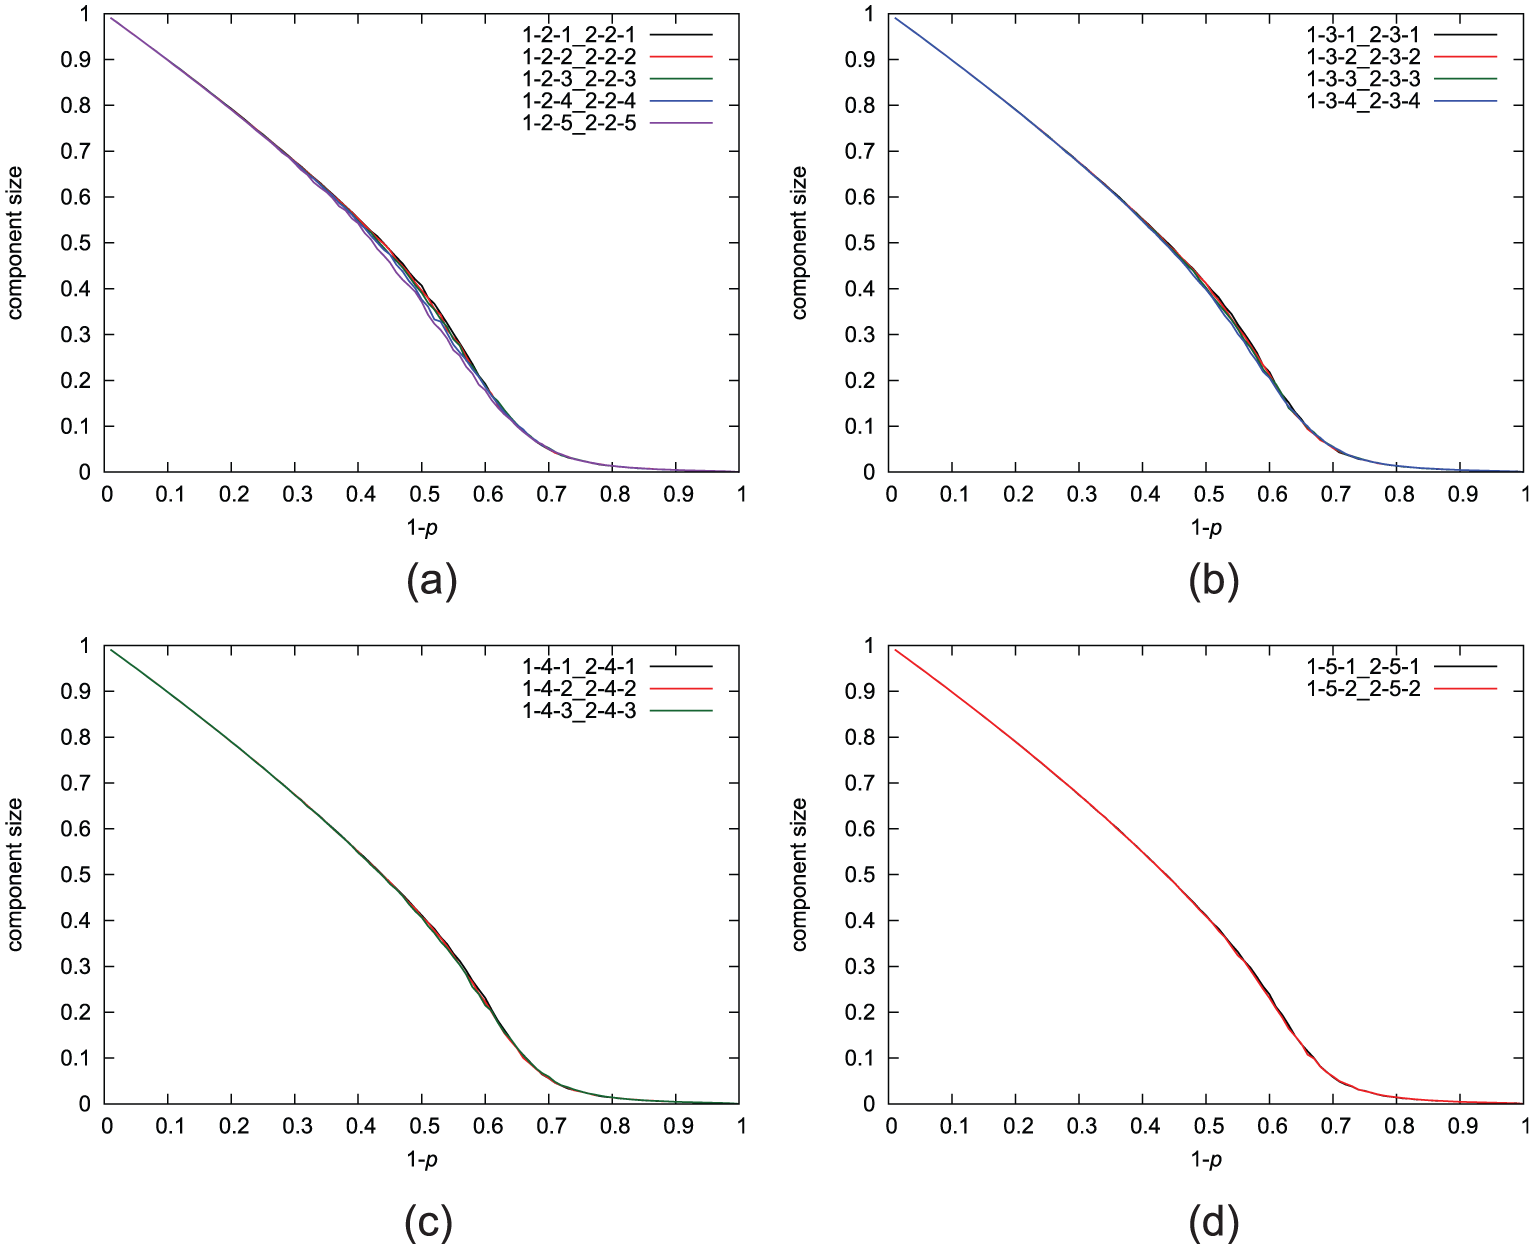
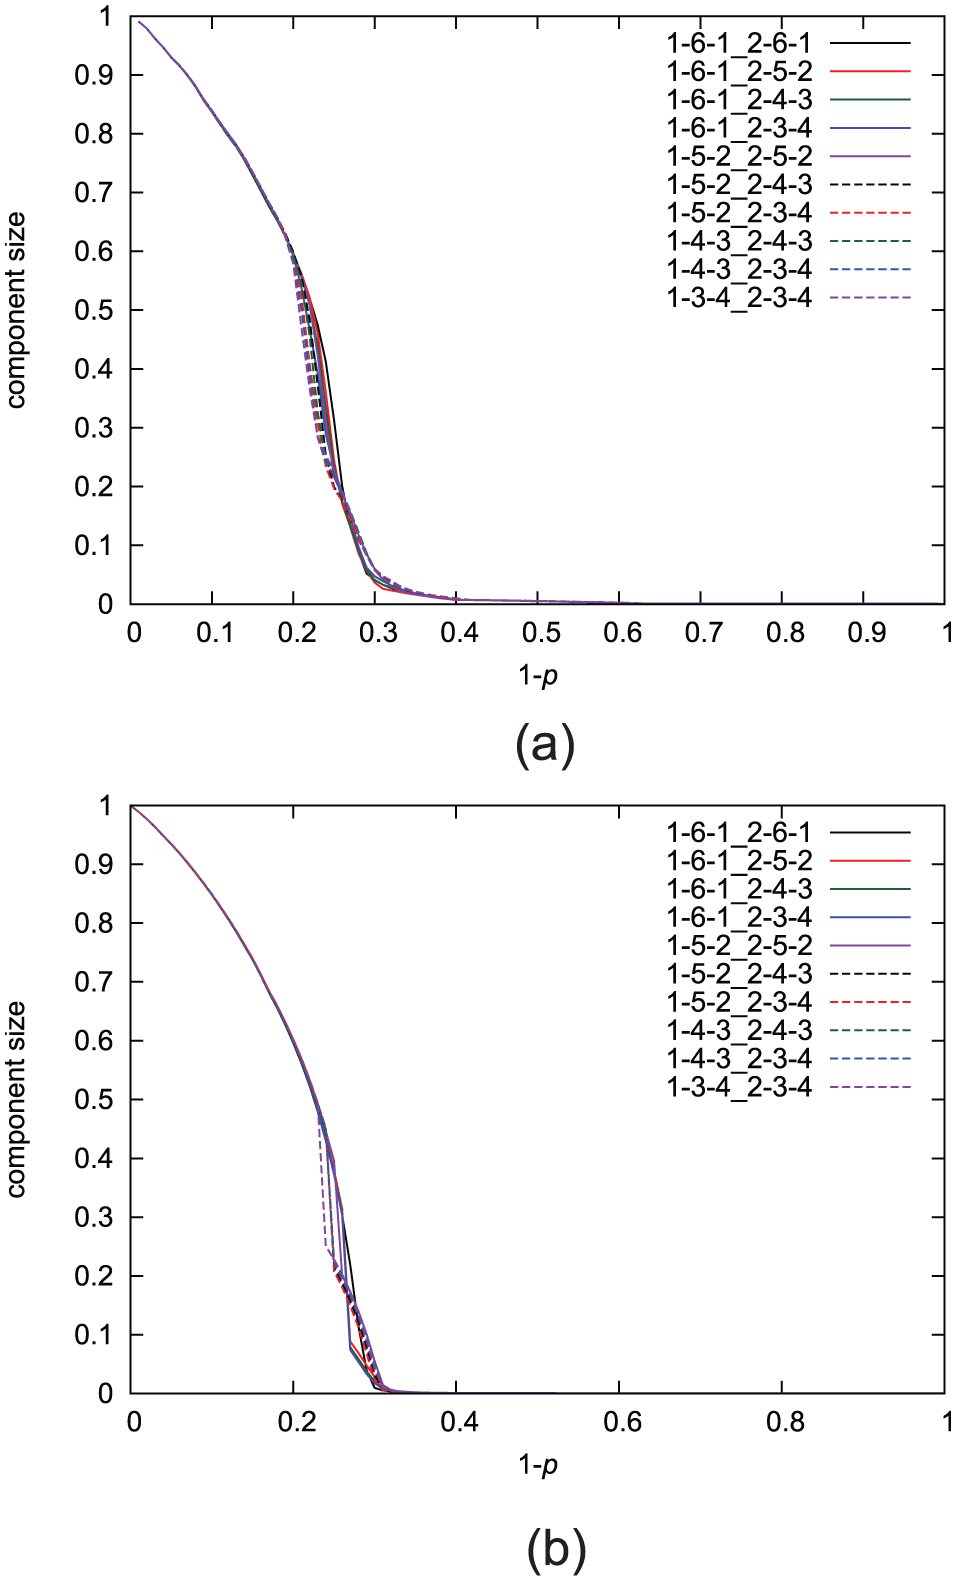
The results of analysis in targeted attack mode are shown in Figure 7. The results for the case of
Analytical results of percolation analysis in targeted attack mode: (a)
In Figure 7(a), all results show that the size of the giant component decreases sharply at
In Figure 7(b), every result shows a phase transition at small
To evaluate validity of our analytical results showed in Figure 7, we construct a graph with the number of nodes set at 1000 and investigate the site percolation process on it in targeted attack mode. The number of trials is 500. Figure 8 shows the results of the site percolation process in targeted attack mode. By comparison with Figure 7, although the giant component size in each method is slightly different, the order of robustness of each connection pattern is the same. From these results, analytical results are in good agreement with numerical results and the graph in which the number of boundary nodes is large has more robust connectivity for small

Numerical results of the site percolation process on graph in targeted attack mode: (a)
Applicable range of our proposed method
When we consider the IoT environment, there may be cases where the number of nodes belonging to each module is large. Given this context, we need to investigate the applicable range of our proposed method for making policies according to the results of analysis.
To show the applicable range of our proposed method, we compare the results of analysis to the results of the percolation process on the graph when the number of nodes is one of 100, 200, 500, 1000, 10,000 and 20,000, respectively. We use the method of
Figure 9(a) shows the results in random failure mode and Figure 9(b) shows the results in targeted attack mode. Both show that difference between analytical and numerical results becomes larger as the number of nodes becomes smaller. This means that it is hard to apply our proposal to a graph in which the number of nodes is small because our approach derives average properties of random graph ensembles. However, such a small graph can be analyzed by numerical simulations. Therefore, this is not a problem for our proposal whose target is the graphs in which the number of nodes is large.

Comparison of the analytical and numerical results: (a) random failure mode and (b) targeted attack mode.
In Figure 9(b), however, the results of analysis cannot completely capture any of the numerical results. In this evaluation, degree-7 nodes are 6% of the total nodes and half of them belong to module 1 and the rest belong to module 2. In the analysis method, the selection of a removal node is regarded as completely uniform. This means that the graph is not divided into modules until all degree-7 nodes are removed. In the numerical simulations, however, the graph can be divided into modules when half of degree-7 nodes are removed because removal of all degree-7 nodes belonging to module 1 or 2 results in fragmentation of the graph. Therefore, the numerical results show a phase transition at an earlier stage than the analysis. In addition, Figure 9(b) shows that a graph with a small number of nodes becomes vulnerable because the number of degree-7 nodes is small and the graph fragments easily.
The analytical results cannot completely capture any of the numerical results in targeted attack mode because of the reasons described above. The result for 10,000 nodes is almost the same as for 20,000 nodes, which means that the difference between numerical and analytical results cannot get any closer. Because this difference comes from the difference of an order of node that fails in the numerical simulation, the way that nodes fail is also an important factor which determines whether analytic results completely capture numerical results or not.
Percolation on graph ensembles with a probability distribution derived from a given intra-module topology
The results shown above are obtained when we first give a probability distribution and investigate the site percolation process on a graph constructed by the configuration model to evaluate validity of our proposed method. When we consider an actual situation, however, we need to show a policy to make a graph robust by connecting multiple existing networks.
Simulation settings
In this part, we investigate robustness of a graph in which modules are constructed by Erdős–Rényi (ER) model, Barabási–Albert (BA) model, and Watts–Strogatz (WS) model, 10 respectively. We use the parameters shown in Table 1 for constructing a module. Using these parameters, the expectation of the average degree in a module is 6 when the number of nodes in a module is 500. The number of modules is two, the number of nodes in a module is 500, and the number of links added between modules is 1% of the total number of links within modules. We compare the numerical results for the site percolation process on a graph constructed by modules and inter-module link, with the analytical results using the probability distribution obtained from existing modules.
Parameters for constructing a topology within a module.

ER model: Erdòs–Rényi model; BA model: Barabási–Albert model; WS model: Watts–Strogatz model.
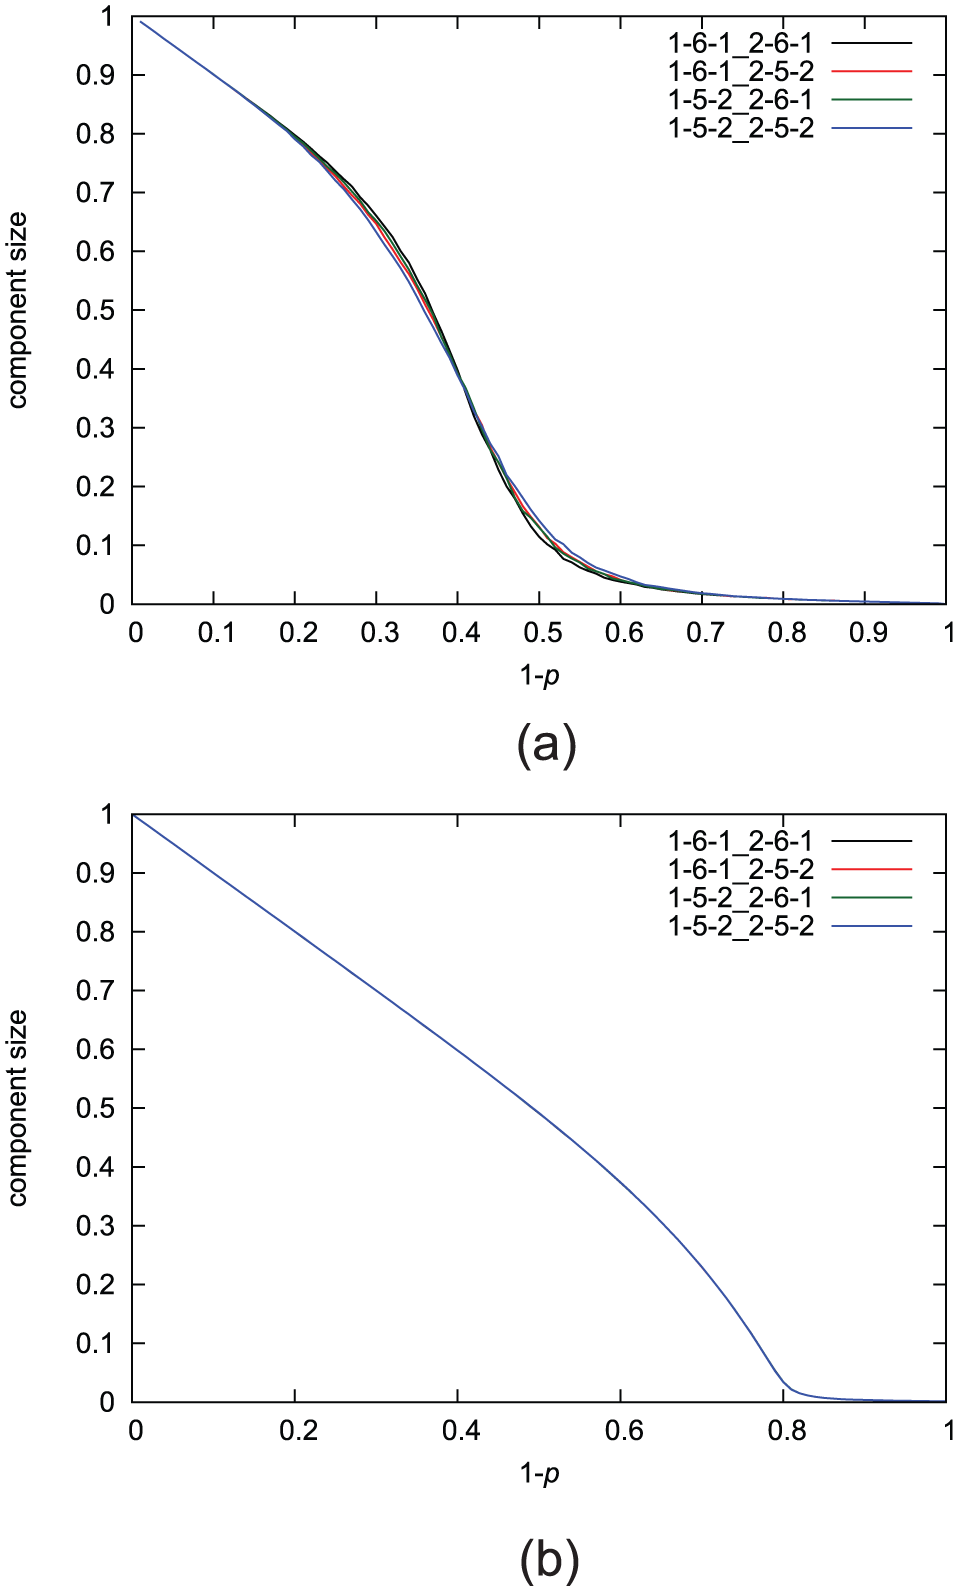
Results using ER model
The numerical and analytical results for the random failure mode in a network composed of ER modules are shown in Figure 10. The number of trials for numerical simulations in each topology is 100. The minimum degree within a module is 1 and the maximum degree within a module is 15.

The results in random failure mode (ER model): (a) numerical and (b) analytical results.
The numerical and analytical results for the case of
When we use the ER model for constructing a topology within a module, the numerical and analytical results in targeted attack mode are shown in Figure 11. The results in Figure 11(b) are consistent with the results shown above in terms of the first sudden decay of the size of the giant component. After the fragmentation of the network, the ranking of the size of the giant component changes. This is because the connectivity of the intra-module network remains high after the fragmentation when k (or

The results in targeted attack mode (ER model): (a) numerical and (b) analytical results.
Results using BA model
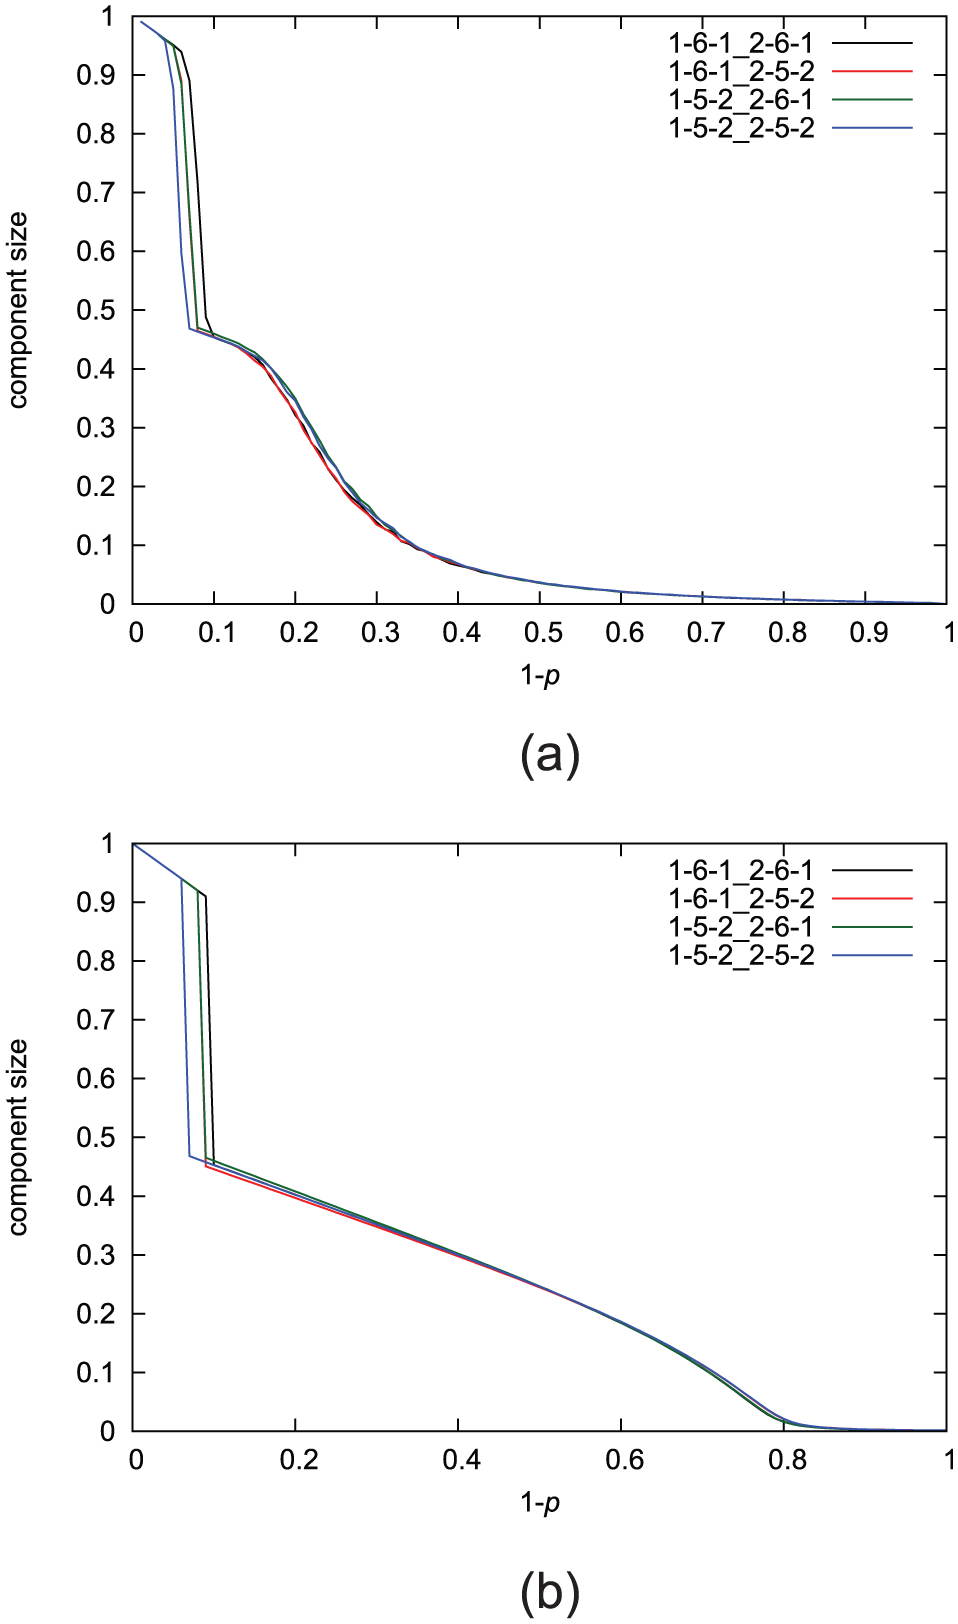
The numerical and analytical results for the random failure mode in a network composed of BA modules are shown in Figure 12. The number of trials for numerical simulations in each topology is 100. The minimum degree within a module is 3 and the maximum degree within a module is 76.
The numerical and analytical results for the case of

The results in random failure mode (BA model): (a) numerical and (b) analytical results.
When we use the BA model for constructing a graph within a module, the numerical and analytical results in targeted attack mode are shown in Figure 13. The numerical and analytical results for the case of
The results in targeted attack mode (BA model): (a) numerical and (b) analytical results.
Results using WS model
The numerical and analytical results for the random failure mode in a network composed of WS modules are shown in Figure 14. The number of trials for numerical simulations in each topology is 100. The minimum degree within a module is 4 and the maximum degree within a module is 8.
The results in random failure mode (WS model): (a) numerical and (b) analytical results.
The numerical and analytical results for the case of
When we use the WS model for constructing a graph within a module, the numerical and analytical results in targeted attack mode are shown in Figure 15. From the results shown in Figure 15(a) and (b), the results of analysis are consistent with the results shown above. A graph constructed by method in which
The results in targeted attack mode (WS model): (a) numerical and (b) analytical results.
From these results, our proposal can capture the order according to which the networks fragment into two modules. However, because we do not consider the structural properties of a graph within a module, a difference of analytical and numerical results occurs when a graph within a module has a special structure. It is our future work how to resolve this problem.
Conclusion
In this article, we propose a method for estimating robustness of graph ensembles after addition of inter-module links when the probability distribution of links within a module is given. Our proposal is to a binary-dynamics model 4 and add a new tool for the model. We investigate robustness according to the connection patterns of inter-module links.
In our simulation evaluation, we compare the robustness of the networks in various connection patterns of inter-module links when we fixed the values d and
To show a policy to make a graph robust by connecting multiple existing networks, we investigate robustness of a graph composed of modules with a given internal structure. The results show that our proposal can explain the order of the ranking of robustness (measured by the removal probability at which the network fragments into two modules) observed in the numerical results. Then, the number of nodes selected as boundary nodes and the degrees of boundary nodes before the link addition should be large in terms of the point of fragmentation of the network into modules when we fix the degree of the boundary nodes after the link addition.
However, because we do not consider the structural properties of a graph within a module, a difference of analytical and numerical results occurs when a graph within a module has a special structure. It is our future work how to resolve this problem.
For further investigation, we want to consider addition of multiple types of inter-module links. When multiple types of inter-module links are added, we cannot ignore the order of addition of the inter-module links because the conditional probability of the probability distribution of links changes after each addition of an inter-module link. This analysis will be realized when we use equation (14) multiple times according to the sequence of the type of new added link. Therefore, our method can also be applied to the graph in which multiple modules exist.
Footnotes
Academic Editor: Valerio Freschi
Declaration of conflicting interests
The author(s) declared no potential conflicts of interest with respect to the research, authorship, and/or publication of this article.
Funding
The author(s) disclosed receipt of the following financial support for the research, authorship, and/or publication of this article: This work was supported by a Grant-in-Aid for JSPS Fellows JP26·1639.