
Abstract
Indoor positioning systems have attracted considerable attention from practitioners and firms seeking to optimize the consumer shopping experience with the goal of attaining increased revenue and profitability. Acknowledging the importance of indoor positioning systems in store layout optimization, we conducted a field experiment for 11 months in order to develop algorithms for connecting indoor positioning data with customer transaction data. Using fingerprinting as a primary data collection technique, we compared positioning and transaction data before and after critical store layout optimization decisions in order to identify which customer movement patterns generated the highest sales. In contrast to previous works on indoor positioning systems, which focused solely on developing algorithms or techniques to increase accuracy rates, our algorithms in principle integrate computing and marketing perspectives. Our findings can be applied to store layout optimization and personalized marketing.
Keywords
Introduction
Store layout optimization is intended to optimize consumers’ shopping experiences with the goal of increasing revenue and profitability. By acquiring detailed knowledge in order to develop an understanding of customer movement patterns inside a store, firms can design a store layout that increases shopper traffic, average transaction values, and profitability. Adoption of various Internet of Things (IoT) technologies in brick-and-mortar stores has prompted such changes in the retail industry. In particular, indoor positioning systems (IPSs) enable real-time data collection and customer behavior analysis and allow practitioners to create customer-centric layouts that enhance merchandise and space performance. In this study, we focus on incorporating real-time customer movement pattern and transaction data. Specifically, we identify algorithms that can be used to transform positioning and movement pattern data from an IPS into processed data containing customer insights.
An IPS uses radio waves, magnetic fields, acoustic signals, or other sensory signals relayed through mobile devices in order to assess the locations of objects and people within buildings. 1 Existing location-based services, which are based on the satellite-based global positioning system (GPS) or cellular triangulation technology, face limitations in roofed venues due to microwave signal attenuation and scattering by construction materials used for roofs and walls.2,3 However, the locations of users in indoor environments can now be tracked through the increased use of more accurate Wi-Fi, Bluetooth, radio-frequency identification (RFID), near-field communication, and other close-range wireless technologies. Smartphone’s sensors such as proximity sensors, accelerometers, ambient light sensors, moisture sensors, gyroscopes, and compasses can play a significant role in providing detailed data on the actions of users. Finally, the development of microelectromechanical systems (MEMS) has marked the opening of an Internet of Things era in which sensors are minimized and all objects are placed on the network.
The indoor location-based service market is expected to grow from US$935 million in 2014 to US$4424 million by 2019, at an estimated compound annual growth rate of 36.5% over this period. 4 The number of active beacons in the United States is expected to increase to 4.5 million by the end of 2018, up from approximately 30,000 in 2015. This anticipated growth is based on the effect of promotions involving beacon technology that are expected to engender a 20-fold increase in customer purchase intent. Based on studies such as a survey on the degree of technology adoption in retailers in which it was determined that 71% of retailers were planning to count people and 68% were considering Wi-Fi in their stores user analysis based on indoor positioning is expected to become more widespread 5 and the minimization of trade-offs between localization accuracy and infrastructure costs will become more important. 6
In this study, we conducted a field experiment and identified algorithms that both researchers and practitioners can employ in connecting indoor positioning data with customer transaction data to optimize store layouts. Methodologically, we collected positioning and movement pattern data through a wireless sensor network both inside and outside of a store and utilized these data in order to optimize the store’s layout to maximize sales. We used fingerprinting as our main data collection technique because it does not require line-of-sight measurement of access points (APs) and enables highly accurate calculations in complex indoor environments.
The main contributions of this research are summarized as follows. (1) While previous works on the IPS focus solely on developing algorithms or techniques to increase the accuracy rate, we examine the processes in which customer positioning can be linked with transaction data. In other words, we examine the algorithms after positioning data collection in order to enable the use of combined data sets for store layout optimization. Although such algorithms can benefit business practitioners, previous work on this topic is surprisingly limited. (2) Furthermore, our research is particularly meaningful because we conducted a longitudinal study based on a field experiment in a real-world store setting. (3) In the field experiment, which was conducted over 11 months, we compared positioning and transaction data before and after a critical store layout optimization decision in order to obtain customer insights.
The remainder of this article is organized as follows. In section “Background knowledge and related works,” we review related work on the IPS and customer behavior analysis in order to gain insights for application to store layout optimization. In section “Design details,” we describe our research design, which includes experimental settings, a data collection process, and a methodology. Section “Experimental evaluation” details our data analysis process, store layout optimization decision, and experimental results both before and after the optimization decision. In section “Conclusion,” we discuss theoretical and practical implications of our findings as well as future research plans.
Background knowledge and related works
In this section, we review related works on the IPS from two different perspectives: radio fingerprinting as a positioning algorithm and wireless local area networks (WLANs) as a radio-frequency (RF) technique. In addition, we examine previous literature that connects insights from the IPS with customer behavior analysis.
Radio fingerprinting as positioning algorithms
RF-based localization algorithms are used for the implementation of the IPSs. Such algorithms can be categorized as triangulation, proximity, radio fingerprinting, or dead-reckoning techniques.7,8 Here, we explain radio fingerprinting, which is used in section “Design details.”
Radio fingerprinting, a signal distribution technique, involves site surveying to construct fingerprint maps under the assumption that each location has a specific signal characteristic. Various algorithms are then used to map the signals received from the monitoring device onto a fingerprint map. 9 Surveys are conducted from an offline training phase and queries are sent from an online position determination phase to carry out signal collection and indoor location association. 10 Site surveys from the offline phase are conducted to collect the Wi-Fi signal vectors of the received signal strength indicators (RSSIs), which are collected from multiple APs located at reference points (RPs) with known locations. 11
In the online position determination phase, data related to target objects are measured and compared against pre-measured data collected during the offline phase. Fingerprinting uses deterministic methods and statistical methods to identify targets at the closest fingerprint location in non-line-of-sight conditions. Deterministic methods include Euclidean distance, cosine similarity, Tanimoto similarity, k-nearest neighbor, support vector machine, linear discriminant analysis, and so on, while the statistical methods include Bayesian networks, expectation–maximization, Gaussian processes, smallest M-vertex polygons, and so on.11,12 Fingerprinting is advantageous because it does not require line-of-sight measurement of APs and provides highly accurate calculations in complex indoor environments. 13 Temporal and spatial signal patterns, collaborative localization, and motion-assisted localization can be used to correct location errors that result from signal fluctuations in RFs. Examples of temporal patterns include peak-based Wi-Fi fingerprinting and Walkie-Markie, while examples of spatial pattern include UnLoc, HALLWAY, and Wi-Fi Signal Coverage Intersection and Division. Motion-assisted localization techniques that use inertial sensors in various devices include Zee, XINS, Graph-Fusion, HMM Fusion, Moloc, and MapCraft. 11
WLAN as RF-based IPSs
In object detection, a customer’s position and movements are tracked to obtain indoor location analytics. This involves two techniques: RF positioning and video analysis. Video analysis is implemented through highly specialized cameras that monitor movement. In this research, RF positioning was implemented using mobile apps or Wi-Fi-enabled devices that interact with sensors. 14 RF-based indoor localization devices can use GPS, WLAN, ultra-wide band (UWB), RFID, or Bluetooth. We explain WLAN used in this study in section “Design details.”
WLAN based on the IEEE 802.11 network operates in 2.4-GHz industrial, scientific, and medical bands and is among the most commonly used IPS techniques. Also called Wi-Fi, WLAN uses gross bit rates of 11, 54, or 108 Mbps and has a 50- to 100-m measurement range. Because it uses APs that are already installed in many buildings to enable Internet services and there is consequently no need to install extra infrastructures such as sensors for identifying locations, Wi-Fi is cost-effective and as such is most commonly used in indoor localization systems. 15 Wi-Fi-based positioning systems use the media access control (MAC) addresses of wireless service set identifiers and wireless APs for indoor positioning. Localization using WLAN is often based on received signal strength (RSS) and radio fingerprinting techniques. Because the accuracy of WLAN positioning system using RSS is approximately 3–30 m and updating occurs in cycles of several seconds, they have the disadvantages of low accuracy against dynamic variations in indoor environments and time delays caused by the time consumed in providing positioning data. 16
To resolve this issue, many researchers have studied robot-based or tracking-assistive wireless localization based on the IEEE 802.11 infrastructures. 17 Microsoft RADAR, 18 Horus, 19 DIT, 20 MultiLoc, 21 TIX, 22 OntoNav, 23 NAVIO, 24 Ekahasu, and COMPASS 9 are examples of IPS applications using WLAN. Khaoampai et al. 15 and Marques et al. 25 used a self-learning algorithm to create Wi-Fi fingerprints on separate floors as part of a floor localization system that measures positions within an indoor environment with at least two floors (applications of their method include FloorLoc-SL).
Customer behavior analysis and store layout optimization
Understanding and leveraging the various touchpoints of a “moment of truth” during a customer’s shopping experience is an important task in the retail industry. Previous studies on this subject in various industries have emphasized the importance of indoor location analysis.2,4,8,26–29 Indoor location analysis involves analyzing a customer’s behavior in brick-and-mortar stores with the goal of enhancing proximity marketing. Similar to the manner in which companies analyze online web-browsing on e-commerce sites, indoor location analysis involves the tracking and analysis of in-store movements in brick-and-mortar stores with the goal of enabling customer behavior analysis. In this process, businesses conduct path analyses that can be applied to store layout design.
Using the above processes, retail stores can view layout designs in which the company’s most strategic products are directly displayed in customers’ ranges of interest. Store managers can also determine the times and locations with the highest customer traffic to enable efficient store staff allocation. Furthermore, companies can increase sales rates through duration time analyses. The trend in which a positive correlation exists between visit durations and actual purchasing 30 can be even more apparent for particular store zones and products within those zones. Based on this knowledge, store managers can identify methods to increase the sales rates by responding to customers after acquiring information on customer interest based on visit duration instead of directly engaging to the customer at the start of a visit.
This study acknowledges the importance of indoor positioning analysis in store layout optimization and thereby connects customer positioning data with transaction data in order to identify customer movement patterns that generate the highest sales. Here, we have strived to integrate the computing perspective with a marketing perspective because we believe that the use of indoor location analysis in conjunction with sales analysis can effectively optimize store layout and personalized marketing. 31
Prior research on store layout optimization using the IPS is surprisingly limited. The extant literature focuses on increasing the accuracy rate of positioning by developing new algorithms or tools. However, the IPS has been significantly improved through the use of sensors (e.g. LiFS, Zee, Molé, GROPING) in smartphones, and it is difficult to find research that covers both location positioning techniques (e.g. Wi-Fi fingerprinting) and store layout optimization. Several researchers have attempted to compare different positioning techniques and applied their findings to floor planning; however, to date, no one has examined the use of the IPS for store layout optimization.
Table 1 presents the previous studies that implemented floor plans or performed customer behavior analysis using the localization technique. Specifically, a number of studies combined Wi-Fi RSS fingerprinting and floor plans established through site surveys to build IPSs. Recent studies such as LiFS, 32 Zee, 33 Molé, 34 and GROPING 35 introduced IPSs that overcome the shortcomings of time-consuming and labor-intensive site surveys through crowdsourcing using sensors embedded in smartphones such as accelerometers, gyroscopes, and compasses. In addition, some studies have analyzed customer movement paths or performed customer behavior analysis based on collected sensor data. De Marco et al. 36 analyzed the store operations records of Italian apparel retailers using RFID technology, and Kholod et al. 37 examined the effects of shopping path length in grocery stores on purchase behavior using RFID data. Takai and Yada 30 used RFID data in a Japanese supermarket to derive the relationship between stay-time and purchase probability. Pierdicca et al. 38 suggested a persuasive retail environment by installing Bluetooth beacons in showrooms of Italian fashion retailers and using collected data for customer behavior analysis. Meanwhile, Xiaoling et al. 39 examined video tracking data using path analysis and a hierarchical Bayesian model and studied the effects of interactive social influence (salesperson contact, whining-group discussion) and shopper density (crowding) on purchase. Popa et al. 40 collected data through closed-circuit television systems in shopping malls using computer vision technology applications such as motion detection, background modeling, object detection, face detection, and object tracking, and applied the results to shopping behavior analysis.
Studies on indoor positioning using floor plan and customer behavior analysis.

IPS: indoor positioning system; WLAN: wireless local area network; RSS: received signal strength; RFID: radio-frequency identification; CCTV: closed-circuit television.
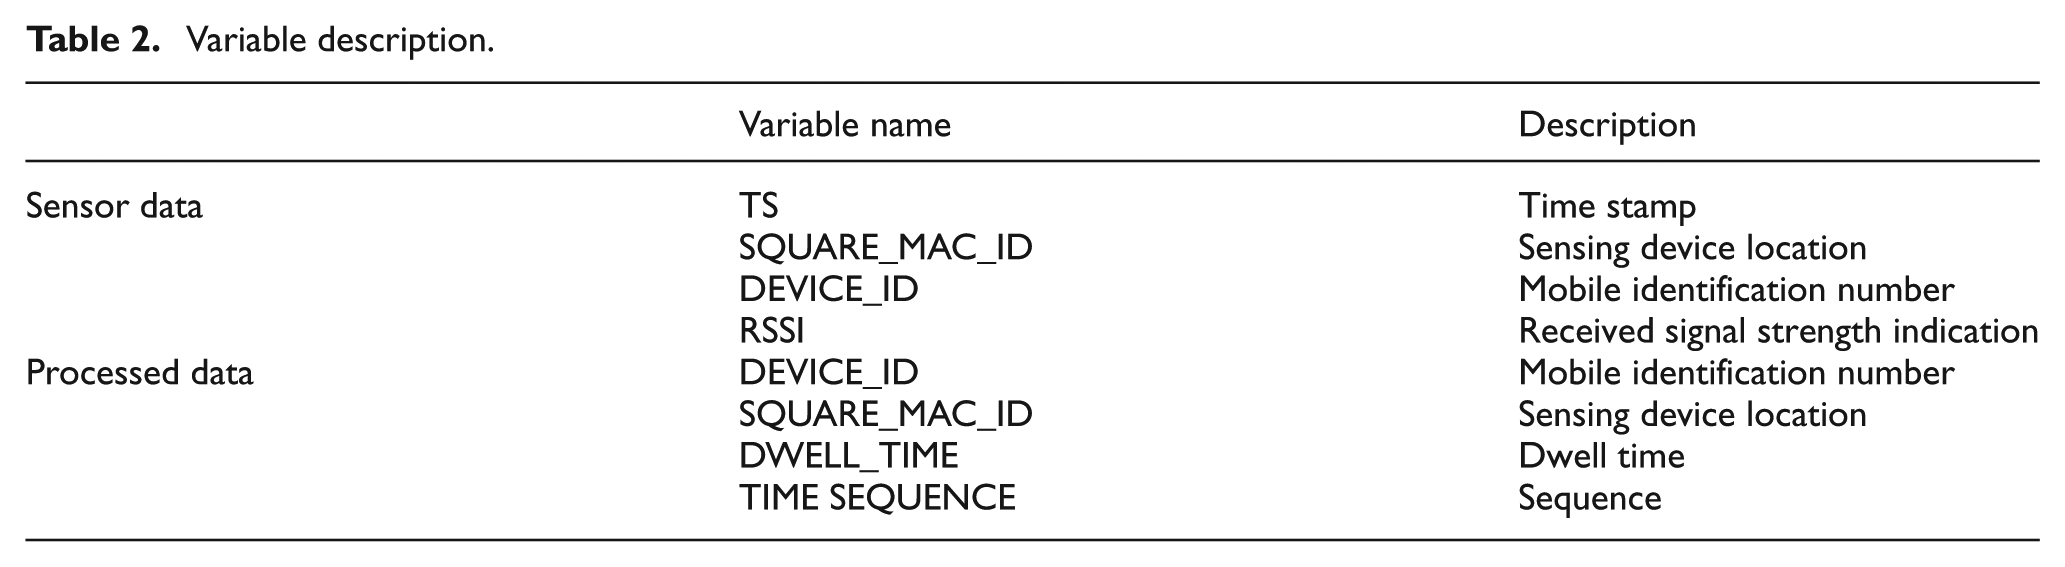
Variable description.
Design details
Experimental settings and data collection
Our field experiment tracked movements of customers who made direct purchases. In the field experiment, the store was divided into five sections (right-enter (RE), right-inner (RI), left-enter (LE), left-inner (LI), and counter-AP). We assigned the MAC addresses of each customer to one of these five sections and examined in-store movements for 3 months starting from August 2015 (Round 1), and for 9 months starting from November 2015 (Round 2). The right side of the store included women’s classics, casual clothing, bags, and accessories, while the left side primarily contained men’s clothing.
If the Wi-Fi of a visiting customer’s mobile device was activated, the MAC address of the mobile device was detected. We could track movements of 3647 visitors, which was about half the number of visitors estimated to have visited the store during the given period. The total number of visitors was estimated based on the historical average of daily visitors (approximately 100 visitors/day). Under the assumption that most visitors had a mobile device when they entered the store, we found that about 50% of them activated Wi-Fi. This finding aligns with the Wi-Fi activation index ratio in a recent study related to mobile devices. Among the 3647 visitors, we excluded customers who left the store after visiting only one section, and we only tracked customers who exhibited movement patterns between at least two sections, as our objective was to identify and compare movement patterns. Thus, we conducted our final analysis with the remaining 1050 visitors (Round 1).
Based on our analysis on positioning and transaction data collected for the initial 3 months (August to October 2015), we rearranged the store layout for 9 months starting from 18 November 2015 (Round 2) using the same method. During Round 2, we collected data from 11,455 visitors whose Wi-Fi was activated. For the analysis, however, we used data from only 3151 customers by excluding customers who left the store after visiting only one section.
As shown in Figure 1, customers passed the RE section of the store and stopped at the final counter-AP to make purchases. They then exited through the RE section, where the door was located. Therefore, we could connect the movement pattern data with sales data for each customer because we matched the transaction time of the sales data with the time data of the counter-AP positioning data. However, we could not assume that the customer would always be detected at the RE section because they could pass the entrance and RE section too quickly not allowing the sensor to detect them.

Store layout with five different APs.
Methodology
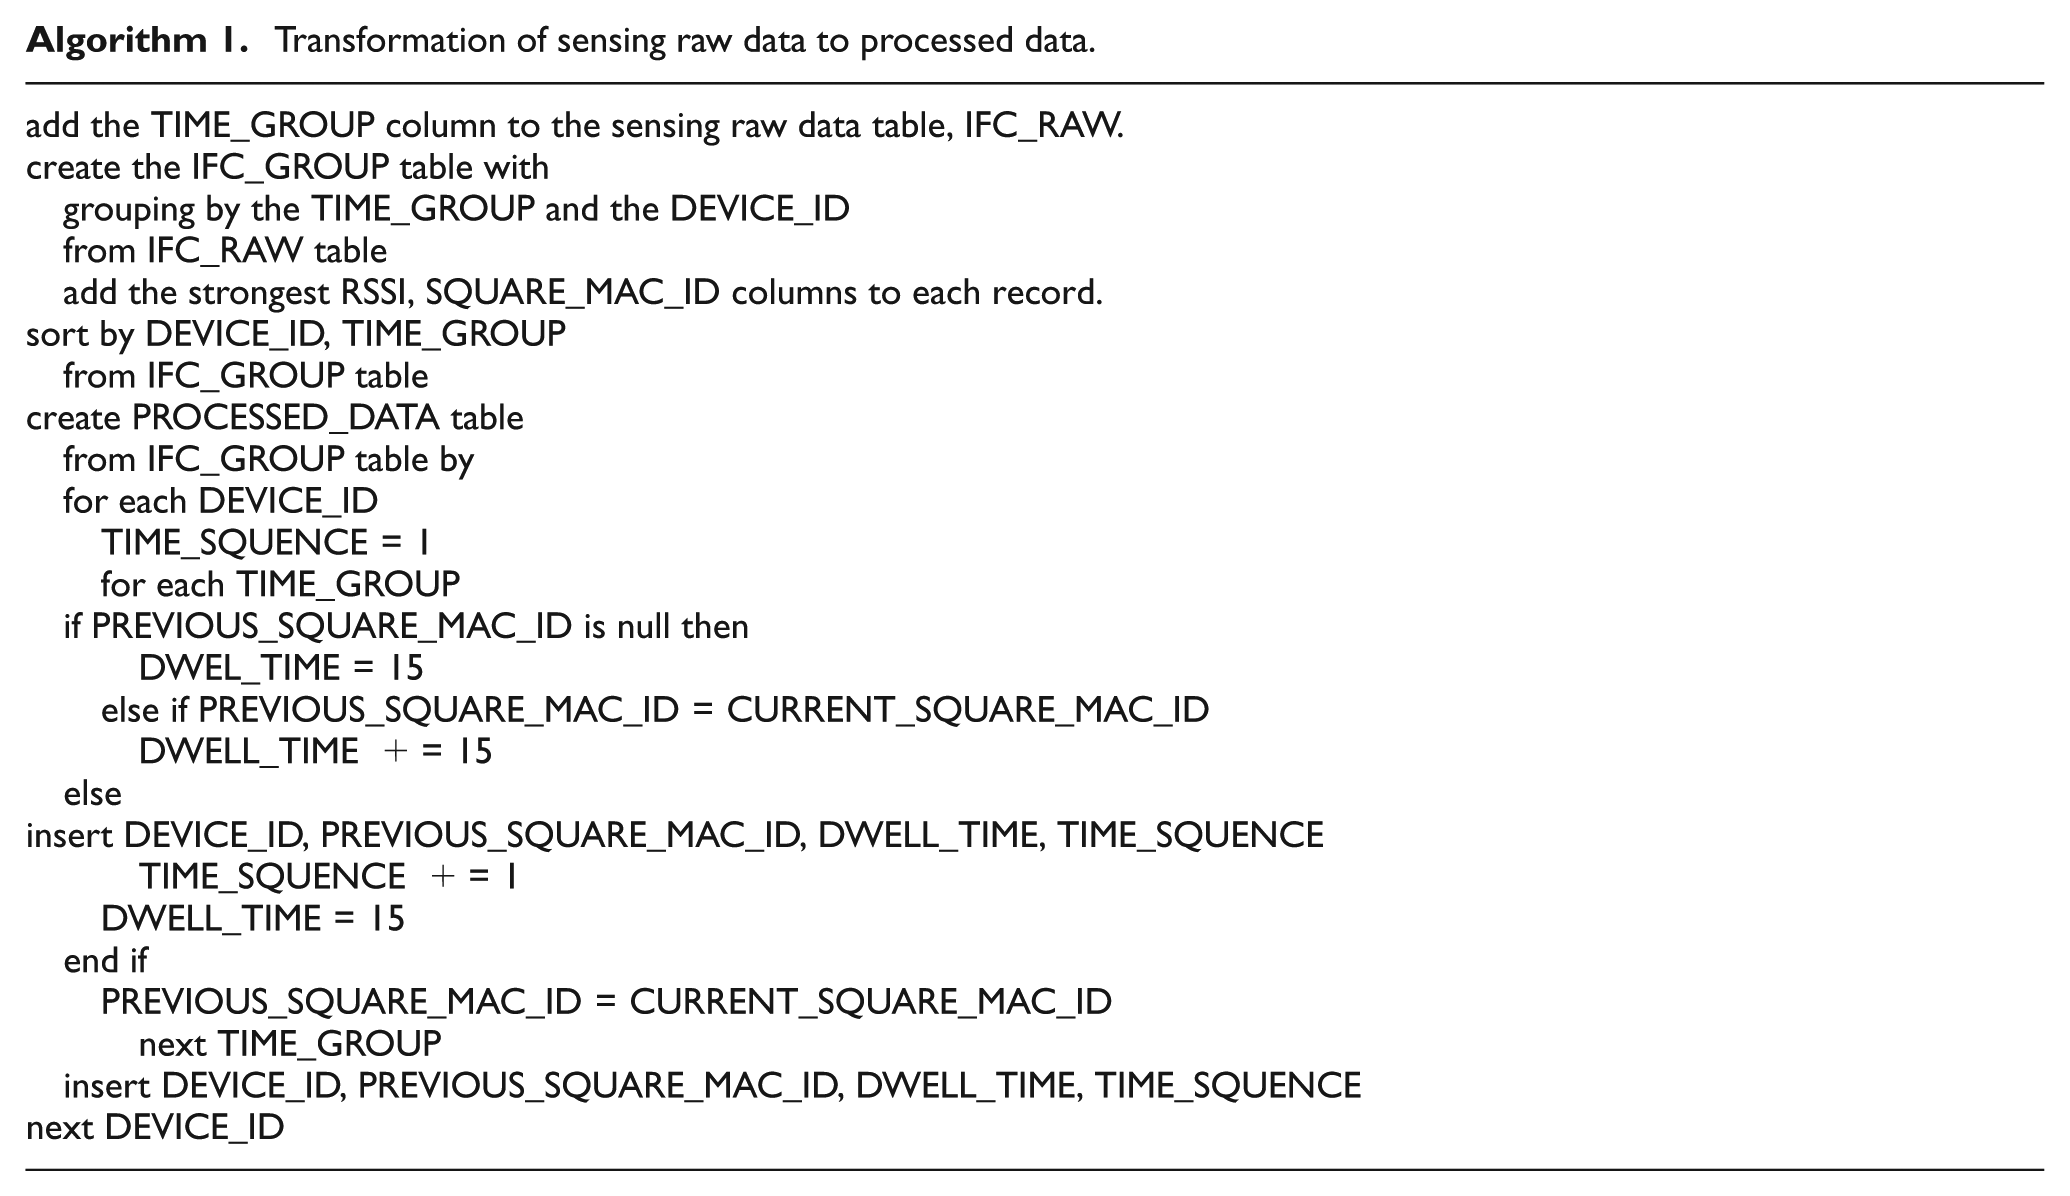
One of the two main objectives of this research was to develop algorithms that convert frequency sensor data from in-store fingerprint measurements into customer movement pattern data (Algorithm 1). The goal was to identify the algorithms that connect customer movement pattern data with transaction data (Algorithms 2 and 3). We performed this step to derive the amount of sales for each movement pattern. The second objective was to identify algorithms often used in marketing to convert transaction data into binary notations in order to effectively reduce the number of association rules for measuring support and confidence values to facilitate the comparison of sales across customer movement patterns (Algorithm 4).


To achieve the above objectives, we installed sensors that can detect mobile device IDs within each section of a particular clothing section in a major department store with high customer traffic. After the customer movement pattern was assessed and connected to sales data and the relationship between the movement pattern and sales was analyzed, the main circulation of the store was rearranged alongside a redisposition of the clothing display. In this research, we hypothesized that doing this would ultimately produce a critical improvement in sales.
Although the actual data processing was implemented using an SAS algorithm, we use pseudo-code below to describe the process and to ensure code readability. Pseudo-code is an informal high-level description of the operating principle of a computer program or other algorithm. It uses the structural conventions of a normal programming language, but is designed for human rather than machine reading. Specific steps of our process are described in the following.
Algorithm 1
First, we collect data through in-store signal sensor devices under the assumption that the sensor devices in the store detected the activated mobile signals of customers. We then use the fingerprinting technique to create signal detection term units according to RSSI values repeatedly detected in each section. According to this technique, the value with the highest strength in each term is expressed in terms of distance from the device (Table 3).
Example of sensing raw data.

Following the equation below, we can infer that a minimum value indicates the strongest signal in the time zone and therefore serves as evidence that the customer is located in the given section at the given time. In the equation, j represents the signal strength of each section and i represents each time period (signal detection term unit). The distance from the section device to the customer position is derived from the gap between each section’s average signal strength and the signal strength of a specific time zone. In particular, the RSSI value represents the degree of separation from the centric device signal. Smaller negative and absolute values of the RSSI mean that the centric signal is close, and that the strength is high. The localization algorithm below shows that each value is multiplied and then square-rooted to offset any negative effect. The section with the minimum value is considered to be the location of the customer.

Next, we transform the collected sensor data into movement pattern data. The raw data in Table 3 show the RSSI values corresponding to a customer’s mobile signal (DEVICE_ID) during a specific time (TS) in a specific section (SQUARE_MAC_ID). The sensor data set is translated into the set in Table 4 using the query shown in Algorithm 1. The TIME_SEQUENCE is formed using the path through a specific section for each DEVICE_ID. To ensure that the customer remains in one section for a sufficient amount of time, the appropriate dwell time is set to 15 s.
Example of processed data.

Algorithm 2
Next, we connect the customer movement pattern for five sections of the processed data set with the store’s sales point of sale (POS) data. To connect these two data sets, the sales POS data occurring within 180 s of a customer’s dwell time in the counter-AP section are considered to be a customer’s sales record based on the assumption that the customers enter through RE, make purchases at counter-AP, and then exit through RE. Specifically, customer behavior is assumed to be consistent with a customer remaining for at least the minimum term at the counter-AP section followed by generation of sales POS data within 180 s thereafter (a key assumption of this research).
Algorithm 2 therefore generates a new data set. By connecting the sales data produced in this manner, we found that during the first 3 months of our assessment (Round 1), only 265 out of 1050 customers with at least two pairs of movement patterns had a sales record. In other words, the remaining 785 customers could be assumed to have left the store after window shopping.
This ratio greatly exceeds the customer sales ratio based on the store’s statistical floating population. However, the sales records of Wi-Fi deactivated customers were not available for this research (on average, about 40% of the population always activate their Wi-Fi), and the customers who travel less than two sections were excluded for research purposes. Thus, we can extrapolate our raw purchasing customer ratio to about 5%–7% of the overall traffic, which appears to be very realistic. Indeed, according to data collected in September and October 2015, 7% of all customers were shown to have made purchases.
Algorithm 3
To convert the data sets formed based on per-person basis (DEVICE_ID basis) into data sets based on each customer’s movement pattern, we organize the data by grouping the two sections into one ordered pair. Because we have to include customers who have not gone through sales to make a comparison, we group the remaining four sections except counter-AP. Based on this, 12 movement patterns were generated (Table 5). Probabilistically, six combinations combine two out of four points is six; however, in this case RE → LE and LE → RE are different ordered pairs, that is, different combinations because they have directionality.
Sales by movement: before the rearrangement event.

For the 3 months before the store layout rearrangement (Round 1), the total number of paired movement patterns was 1753, and the number of movement patterns that resulted in sales (for 265 people) was 715. There were 1038 paired movement patterns for the remaining 785. For the 9 months after the store layout rearrangement (Round 2), there were 5256 total movement patterns, with 2146 movement patterns for 792 people who made purchases, and 3110 movement patterns that did not result in sales for the remaining 2359 people.
Algorithm 4
We apply the sequential association rule, which is a technique often used in marketing, in order to compare sales and movement sequences for each movement pattern in a more scientific way. The association rule measures support and confidence according to rules of association for each product purchased by a customer. It is ultimately used as a marketing technique to decide on a cross-selling or positioning policy. Sequential association is a data mining technique that explores hidden patterns in data, and it can be considered to be a method that mines relationships between events that occur alongside a phenomenon or determines how a prior event suggests another event. In finding an X → Y type rule between items X and Y, it shows a correlation in which there is a high chance that Y will appear when item X with a previous attribute appears. Support and confidence are commonly used as the representative index that quantifies the degree of this association rule, and each index is defined as follows


where N is the number of total transactions, X is the number of transactions of section X, and Y is the number of transactions of section Y.
Support represents the probability that items X and Y will simultaneously appear, as shown in the above formula. Support is mutually symmetrical, with support for Rule X → Y and support for Rule Y → X having the same value. Confidence is the conditional probability that Y will occur when X. 0 ≤ S ≤ 1 and 0 ≤ C ≤ 1 can be established, and the association rule X → Y shows the probability that Y is established when condition X is established.
This research expands on the practice of simply examining the correlation between items in a transaction. We have redefined the above association rule to analyze the spending pattern of a customer according to the passing of time and how this change affects sales. In other words, we did not merely use data composed of transactions, items, and sections; rather, we analyzed the purchasing behavior through a customer’s sequential path based on information regarding time sequence. We then rearranged the movement patterns of high sales routes for each path in the store for marketing purposes of creating a plan to increase sales.
Another essential part of this research was analysis of spending behaviors exhibited by customers with the same movement pattern but with different directions. Thus, we redefined existing non-directional support using directional support. Algorithm 4 is a query for inferring directional support and confidence before and after the point of rearrangement. Its key point is that the target is the SECTION variable, and that a sequential path is deduced by forming a new TIME_SEQUENCE variable, which is the sequence of this variable.
Our approach is of interest as only a few prior studies have connected sales data with movement pattern data deduced through a path algorithm. By applying the sequential association rule, we found that spending patterns change according to changes in customer movement sequences (details in section “Experimental evaluation”). This finding is meaningful in marketing as well as in technical field studies involving the use of mobile signals rather than the common practice of evaluating simple traffic associations through volume.
Experimental evaluation
Results before store layout arrangement (Round 1)
Using the movement pattern and transaction data collected for 3 months starting in August 2015 (Round 1), we compared the unit sales of each movement sequence and calculated the total sales of each sequence. In addition, we estimated support and confidence values for each sequence. The results acquired through the methodology mentioned above are shown in Table 5.
Prior to the store layout rearrangement, the RE to RI movement pattern, which had extremely high support and confidence values, had a unit sales ratio of barely 7.6%. On the other hand, routes that included the men’s casual or men’s accessories section, such as LE to LI, LE to RI, or RE to LE, did not have very high traffic, but had considerably high unit sales ratios.
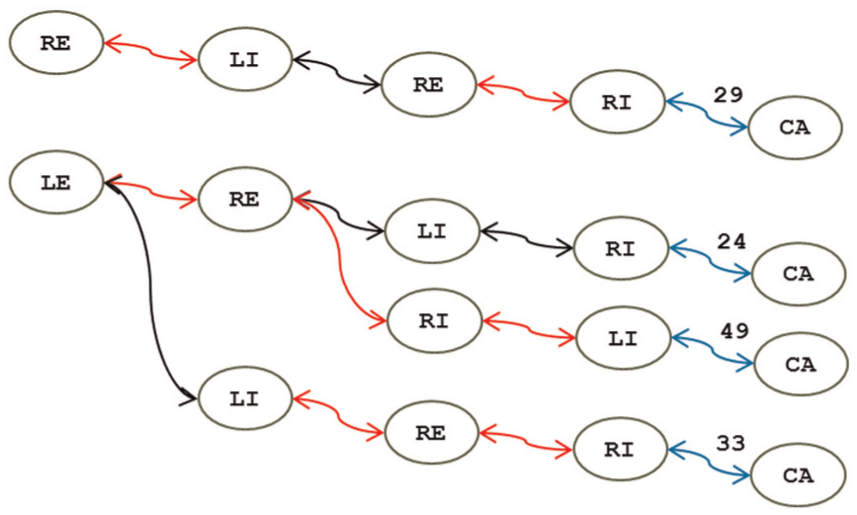
A process miner was used to track the reverse trajectory of a movement sequence that resulted in the most sales in order to determine the tendencies produced by movement patterns. To achieve this goal, we assumed a sequence for each section in which all customers entered the store through the RE section before the rearrangement. The sequence started from RE and flowed in stages. Before the rearrangement, there were up to 11 stages in the sequence, with the fourth stage having the most sales. As shown in Figures 2 and 3, each traffic sequence ended when the customer left the store after a sale (CA) or when they left the store without a sale (OT). If not, the sequence would continue onto a lower stage.
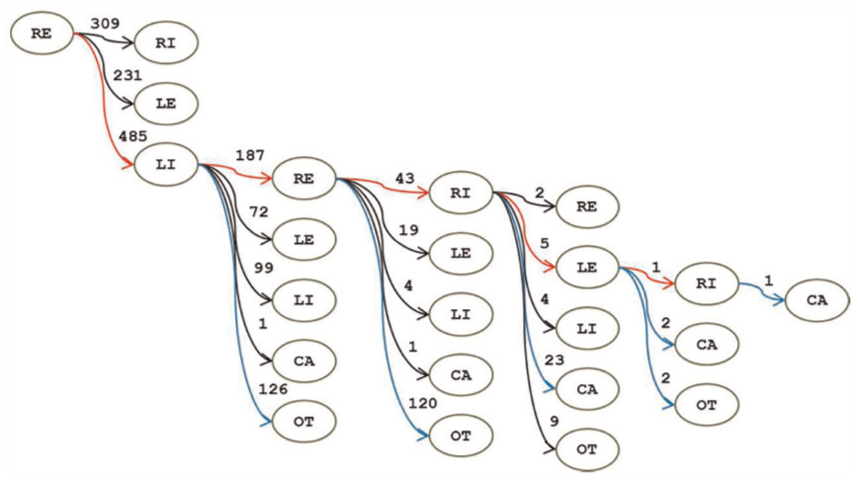
Process miner map: before the rearrangement event (Round 1).
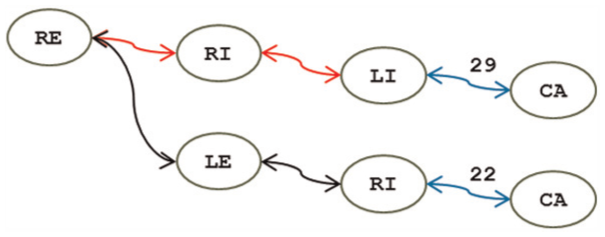
Highest sales generating pattern: before the rearrangement event.
All customers entered the store through RE. The most common sequence, with the highest number of people (485), was to move to LI; the red path in the process miner map shows this route. In the sequence describing the next lower stage, only one person made a purchase and then immediately exited, while 126 people exited the store without showing any purchase behavior. The remaining customers navigated toward the third stage again, and the majority (43 people) navigated to RI. It is evident that before the rearrangement, most sales occurred during the fourth stage, and we therefore analyzed the stream of the reversed route. Figure 3 shows the sequence with the highest sales to traffic ratio before the rearrangement, which was RE to RI, that is, the women’s section.
Results after store layout arrangement (Round 2)
Based on the results we obtained from the analysis in Round 1, we rearranged the store layout by opening an LE path, that is, to the men’s casual or men’s accessories section that had a high sales ratio despite having a lower traffic index of support and confidence. Furthermore, we moved the mannequins and the displays in the LE path for path rearrangement and the store underwent construction for 3 days starting on 18 November 2015 to achieve the objective of increasing store sales. We then observed changes in customer movement patterns for 9 months (Round 2). We examined sales by movement sequences after rearrangement and calculated support and confidence for each sequence using the same method as in Round 1. The results are shown in Table 6, from which we observe an apparent increase in the overall sales ratio of the LE path.
Sales breakdowns by route after the rearrangement event.

The Process Miner was used to track the reverse trajectory of the sequence with the highest sales in order to identify meaningful tendencies in the movement sequence. In this case, there were up to 12 stages, with the fifth stage having the most sales; this was one stage lower than prior to rearrangement.
As shown in Figure 4, each movement sequence ended when the customer exited the store after a purchase (CA) or when the customer exited the store after only window shopping (OT). In other cases, the sequence continued to a lower stage. The analysis proves that after rearrangement, the movement sequence of customers who entered through LE was significantly higher.
Highest sales generating movement pattern: after the rearrangement event.
Changes in customer movement patterns (Round 1 vs Round 2)
Figure 5 shows the map created based on support and confidence to represent the customer movement frequency in order to show the difference between customer movement patterns before and after rearrangement. In Round 1, the RE section was the only entrance, which resulted in high traffic in the women’s apparel section. While women’s classics at RI (Women 1) and women’s casual at RE (Women 2) had the highest traffic, there was almost no traffic toward men’s clothing, especially men’s casual at LE (Men 2).

Changes in customer movement patterns (Round 1 vs Round 2).
Based on this, in Round 2, we decided to open the LE section as an additional entrance to the store. We then observed changes in customer movement patterns after the rearrangement event for approximately 9 months (Round 2) using the same method. It is evident that a new pattern developed around LE, as shown in Figure 5, in which the support and confidence, corresponding to how frequently customers moved to a given section, are represented by the thickness of each route. Changes in traffic share are also evident, as shown in Figure 6.

Changes in customer traffic composition (Round 1 vs Round 2).
In conclusion, we rearranged the store layout by identifying a movement pattern with a high unit sales ratio despite having lower support and confidence values. In other words, prior to store layout rearrangement, movements between men’s apparel sections were limited and were distributed unevenly. Thus, an optimization plan was devised to allow a balanced distribution of customer movements between sections. Unlike RE and RI, which had extremely high support and confidence values before the rearrangement event while having lower unit sales, LE showed low support and confidence values before store layout rearrangement. However, the opening of LE as an additional entrance resulted in a remarkable increase in sales for the men’s section, as shown in Figure 7.
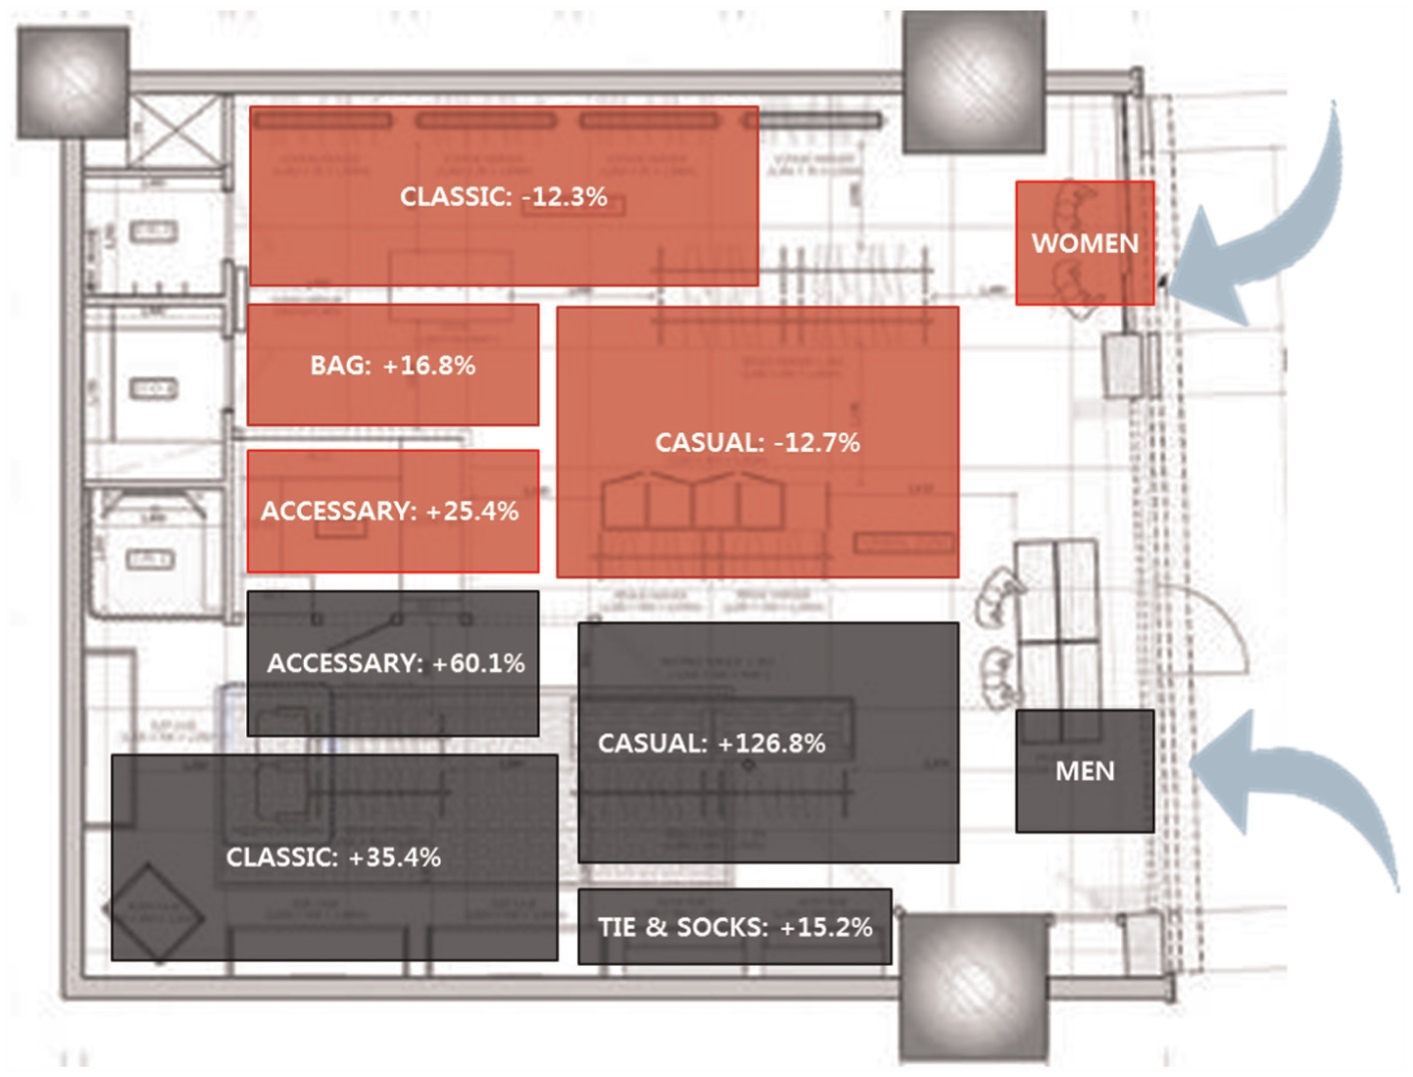
Sales breakdowns.
Conclusion
IPSs have attracted considerable attention from both researchers and business practitioners as a marketing technique that can be used to design store layouts that increase shopper traffic, average transaction values, and profitability. Acknowledging the importance of IPSs in store layout optimization, we conducted a field experiment for 11 months and then identified algorithms that connected indoor positioning data with customer transaction data. We also compared positioning and transaction data before and after a critical store layout optimization decision in order to identify customer movement patterns that generated the highest sales.
Our findings are meaningful from a theoretical perspective in that they integrate computing and marketing perspectives, which enhances previous work on IPSs that focused solely on developing algorithms or techniques to increase the accuracy rate. Unlike the existing research, this study examined the processes in which customer positioning can be linked with transaction data, thereby analyzing the relationship between customer movement patterns and sales.
From a practical perspective, our findings can be used for store layout optimization and personalized marketing. Increased interaction with customers and analytical insights into their behavior patterns, such as movement patterns, will help retailers optimize their strategies and increase returns on investment. Furthermore, using an IPS can help retailers in developing real-time personalized offers and allocating in-store staff members more efficiently. From a consumer’s perspective, an IPS can inform them about the shortest routes needed to fulfill their shopping lists and can help them discover products in addition to shops and facilities in a mall. This work can therefore serve as a guideline for the development of a diversity of practical applications of IPSs in the future.
Footnotes
Academic Editor: Seong-eun Yoo
Declaration of conflicting interests
The author(s) declared no potential conflicts of interest with respect to the research, authorship, and/or publication of this article.
Funding
The author(s) received no financial support for the research, authorship, and/or publication of this article.