
Abstract
Anomaly detection is an important challenge in wireless sensor networks for some applications, which require efficient, accurate, and timely data analysis to facilitate critical decision making and situation awareness. Support vector data description is well applied to anomaly detection using a very attractive kernel method. However, it has a high computational complexity since the standard version of support vector data description needs to solve quadratic programming problem. In this article, an improved method on the basis of support vector data description is proposed, which reduces the computational complexity and is used for anomaly detection in energy-constraint wireless sensor networks. The main idea is to improve the computational complexity from the training stage and the decision-making stage. First, the strategy of training sample reduction is used to cut back the number of samples and then the sequential minimal optimization algorithm based on the second-order approximation is implemented on the sample set to achieve the goal of reducing the training time. Second, through the analysis of the decision function, the pre-image in the original space corresponding to the center of hyper-sphere in kernel feature space can be obtained. The decision complexity is reduced from O(l) to O(1) using the pre-image. Eventually, the experimental results on several benchmark datasets and real wireless sensor networks datasets demonstrate that the proposed method can not only guarantee detection accuracy but also reduce time complexity.
Keywords
Introduction
Wireless sensor networks (WSNs) are composed of a large number of distributed autonomous sensors, which monitor the environmental conditions, such as temperature, humidity, sound, vibration, pressure, motion, and pollutants. 1 WSNs have been extensively applied to many different fields, such as smart city, 2 smart grid, battlefield reconnaissance, environmental monitoring,3,4 medical sensing, 5 traffic control, and other industrial applications. Due to the characteristics of WSNs, a sensor node is vulnerable to anomaly by some resource constraints, including energy, memory, bandwidth, computing capability, and transmission channel. Anomaly may be caused by not only faulty sensor node but also security threats in the network or unusual phenomena in the monitoring scope. Therefore, it is very important that the anomaly of sensor node is detected in order to obtain accurate information and make effective decisions by information gatherers.
Anomaly detection techniques from the aspect of data analysis could be categorized as 1 rule-based methods, statistical techniques, machine learning, and data mining approaches.6–8 Among them, classification method is an important and systematic approach in the data mining and machine learning domains. It needs to acquire a classification model using a kind of samples and classify a new incoming sample into one of the class. Abnormal data, as a general rule, are difficult to obtain compared with the normal data. Thus, anomaly detection belongs to one-class classification problems. This method obtains a model by learning the normal samples and then uses the model to detect any abnormal sample difference from normality.
Recently, there have been growing interests in applying machine learning and data mining approaches for anomaly detection in WSN.9–14 Anomaly detection based on data analysis in WSNs has been surveyed by O’Reilly et al. 15 An efficient algorithm is presented in Moshtaghi et al., 11 which is a novel adaptive model for anomaly detection in a decentralized manner. This method mainly achieves the lower communication burden of WSNs and the higher detection precision. A distributed approach to outlier detection is performed in a principal component analysis (PCA)–based technique proposed by M Ahmadi Livani et al. 16 The scheme reduces communication complexity and achieves comparable accuracy in WSNs. Two outlier detection techniques based on distributed and online are presented in Zhang et al. 17 These techniques are achieved using a hyper-ellipsoidal one-class support vector machine (SVM) combined with the spatiotemporal correlation between sensor data. The objective of all above schemes is to improve detection accuracy and reduce false alarm. A robust and scalable mechanism is proposed in Kumarage et al., 18 which can accurately and efficiently detect malicious anomalies in industrial WSNs, and achieves high detection accuracy and less communication overheads. In general, these literatures present anomaly detection methods in WSNs, which mainly consider detection accuracy and communication complexity of the algorithm. However, the computational complexity of the algorithm is less taken into account. In this article, a new method of anomaly detection is proposed in view of the computational complexity and can achieve comparable accuracy and less communication cost.
The support vector data description (SVDD)
19
is perhaps one of the most well-known one-class classification techniques for anomaly detection, and it has attracted extensive interests.
20
Given a target datasets, SVDD is to find a minimum hyper-sphere such that all or most normal data samples are enclosed into the hyper-sphere. The hyper-sphere boundary is the decision boundary, which is used to identify outliers different from the target data. By introducing kernel function, the nonlinear data in the original can be mapped into a high-dimensional feature space to achieve linear separable. SVDD can get a more flexible boundary to adapt irregularly shaped target datasets, which is able to be effectively applied to the field of anomaly detection.21–24 However, in the training phase, SVDD is required to solve the quadratic programming problem with the strength of calculation and obtain the decision boundary of target data. If the number of training samples is M, then its computational complexity will be up to
Therefore, our goal is to propose a new SVDD method to reduce computational complexity in the training phase and the testing phase. Meanwhile, this method is applied to anomaly detection of node data in WSNs. First, combined with the strategy of training sample reduction, sequential minimal optimization (SMO) algorithm based on two-order approximation is used to reduce the computational complexity in the training phase. Next, the pre-image, which is corresponding to the center of hyper-sphere in kernel feature space, can be acquired in the original feature space. A fast decision-making method is presented by the pre-image in the testing phase, so that the complexity of decision making in SVDD for a single sample is reduced from
SVDD
The basic idea of SVDD classifier19,25,26 is to find the minimum hyper-sphere containing all possible target data in the feature space. Given a set of training data

where R and a are the radius and center of the hyper-sphere, respectively, in the feature space;
In SVDD, the normal class is mapped from the input space into a feature space via a mapping function

where

where K satisfies the Mercer theorem and

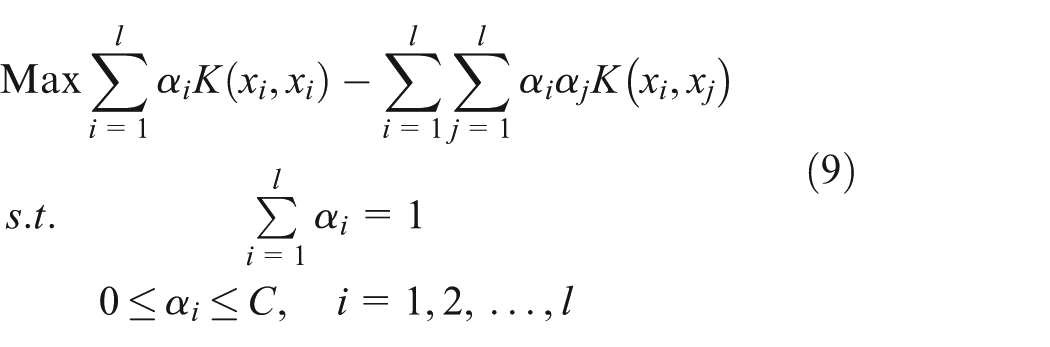
In order to solve the optimization problem of equation (4) with these constraints, Lagrangian function is constructed as follows

where the Lagrange multipliers are


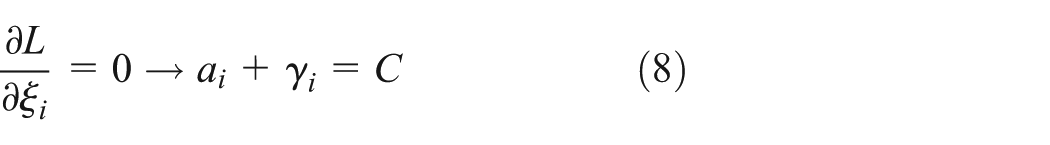
Equation (8) shows that
Here, the optimal solution is

The sketch map of SVDD.
Assume

To judge whether a test sample
Proposed method of anomaly detection in WSNs
In WSNs, raw sensor observations often have low accuracy due to the limited energy and harsh deployment environments. This often results in outlying observations and affects the utility of WSNs for reliable decision making and situation awareness. In order to effectively utilize the data of WSNs, it is necessary to have anomaly detection for the sensor observations. An efficient algorithm for outlier detection based on SVDD was proposed in section “SVDD.” However, SVDD has high computational complexity in the training and testing phases. According to this problem, this section proposes a method to reduce computational complexity of SVDD in the training and testing phases. The combination of the strategy of training set reduction and SMO algorithm based on second-order approximation is used to improve training speed. Meanwhile, a fast decision approach for an unseen sample is proposed in the testing phase, so as to accelerate testing speed.
Training set reduction strategy
For the dual problem (9), its solution has characteristic of sparse. That is, the decision boundary is obtained from the minimum hyper-sphere, which is composed of a fraction of SVs. A large number of sample points close to the center of the hyper-sphere do not contribute to the determination of the sphere, but conventional SVDD learning is performed over the entire training sample. Thus, this process will consume a significant amount of time and memory space. Here, considering the principle of SVDD and the relevant documents,29,30 a kind of evaluation standard for sample based on Euclidean distance is presented in this article. Using the standard to evaluate all samples, the reduced set of training sample is obtained by removing a certain percentage of the sample near the center of all samples. Eventually, hyper-sphere boundary is obtained using the algorithm of the SVDD in the reduced set of training sample.
Given the training sample set

The Euclidean distance in the feature space F is shown in formula (12) between sample points

The distance is shown in equation (13) between the sample

Because the last item is a constant in equation (13),

The greater
Remark 1
In the training phase, the conventional SVDD method needs to spend a large amount of time training NSVs of the training sample set. Thus, it is necessary to cut down the number of NSVs. Due to NSVs generally located near the center of sample set, a reduction strategy based on Euclidean distance is proposed. The strategy is implemented by removing a certain proportion of samples near the center of the training sample set.
SMO algorithm based on the second-order approximation
Similar to SVM, in SVDD, the key problem of training SVMs is how to solve quadratic programming (QP) optimization problem. Due to its immense size, the QP problem (9) that arises from SVs cannot be easily solved by standard QP techniques. SMO was presented by Platt, 31 which is an extreme case of the decomposition algorithm where the size of working set is restricted to two elements. In each iteration, it does not require any optimization software in order to solve a simple two-variable problem. The SMO algorithm is mainly to solve two problems. One is to optimize the Lagrange multiplier of violating Karush–Kuhn–Tucker (KKT) conditions and meet the KKT conditions. The other is the problem of working set selection, which is the decision of the first to optimize the Lagrange multiplier. Certainly, working set selection is a key step in the convergence rate of SMO algorithm. There have been many literature studies on this work. Existing methods mainly rely on the violation of the optimality condition, which also corresponds to first-order information of the objective function. Fan et al. 32 proposed a simple working set selection using second-order approximation, which further improves the convergence rate of SMO algorithm. According to this idea, the SMO algorithm of the SVDD is derived using second-order approximation.
Remark 2
SVDD algorithm needs to solve QP optimization problem, which has high computational complexity. Thus, the SMO algorithm based on second-order approximation is proposed to improve the computational complexity of the QP problem.
Stop criterion
According to the optimization principle, when
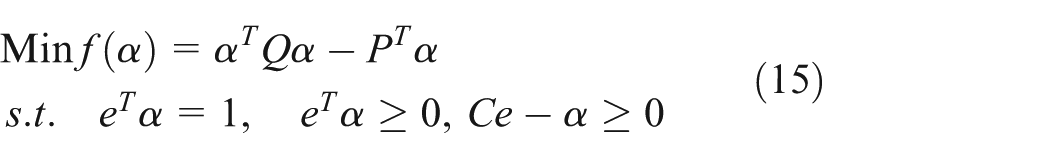
where Q is

where
For any

It is defined that the index set are
Remark 3
In consequence, the iteration termination conditions are
Work set selection strategy based on the second-order approximation
The feasible direction is defined as

Since


where
Remark 4
Hence, based on the second-order approximation, the working set selection strategy is as follows:
Get
Get
Return
where k indicates the number of iterations,
Optimization of two Lagrange multipliers
Let
Remark 5
The feasible region of
Remark 6
The values of
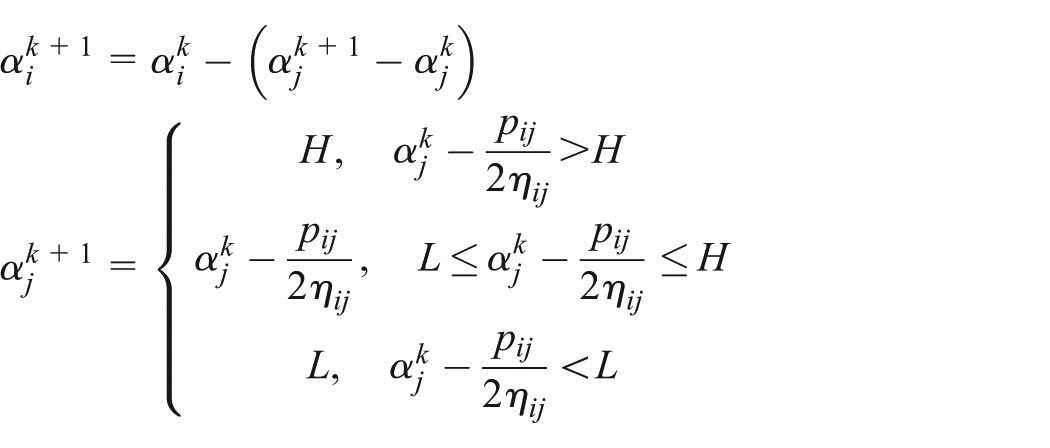
where
Therefore, the optimal solution
Given the unknown sample of
When given a kernel function, such as the Gauss function
where

Obviously,
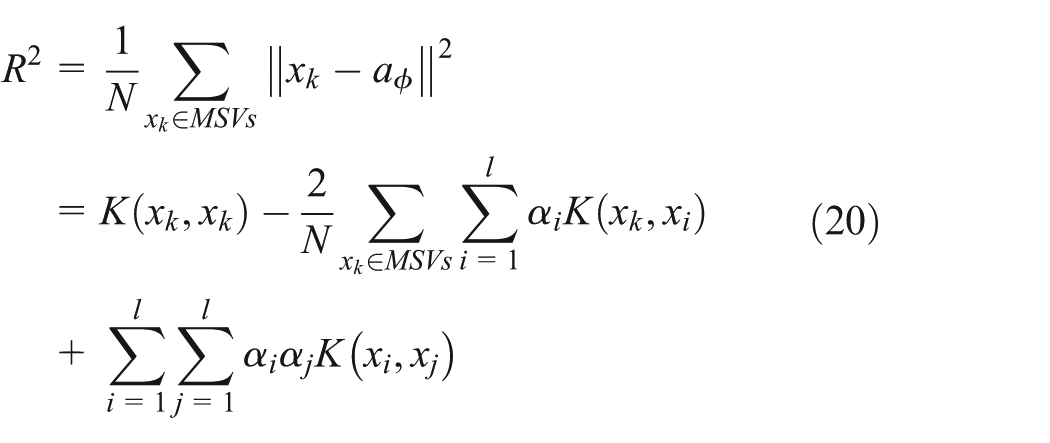
SVDD decision approach
By observing the decision function of formula (21), if the pre-image of

where
From equation (24), it can be seen that the computational complexity of
The following sections describe how to obtain the pre-image. It is well known that a point in space can be represented approximately as the linear combination of its neighbors, for example, locally linear embedding.33,34 Hence, there is

How to select the weight vector

From the formula, we can easily show that the lower bound for the smallest value of

Since the last item in formula (27) is independent of

It is obvious that formula (28) is a QP problem. The direct method is used to solve the QP problem. That is, the partial derivative is obtained with respect to

Obviously, the weight vector is calculated by equation (29), which can effectively obtain the pre-image a. Thus, the pre-image a can be replaced by equation (24), so that the computational complexity of the decision for the unknown sample is reduced to O(1).
Remark 7
By analyzing the decision function of formula (24), and using formula (29) to obtain pre-image of the center of hyper-sphere, the aim is to reduce the computational complexity from O(|SVs|) to O(1) in the decision-making process of the SVDD algorithm.
New SVDD implementation process:
Training phase: Step 1: initialize the kernel width parameter and the error penalty parameter C of SVDD; Step 2: solve the QP problem using the SMO algorithm based on the second-order approximation in this article; Step 3: compute the radius R by equation (20); Step 4: compute the weight vector Step 5: estimate the pre-image
Decision phase: Step 6: for an unknown sample, classify it according to equation (24).
Experimental results
This article analyzes and compares the experimental results which are mainly reflected in the following three algorithms: the proposed new SVDD, SMO2-SVDD, and the traditional SVDD. SMO2-SVDD is an algorithm to improve the training speed by adding the strategy described above on the basis of SVDD. First, experimental parameter setting and performance evaluation metrics are presented in the following sections. Experimental results on the UCI datasets 36 are given in view of the three algorithms. Meanwhile, three kinds of algorithms are applied to anomaly detection of the node data in WSNs and are compared and analyzed. All algorithms are implemented in MATLAB 2013a on Windows 7 running on a PC.
On UCI datasets
The results about these algorithms running on publicly available UCI datasets are analyzed, which are widely used in the test of machine learning algorithms and recorded in Table 1. The first column and the second column in this table, respectively, represent name and dimension of datasets. The corresponding target classes are shown in the third column, and the number of samples in every target class is indicated in the fourth column. It can be seen from Table 1 that spambase (SB), waveform (WF), and Landsat satellite (LS) are relatively larger than others. Here, this is intended to select the purpose of these datasets which conform to the feature of large data in WSNs.
Datasets used in the experiments.

For all experiments, the Gaussian kernel is applied in the process of simulation, and the cross-validation strategy is employed. The Gaussian kernel parameter h and the error penalty parameter C are, respectively, selected from the grid of
In order to make a comparative analysis reasonably, UCI datasets are used, and the research of algorithm mainly relates to three aspects of performance indicators, which are average accuracy, training time, and testing time. New SVDD, SMO2-SVDD, and SVDD are, respectively, run 10 times with the same training sample, testing sample, and parameters. Eventually, the mean and the standard deviation of running 10 times are the result of evaluation. In view of the imbalanced training datasets,37,38 the geometric mean (g-mean) metric is employed in evaluating the accuracy performance of our algorithms

where

In this section, by choosing appropriate parameters from the given grids, the accuracy of the three algorithms is described and compared. Table 2 lists the average g-means and the standard deviation with the 10-fold cross-validation method on these datasets. As shown in Table 2, the average g-means of the proposed new SVDD is slightly lower than the normal SVDD because our proposed method improves the training time. However, the gap between them is very small. The proposed new SVDD may be compared with the other algorithms on a majority of datasets.
Average g-means (%) and the standard deviation (%).

SVDD: support vector data description.
The results shown in Table 3 indicate that the training and testing central processing unit (CPU) time of new SVDD compares favorably to the other algorithms. It usually achieves the best performance among all the methods. The results show that the training time of SVDD is slightly longer than that of new SVDD and SMO2-SVDD on these datasets. This is because the latter two methods use second-order approximation on working set selection to train target samples. Meanwhile, the results indicate that the proposed method of new SVDD obtains an extremely fast testing speed than SMO2-SVDD and SVDD. Obviously, this typical result originates from the fact that our methods here can cut down the decision complexity of SVDD from O(|SVs|) to O(1).
Average training time and testing time on the datasets (s).

SVDD: support vector data description.
On IBRL datasets
In this experiment, the proposed new SVDD is evaluated with real IBRL datasets in WSNs. The IBRL datasets contain information collected from 54 sensors deployed in the IBRL, between 28 February and 5 April 2004. Mica2Dot sensors with weatherboards collected time-stamped topology information, along with humidity, temperature, light, and voltage values once every 31 s. The data were collected using the TinyDB in-network query processing system, built on the TinyOS platform.
39
The sensors were arranged in the lab, according to the diagram shown in Figure 2. Let us first consider a small sensor sub-network, which can be easily extended to a cluster-based or a hierarchal network topology. This sub-network consists of densely deployed n sensor nodes

Sensor node location in the IBRL deployment.
Robustness analysis
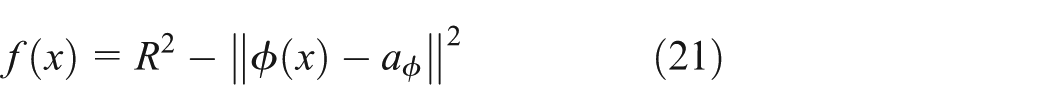
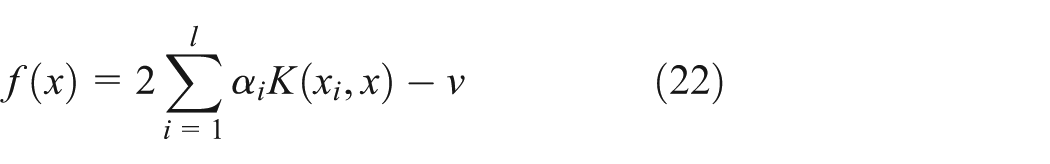
In this section, the robustness of the three algorithms to Gaussian kernel parameter h and the error penalty parameter C is researched in WSNs. In this experiment, the datasets of node 33 with 18 h were adopted, in which 80% of the data obtained randomly from the datasets are selected as target class, and the remaining 20% of the data together with the generated of artificial data accounted for 30% of the datasets are used for testing. Here, the artificial data randomly generated the abnormal values different from the node data. The value of the error penalty parameter C is set to be 0.1 when the influence of the kernel parameter h on the g-mean accuracy is studied. The experimental results are shown in Figure 3. Similarly, the value of the kernel parameter h is set to be

Robustness performance to parameter h.
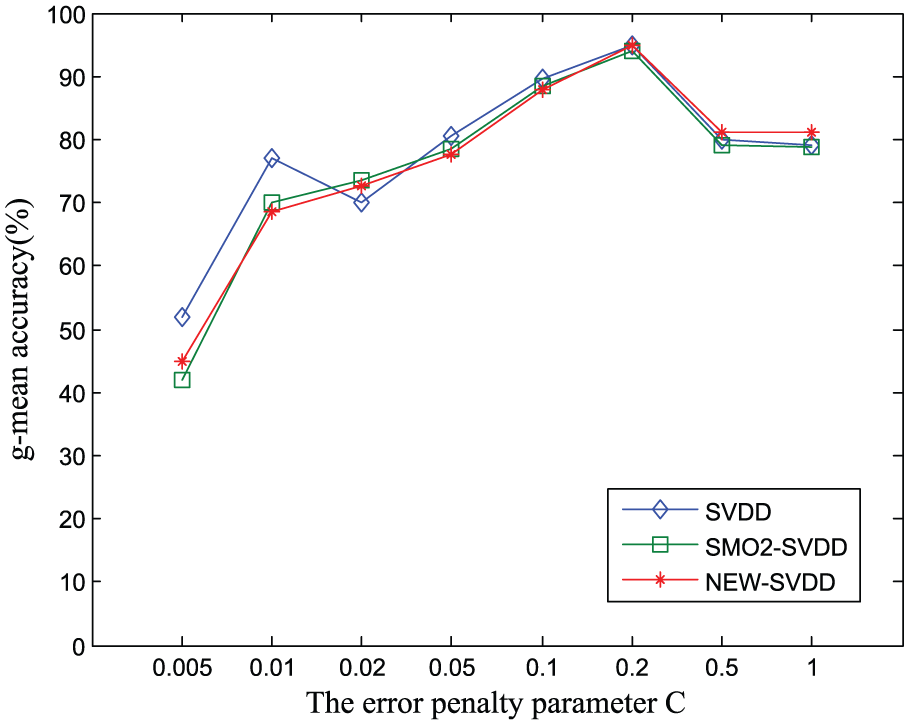
Robustness performance to parameter C.
Accuracy analysis
In this section, the performance of WSNs is demonstrated on the g-mean accuracy of the three methods where appropriate kernel parameter h and the error penalty parameter C have been searched from the given grids. In each run of experiment, 80% of the data obtained randomly from each node are used for training, and the remaining 20% of the data together with the generated artificial outliers are used for testing. The generated artificial outliers are 30% of the node data. The experiment was repeated 10 times, and the average of g-mean accuracy is listed in Figure 5. It can be seen from Figure 5 that the proposed new SVDD may be compared with SVDD on the datasets of node. Moreover, with the increasing amount of sample in the datasets, new SVDD improves the g-mean accuracy of anomaly detection. This result demonstrates that new SVDD can give quite good detection performance for large amount of data in WSNs.

Average g-means (%) on the node.
On the labeled WSN datasets
In this experiment, the proposed new SVDD is evaluated on the labeled WSN datasets. 40 The datasets consist of humidity and temperature measurements collected during 6-h period at intervals of 5 s. Single-hop data are collected on 9 May 2010, and the multi-hop data are collected on 10 July 2010. Label “0” denotes normal data and label “1” denotes an introduced event or outlier. Similarly, this article utilized a portion of the data from the labeled WSN datasets in our evaluation, namely, single-hop data of nodes 1 and 4, as well as multi-hop data of nodes 1 and 3. In the evaluation, the used single-hop data of node 1 (SH1) consist of 115 abnormal data with label “1” and 3200 normal data with label “0.” The used single-hop data of node 4 (SH4) consist of 30 abnormal data with label “1” and 1200 normal data with label “0.” The used multi-hop data of node 1 (MH1) consist of 50 abnormal data with label “1” and 1800 normal data with label “0.” The used multi-hop data of node 3 (MH3) consist of 100 abnormal data with label “1” and 3000 normal data with label “0.”
Robustness analysis
In this section, the robustness of the three algorithms to Gaussian kernel parameter h and the error penalty parameter C is researched in the labeled WSNs. In this experiment, the datasets of SH1 were adopted, in which 80% of the normal data obtained randomly from the datasets are selected as target class, and the remaining 20% of the data together with the abnormal data are used for testing. The values of Gaussian kernel parameter h and the error penalty parameter C are the same as those in the IBRL datasets when the SMO2-SVDD and new SVDD can obtain good performance.
Accuracy analysis
In this section, the performance of WSNs is demonstrated on the g-mean accuracy of the three methods where appropriate kernel parameter h and the error penalty parameter C have been searched from the given grids. In each run of experiment, 80% of the data obtained randomly from each node are used for training, and the remaining 20% of the data together with the abnormal data are used for testing. The experiment was repeated 10 times, and the average of g-mean accuracy is listed in Figure 6. It can be seen from Figure 6 that the proposed new SVDD may be compared with SVDD on the datasets of node. Moreover, with the increasing amount of sample in the datasets, new SVDD improves the g-mean accuracy of anomaly detection. This result demonstrates that new SVDD can give quite good detection performance for the labeled datasets in WSNs.

Average g-means (%) on the node.
Complexity analysis
In this section, the complexity of the proposed new SVDD is analyzed aiming at the problem of anomaly detection in WSNs and compared with SMO2-SVDD and SVDD. Since SMO2-SVDD improves the training speed on the basis of SVDD, the training time of the target sample is reduced. New SVDD applies the method for obtaining pre-image to improve the testing speed on the basis of SMO2-SVDD, so the testing time of an individual sample is reduced from
Average training time and testing time on the IBRL datasets (in second).

SVDD: support vector data description.
Average training time and testing time on the labeled WSN datasets (in second).
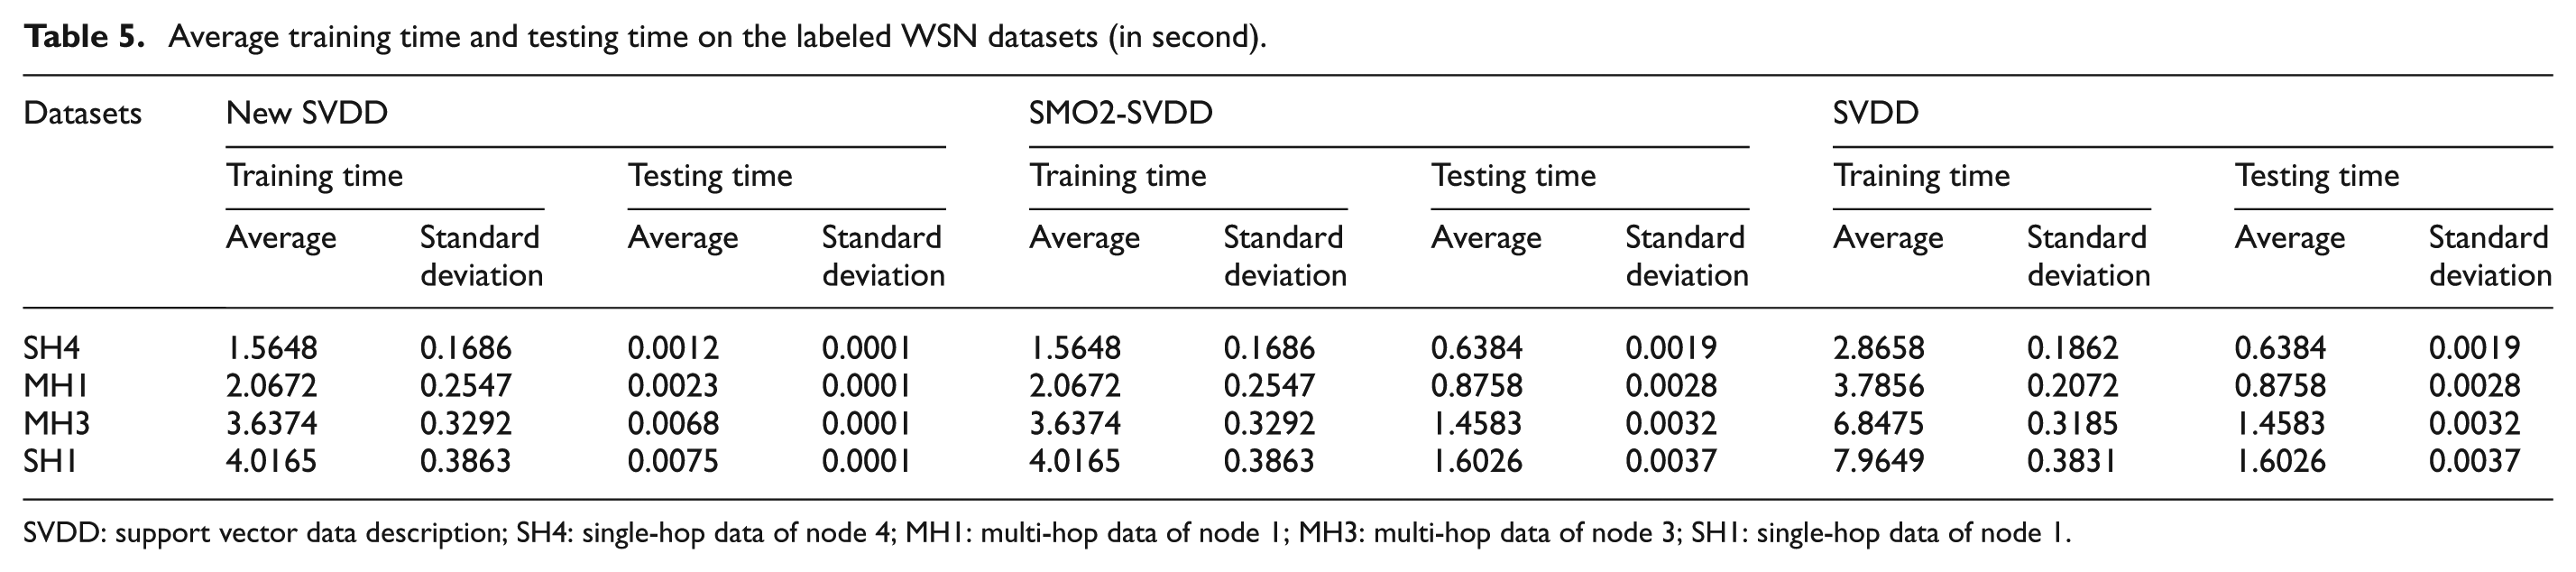
SVDD: support vector data description; SH4: single-hop data of node 4; MH1: multi-hop data of node 1; MH3: multi-hop data of node 3; SH1: single-hop data of node 1.
Conclusion
Anomaly detection on data is challenging and demanding issue in WSNs, due to its increase diverse applications such as fault detection, incident or intrusion detection. This article has presented a new method of SVDD for anomaly detection of large data in WSNs. This method mainly solves two aspects of the traditional SVDD method. The first aspect is QP problem in the training phase which involves highly complicated calculations. In order to reduce the training complexity, the SMO algorithm based on the second-order approximation is adopted. The second aspect is testing complexity for anomaly detection. A pre-image finding approach based on ISE criterion is proposed to reduce the complexity of decision making. Finally, using UCI datasets and IBRL datasets of WSNs, the three algorithms, namely, new SVDD, SMO2-SVDD, and SVDD, are compared in terms of performance. Experimental results show that the proposed new SVDD method can reduce the computational complexity compared with SMO2-SVDD and SVDD method and maintain similar accuracy performance of detection.
In this article, the Gaussian kernel is only addressed, and other kernels such as the dot product kernels will be developed in the corresponding fast SVDD algorithms in the future. Meanwhile, the proposed method needs to be further improved in terms of detection accuracy.
Footnotes
Academic Editor: José Molina
Declaration of conflicting interests
The author(s) declared no potential conflicts of interest with respect to the research, authorship, and/or publication of this article.
Funding
The author(s) disclosed receipt of the following financial support for the research, authorship, and/or publication of this article: This work is supported by the project of the Department of Science and Technology in Hebei Province (15214519).