
Abstract
The uniform geometrical theory of diffraction and ray tracing technique is used to simulate ultra wideband signal multipath propagation characteristics. The simulation model covers indoor office and outdoor corridor with thick wall and metal doors. The range of path loss exponent of distance is obtained by regression analysis, and the lognormal distribution about shadowing fading is got by the fitting and test. The distance-dependence path loss in the indoor and indoor to the corridor present lognormal distribution characteristics. Through the comparative research, the signal of the transmission metal door has a decisive influence on the corridor environment.
Introduction
In the recent years, plentiful scenarios channel were measured using different measurement methods because of the limitations of ultra wideband (UWB) channel standard model IEEE802.15.3a and IEEE802.15.4a. These scenes included indoor office, indoor residential, indoor parking area, human body, and factory. The research on the propagation loss of UWB signal is mainly focused on the measurement method. S Sangodoyin and S Niranjayan 1 used the multiple input multiple output (MIMO) technique to measure the characteristics of the outdoor near-ground and found out that the path loss showed a slight dependence on frequency. CU Bas and S Ergen 2 constructed the propagation channel model of intra-vehicular wireless sensor networks. Deterministic modeling methods such as ray tracing method and finite difference time domain (FDTD) method are gradually applied in the channel measurement. S Priebe et al. 3 used the frequency domain ray tracing approach to simulate the THz indoor propagation channel and validated the correctness of the results with the measurement data. FJB Barros et al. 4 built a site-specific beam tracing model to describe indoor radio propagation channel of UWB. These studies show that the path loss of distance-dependent large-scale fading is in accord with the lognormal distribution. However, there are few researches on the large-scale channel characteristics that signal transmit thick wall and the metal door to the corridor environment. This article is based on the ray tracing and uniform geometrical theory of diffraction (UTD) to simulate model in complex environments, analyzes path loss exponents and shadow fading characteristics for indoor and indoor to corridor with thick wall and metal door environments.
Simulation environment
This article selected the office and outdoor corridor for simulation environment as shown in Figure 1. Specific objects include nine office tables, nine computers, two double-metal doors, three single-metal doors, two file cabinets, a laboratory furniture, a material cabinet, a wooden locker, a vertical air conditioning, and a water dispenser. The 0.4-m-thick brick wall is bushed with gypsum powder. The material of floor, corridor, and ceiling, respectively, are wooden, ceramic tile, and aluminum. Some material properties are shown in Table 1.

Ichnography of office and corridor environment.
Properties of part materials.

The simulation model is accomplished by Wireless Insite and AutoCAD. The transmitter (Tx) is located in the center of the office (4, 3.1, and 1.2 m) with radiant power 10 dBm. The waveform is Gaussian pulse at bandwidth of 2 GHz with center frequency of 7.3 GHz. There are seven receiver routes that range from A to G at the height of 0.9 m and the interval of 0.2 m, two receiver sets RxA and RxB to detect the power distribution in the whole space. The rays number of refraction, transmission, and diffraction are set to 4, 5, and 1, because the number of secondary reflection and transmission are no longer increase with the increasing setting of rays. Shooting and bouncing ray (SBR) method is used in the simulation. Figure 2 shows the final simulation model.

Simulation model.
Path loss in simulation environment
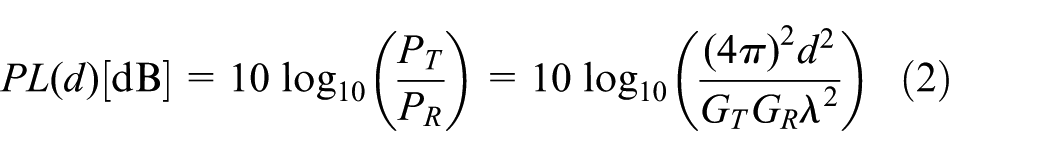
The pass loss depends on frequency and distance between the transmitter and receiver in a UWB channel, and according to the literature,1,5,6 the formula is as follows

Here, the distance-dependence path loss is emphatically studied.
Under ideal circumstances, the dependence of the path loss on distance in free space is 7
where

The equation of logarithmic is
where
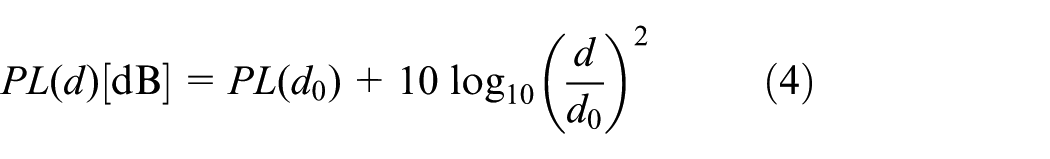
However, in the actual complex environment of wireless communication, receiving signals with attenuation features are superposition of multipath signal with transmission, diffraction, and reflection, which are different from the single channel of free space to arrive. According to the theory of propagation model and measurement-based model, when the receiving distance increases, the average power of the received signal is exponentially decreasing. In the multipath environment, equation (4) can be rewritten as 8

where n is the path-loss exponent, and
However, whether the path loss of the office scene and indoor to corridor in software simulation model obeys the lognormal distribution or not still needs further validation.
Path loss of indoor environment
The distribution of space power received from the RxA of interior sets is shown in Figure 3.
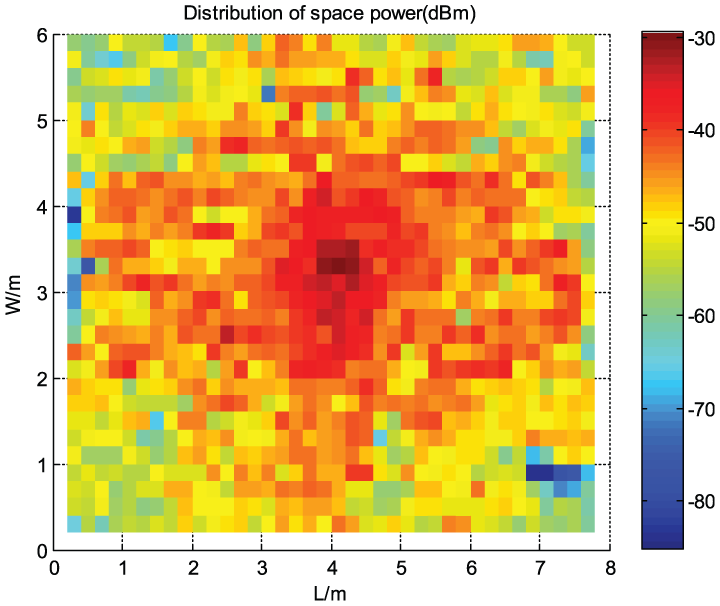
Space power of indoor.
The radiation power fluctuation is stable around the Tx, but there is obvious attenuation in the four corners. Set the six routes, except Route D, to detect the path loss principle. Among those routes, Route A and C extend to the corridor from the transmitter, and Route B, E, and F extend to the corner.
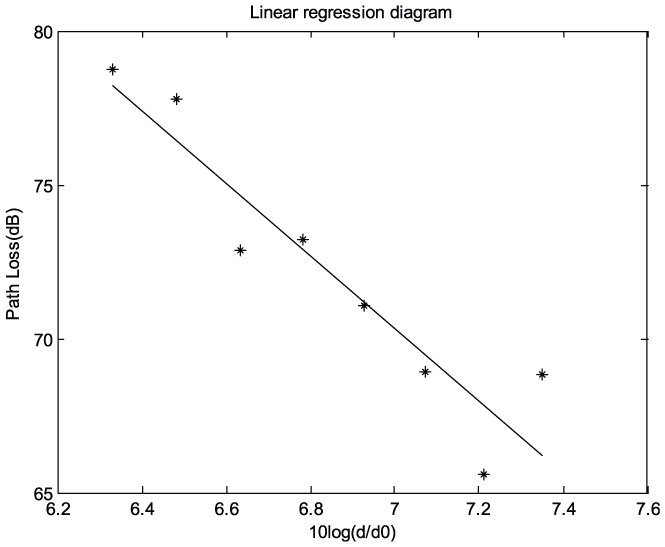
The loss data receiving from Route F are shown in Figure 4 as a scatter diagram. In order to get the value of

where

Linear regression fitting.
Regression significance test
The regression significance test is used to determine a significance regression equation. When the hypothesis


where SSR is regression sum of squares, SSE is residual sum of squares,
Analysis of regression and significance test.

As can be seen from the table, the path loss exponent n is less than 2 in the region that the office furniture cause severe multipath components overlap in line of sight (LOS) scene or quasi-LOS, but greater than 2 in non-line-of-sight (NLOS) paths of obvious barriers or LOS paths of less furniture. In the literature 11 that uses measurement method, n is 1.76 in LOS office environment and 3.07 in NLOS environment. In another measurement method, 12 n is 1.3 in LOS office environment and 2.3 in NLOS environment. According to the comparison, the results of simulation method are close to the measuring method in office environment. This suggests that the attenuation rate of signal with reflection and refraction is less than free space in LOS or quasi-LOS, but the signal after transmission in Hard-NLOS or remote environment fade rapidly.
Path loss of indoor to corridor environment
The distribution of space power received from the RxB sets of corridor is shown in Figure 5. The signal that transmitted by the metal door is reflected by the wall near where forms a regional strong power. Route D is set to detect the path loss principle in the central corridor. The strongest received signal is detected at the length of 7.8 m, so record data of 0–7.8 m as D_l, 7.8–15 m data of as D_r. Most of the strength of multipath components is blocked by walls, but the transmission of walls and metal doors superimposed on each other and coupled with different sides of the environment result in different power loss of the left and right. The comparison diagram of regression analysis with the two sets is obtained as Figure 6. The parameter estimation results are respectively
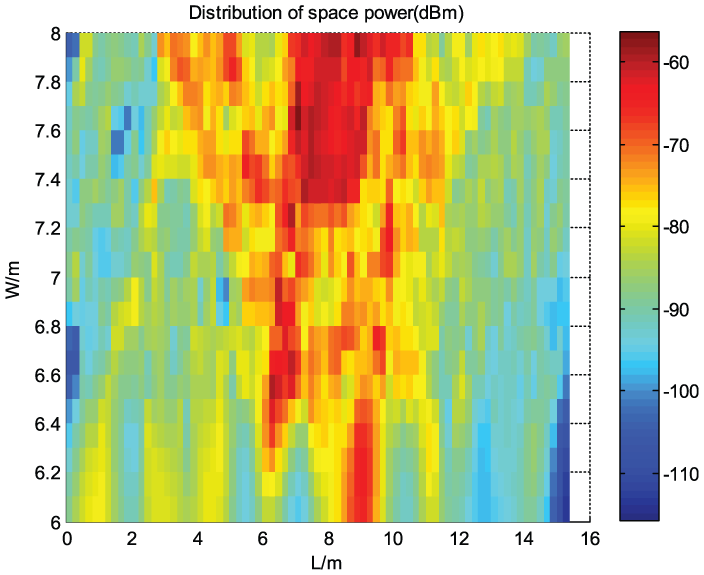
Space power of corridor.

Comparison of regression analysis.
The analysis of the data for Route A in the corridor shows that the loss is reduced and present a highly significant linear characteristic with the distance increasing between transmitter and receiver, the results is shown in Figure 7, and get the intercept and slope are 153 dB and −11.8, respectively. The same rule is suitable for Route C, and these results well explain the reason of the phenomenon of Figure 5.
Data of Route A in corridor.
All these indicate that the path loss of indoor to corridor is piecewise characteristic, which can be expressed as

where d is the distance between transmitter and receiver outside the door, and
The above discussion is attenuation rule of the UWB signal that transmit metal door to the corridor. Next, the direct relation of distance-dependence path loss between transmitter and receivers is discussed. The distance between the indoor transmitter Tx and the corridor receiver is

where

Regression analysis based on receiver and transmitter distance.
Shadow fading
Shadow fading indicates the differentials between the actual path loss and the value of the linear regression. Rigorous statistical method to determine the distribution of shadow fading of

the maximum likelihood estimate of

The Fisher K. Pearson theorem of the following form is used in test

where
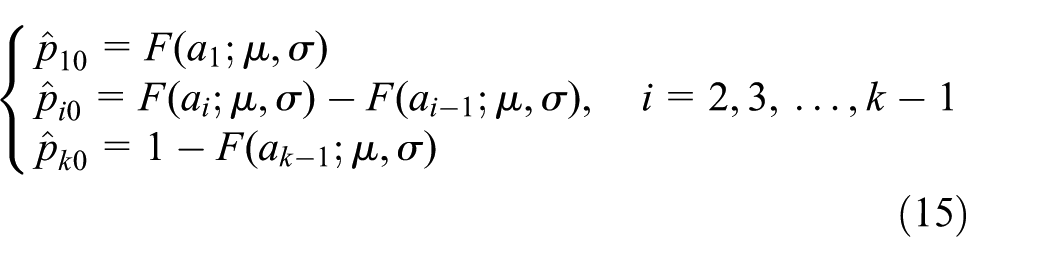
where
Frequency distribution table.


Distribution characteristics.

Conclusion
The path loss of UWB signal indoor obeys the lognormal distribution with the loss exponents ranging from 1.37 to 2.35, and the standard deviation of the shadow fading changing from 4.35 to 6.67. Comparing with other measured method of indoor office, the deterministic modeling method is effective in researching UWB channel. Two methods are used to analyze pass loss that from indoor to corridor with thick wall and metal door, the results shows that pass loss are highly symmetrical on both sides of the metal door and satisfy piecewise lognormal distribution. The central corridor loss exponent is particularly 3.17 and shadow fading standard deviation is 3.77. The signal of the transmission metal door has a decisive influence on the corridor environment.
Footnotes
Academic Editor: Jaime Lloret
Declaration of conflicting interests
The author(s) declared no potential conflicts of interest with respect to the research, authorship, and/or publication of this article.
Funding
The author(s) disclosed receipt of the following financial support for the research, authorship, and/or publication of this article: The authors are very grateful for the support of the National Natural Science Foundation of China (Grant No. U1504604) and Academician Workstation Research Grant Funds.