
Abstract
Honey bees are extremely important creatures to humans that are able to pollinate flowers and produce products such as honey, bee pollen, and royal jelly. Honey is the primary product of beekeeping, and the practice of migratory beekeeping is the most profitable beekeeping method carried out by monitoring the nectar sources. Monitoring these nectar sources provides knowledge about the bloom periods of plant species. Using a wireless sensor network, this study aims to monitor the nectar flow in the region that the migratory beekeepers plan to visit. The wireless sensor network developed was tested in a region with a known nectar flow period from June to July. During the test period, the hive weight and ambient temperature and humidity were constantly measured. The real-time data were available via a website. The nectar flow is determined based on the changes in hive weight and these measurements provide the beekeepers with information about the instantaneous, hourly, and daily nectar flow in the specified region.
Introduction
Honey bee products such as honey, royal jelly, bee wax, bee pollen, bee venom, and propolis hold a special place in the lives of humans. Some of these products are used in the pharmaceutical industry, while some are used as nutrients due to the enzymes they contain. Moreover, some bee products are also used in the cosmetics industry. Therefore, beekeeping has grown into a large industry. 1 Besides this, direct or indirect pollination by insects has important benefits for humans. Around the world, 35% of crop production for human food depends on pollination by insects, 2 and the economic value of pollination by insects around the world amounts to around € 153 billion per annum. Bees are among the most important pollinators. Honey bees are, therefore, estimated to be effective in the pollination of 80% of agricultural crops in Europe. 3
Honey bees are of vital importance, and the nectar-producing plants they use to produce honey vary from one region to another. Given its geographical location, climate conditions, and vegetation, Turkey holds a very convenient position for beekeeping. 4 With the spring months approaching, the bloom period of plants with nectar and pollen production potential starts. The bloom period varies depending on the plant species, time, and altitude. A study conducted in Turkey examined the amounts of pollen and nectar in honey samples of 100 g. Based on these amounts, a classification was developed, resulting in two categories: nectar production and pollen production. Nectar and pollen production potentials were then further classified into four categories: dominant, secondary, minor, and trace. A report was then issued including information about the provinces where the plants with nectar and pollen potential grow as well as their bloom periods. 5 In the report, the potential was labeled as “dominant” in cases where the amount of nectar and pollen available in 100 g honey was equal to or over 45 g. In the same way, it was labeled as “secondary” when the amount available was between 16 and 45 g, and as “minor” when the amount was between 3 and 15 g. The label “trace” was used for nectar and pollen amounts less than 3 g in 100 g honey. Overall, the study showed that there are 300 plants with nectar and pollen potential in Turkey. 6
Having knowledge about the bloom periods of nectar-producing plants is of vital importance for honey production. Thus, knowing the proper time and altitude and choosing the appropriate bee races increases the probability of a season with high honey yields. Migratory beekeeping, which is performed by following the bloom periods, ensures both increased honey yield and a better use of nectar sources. 7 . Essentially, honey yield varies depending on the condition of the hives as well as certain environmental factors. 8
In a honey bee monitoring project, the winter losses of the monitored honey bee colonies were examined. Varroa destructor was found to play the key role in the losses of colonies among all other factors. Rapidly increasing loss rates were also found in the colonies infested with Varroa destructive. 9 In another study that identified six different approaches to the monitoring of honey bees, all approaches from the manual measurement systems to the automatic ones were examined. The study explained how these approaches could be implemented and which communication methods or devices could be used within the scope of each approach. Some of the approaches only used sensors, while others used data processing and storage systems. The beekeeper could then monitor the bees by choosing the method suitable for his or her needs. 10 Furthermore, another study focusing on monitoring the flying patterns of honey bees in and out the hive identified the bees by means of cameras and light sources placed at the hive entrances. Then the images obtained were recognized through processing and classification techniques. In doing so, the nectar collection behaviors of the bees and the volume of nectar they collected were determined. 11 Indeed, the monitoring–data collection processes can be classified into three phases: 12 (1) monitoring at a beehive level (detection of non-human factors such as wild animals by real-time video monitoring of beehives 13 ); (2) monitoring at a colony level (monitoring the factors such as hive temperature, humidity, weight, sound level, vibration signals14–18); and (3) monitoring at a bee level (monitoring the factors such as flying patterns of the bees in and out the hives, their nectar collection behaviors 19 ).
In general, wireless sensor networks (WSNs) are composed of multiple, low-cost sensor nodes coordinated to provide real-time monitoring of physical conditions (temperature, humidity, pressure, speed, light, and noise) in a specific geographical area. 20 One possible WSN communication protocol is Zigbee. Use of this protocol in viticulture allows for the detection of grape ripening and disease potentials as well as the remote handling of vineyards. 21 Therefore, the higher the nitrogen content of the soil, the lower its quality. To monitor cattle health, a Global System for Mobile Communication (GSM)–based WSN was developed, 22 and there is only one study in which these WSNs are used in honey bee monitoring. The study in question was carried out by measuring the air temperature and hive weight at 5-min intervals in 70 different regions of Germany. In addition, the study investigated the effect of the climatic changes on the bees. 9 In a similar study that examined nectar yields, weighing scales were placed under the hives for manual measurement. The measured values show that highland areas have a two to three times higher yield per colony compared with coastal areas. 19 In this study, nectar flow was monitored using WSN, which has not been reported in the literature. Using WSN, ambient temperature, humidity, and beehive weight of the colony were measured continuously. Temperature, humidity, and weight parameters were measured to determine the nectar flow of the bee colony.
Materials and methods
There are 137 nectar- or pollen-producing plant species available in the Dernekpazarı District of Trabzon Province (Figure 1), where the system is deployed.4,6 Some of these plant species are rich in nectar, while some others are rich in pollen. However, some can be rich in both nectar and pollen. Each plant species blooms at different times and grows at different altitudes. Given this, the testing was located at 40° latitude and 40° longitude.

Number of nectar–pollen-producing plant species by month.
The number of nectar–pollen-producing plant species in the testing area is high in the period of May through August (Figure 1). It can also be shown that the number is at the highest level in the period of June through July. The increase in the number of nectar–pollen-producing plant species also means an increase in the sources that can be visited by bees. Thus, nectar- or pollen-rich plant species bloom at different altitudes (Figure 2).

Number of nectar–pollen-producing plant species at several altitude ranges.
The number of nectar–pollen-producing plant species is high at altitudes of 0–1600 m (Figure 2). Hypothetically, it can be assumed that beekeeping activities are performed at altitudes of 0–1600 m. However, the bloom periods of the plant species with dominant nectar–pollen potential and the altitudes at which they grow must also be taken into account, in order to achieve the desired honey production level. Therefore, at this stage, the plant species should be weighted by the nectar–pollen production rates. In a survey administered on experts in the field of beekeeping, the effect of nectar- and pollen-producing plants on honey production was examined. Eleven experts responded to the survey. Four of these were experts in mobile beekeeping, while the others were people with academic expertise on the biology and breeding honey bees. Experts were asked to answer two questions. These questions related to honey production from pollen-bearing plants and the effect of nectar-bearing plants. The survey evaluation was conducted by fuzzy cognitive maps.
The effect of nectar-producing plants on honey production yielded coefficient values of 0.65, while that of pollen-producing plants was 0.35. In fact, the production of honey also affects other parameters. However, this study only took into consideration nectar- and pollen-bearing plants to detect nectar flow. Honey bees directly use nectar for honey production. Therefore, the effect of nectar for honey production was quantitatively large. Pollen has an indirect effect on honey production. Honey bees use the power of pollen in the construction of wax and young bees. Since it is the honey production we take into consideration, nectar and pollen potentials must be estimated separately for each plant species. In equation (1), Ni represents the nectar rate of a nectar-producing plant species i, while Nic represents the coefficient that measures the effect of nectar on honey production. Likewise, Pi represents the pollen rate of a plant species i with pollen potential, while Pic represents the constant that determines the effect of pollen on the overall honey production. Equation (1) estimates the nectar flow coefficient Ny, while calculating the coefficient, other factors were not taken into account

The coefficients in equation (1) are unit-less. A nectar flow chart can be constructed using equation (1) and taking into account the altitude and bloom periods of a specific region (Figure 3). Maximum yield is received during the period of May through July, at altitudes of 600–1200 m. The same altitude and blooming conditions also apply to the chestnut tree which has a dominant potential in the specify region. The overall area of chestnut trees was estimated to be 375 ha. 5

Nectar flow chart.
The Ny coefficient starts from 0 which is shown as blue and rises to the maximum value shown as yellow. Thus, the coefficient is positively related to honey yield, that is, the higher the coefficient, the higher the nectar and pollen flow. However, the value of the coefficient varies by region, and the variance depends on the diversity of nectar–pollen-producing plants and their nectar–pollen yielding capacities.
Additionally, yellow represents the optimum time and altitude in terms of honey yield. If the onset of the seasonal rainfall is timely and the seasonal temperatures are normal, the expected nectar flow will occur. The nectar flow will be observed at altitudes of 600–1200 m and during the 5th and 7th months (Figure 3) of the year. In case of a seasonal lag or excessive precipitation, the nectar flow will be low, resulting in shifts on the time axis of the chart.
Using a WSN, the humidity and temperature of the environment around the hive, as well as the changes in the hive weight, are continuously monitored during the period of nectar flow (Figure 4). Chestnut (Castanea sativa) is the identified plant species with a dominant potential in the study area and blooms in the spring–summer period, where the honey bee colonies will be monitored (Turkey, Trabzon Province, Dernekpazarı District).

Block diagram of the system.
The WSN designed for this monitoring study is composed of two sensor nodes and a coordinator node. Each node uses the ZigBee 802.15.4 communication protocol to communicate with each other, and a Simcard with an Internet data pack is used to transmit the data to the web. The data obtained from the WSN can be monitored in real time via a smart phone or computer.
Each node was created with the name “HoneyBeeEndDevice 1-2.” Furthermore, two measurement points (End Devices) were designed. These two End Devices measured the environmental changes and transmitted the data to the ZigBee module, which managed the network under the name of the coordinator. 21 Each sensor node was equipped with an Arduino Mega 2560 embedded card and sensors that read/wrote the ZigBee radios (Figure 5). Arduino Mega is an open-source prototyping platform based on a simple input/output (I/O) board. 23

Sensor node.
A charge controller, a solar panel, and a 12 V 7 A dry battery were used in each sensor node to supply power, and the solar panel generated a maximum of 20 W. The generated power was also sufficient to feed the electronic components. The sensor node read the temperature, humidity, and weight values and transmitted the data to the coordinator. A Sht11 temperature and humidity sensor was connected to the XBee radio and mounted on Arduino Mega with an XBee shield. Sht11 is a digital sensor with a humidity measuring range of 0%–100% and a measuring accuracy of 3%. This sensor also has a temperature measuring a range of −40°C and 128°C, with an accuracy of 0.5°C. The load cell, which was placed under each hive and constantly read the changes in the weight, had a measurement range of 0–100 kg. The load cell also had an output sensitivity of 0.9 ± 0.2 mV/V and a signal amplifier was used to amplify the signals read by the load cell. Different from the sensor node, the coordinator node had a GSM/General Packet Radio Service (GPRS) module that transmitted the data obtained from the network to the Internet through GPRS. The card used in this study had an on-board SIM900 GSM module, which could operate in four different bands, 850/900/1800/1900 MHz. To operate, the module had a SIM card with an Internet data pack from an operator that provided high signal strength. All equipment used direct current (DC) voltage, and after transmitting the data to the Internet, the domain name “honeybeemonitoring.com” was registered and a web page was created. The data sent to the web address were read using a PHP page and were stored in the database. MySQL was used as a database system, and the charts on the web page were designed using JavaScript (Figure 6). WSN data transfer rate reached 256 kbps. The current consumption rate of the sensor nodes is measured as 300 mA/s, indicating potential for long-term measurements.

Web page created for real-time monitoring.
The testing area was situated on an area of approximately 30 km2 and the maximum great-circle distance of the region was 5 km. The sensor nodes were deployed at an altitude of 700–800 m and at approximately 40° latitude and 40° longitude.
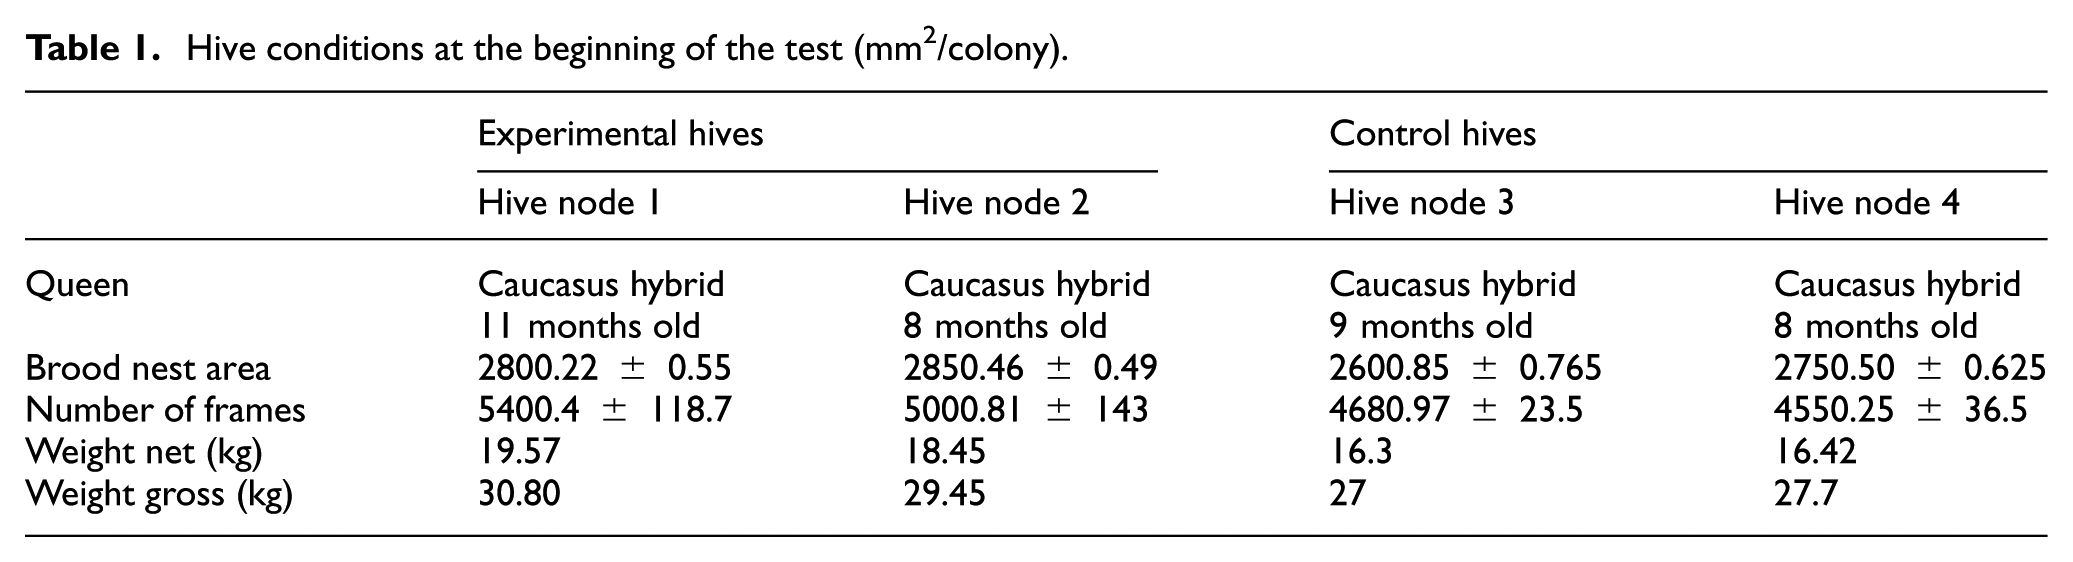
The study involved two experimental hives and two control hives, all having hybrid Caucasian colonies. The reason behind choosing the Caucasian race is their ability to adapt better to the ecological conditions around the region. The hives had been selected randomly and divided into two, including the control and experimental hives. The colonies were equalized so that the test gave accurate results. These colonies, separated from the other two hives, each had a queen bee, which was obtained from the Trabzon Arıcılar Birliği (Trabzon Beekeepers Association). The difference observed between the queen bees was significant (p < 0.005) and Langstroth hives were used in the measurement. In order to increase the accuracy of the test that detected the nectar flow, the same conditions (ovulation rate for bee colonies, age, race) were formed. The colonies were handled under the same maintenance and handling conditions for a period of 1 month. Each node in the WSN was deployed on a setup of one experimental hive and one control hive over a distance of approximately 3 km (Table 1).
Hive conditions at the beginning of the test (mm2/colony).
Results and discussion
Due to the high number of seasonal transitions and the weather conditions being rainier, foggy, and colder, the weight gain was lower in the region where sensor node 2 was deployed (Figures 7 and 8). In general, the hive weight gain was lower than expected at both measurement points, and all the results were made available on honeybeemonitoring.com.
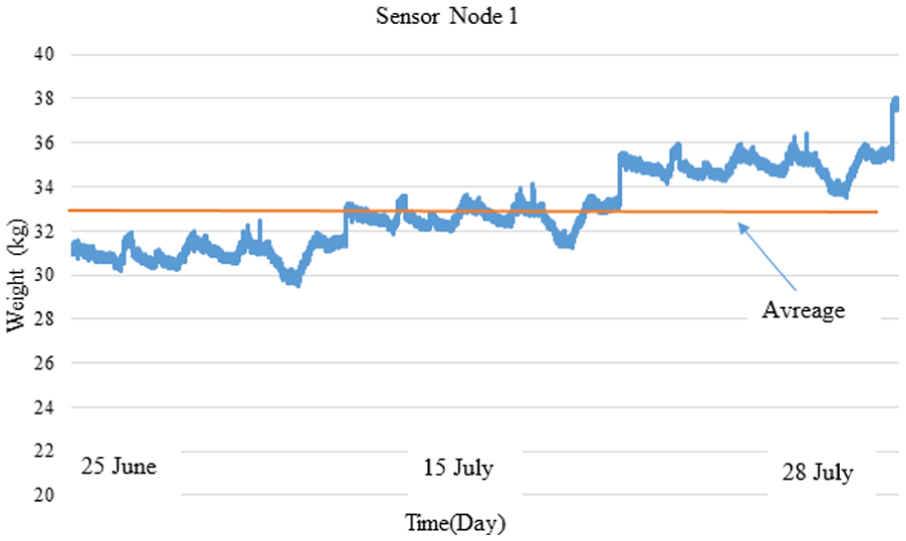
Weight changes measured by sensor node 1.
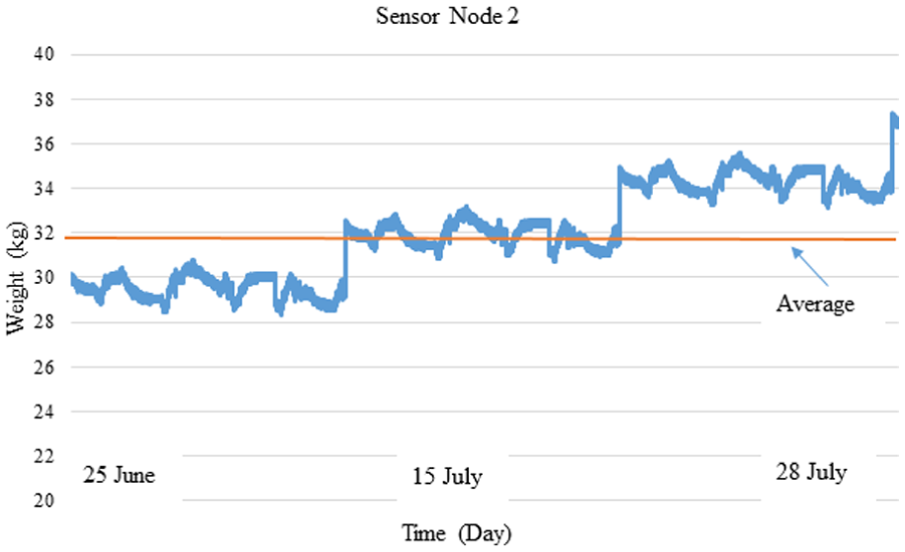
Weight changes measured by sensor node 2.
The hive weight gain measured by sensor node 1 (Figure 7) was found to be 6.53 kg in total. The average daily gain was 0.87 kg. The maximum daily gain was found to be 1.4 kg, while the minimum gain was 0.21 kg.
The hive weight gain measured by sensor node 2 (Figure 8) was found to be 7.26 kg in total, and the average daily gain was 0.967 kg. The maximum daily gain, however, was found to be 1.59 while the minimum gain was 0.17 kg. Figures 9 and 10 show the temperature and humidity of the environment in the testing area. The hives started to gain weight with the first light of the day, and the increase in weight continued during the daylight hours. The maximum gain during the daylight hours was measured as 0.44 kg, which was observed on 25 July between 11:00 a.m. and 12:00 a.m.

Temperature and humidity values measured by sensor node 1.

Temperature and humidity values measured by sensor node 2.
Despite the more unfavorable weather conditions, the higher number of chestnut trees, which had a dominant potential in the region, explained the reason of higher level honey production in the region where sensor node 2 was deployed (Figure 10). The maximum weekly gain measured by sensor node 2 occurred during the period from 17 July through 21 July. The weight gain was measured as 2.28 kg during this period.
The weight changes in the control hives observed during the same period were as follows: the weight of the control hive measured by sensor node 1 was 27 kg at the beginning and 33.21 kg at the end of the test, indicating a gain of 6.53 kg. The weight of the control hive measured by sensor node 2 was 27.7 kg at the beginning and 34.73 kg at the end of the test, indicating a gain of 7.03 kg. At the end of the test, however, the number of frames covered with bees in the experimental hives was found as node 1 = 8 ± 0.5 and node 2 = 7 ± 0.5.
The changes in the control hives were found as 7.5 for node 1 and 6.5 ± 0.5 for node 2, and an 83% similarity was found between the control and experimental hives measured by node 1. The similarity between the control and experimental hives measured by node 2 was found to be 99%.
In this study, a WSN was designed to monitor the nectar flows in Trabzon/Dernekpazarı—a region frequently visited by migratory beekeepers. In addition to this, it was home to the chestnut species, which had a dominant potential where the monitoring process was successfully carried out. The hive weights, temperature, and the humidity around the hives were measured continuously. A scalable and cost-efficient WSN was used to monitor the colonies. However, further studies by expanding the scope of the system could provide more information.
The effect of nectar- and pollen-producing plant species on honey yield was found as shown in Figure 3. Coefficient of 30 yellow zone, spatial and temporal as honey yield is highest are also the most intense range of nectar flow. The dominance of plants in the nectar flow through the experiments and the literature has been found to be effective. Despite the availability of healthy bees and young queen bees, the colonies in the experimental and control hives were not able to benefit from the bloom period. According to the measurements, the effect of weather conditions on honey production was not as expected. Instead, it was observed that the weather conditions are extremely important for achieving maximum nectar flow (Figure 3). This study also revealed how much the changes induced by global warming can affect honey bees which are dependent on nature. Thus, the amount of honey obtained from each hive is not sufficient to survive winter and it is necessary to feed the colonies to make them stronger in the spring. Weather forecasts can also be helpful in guiding the migratory beekeepers.
A decision support system can be developed using geographical information systems in order to provide the migratory beekeepers with information about the region they will visit and to find a route for them with the highest honey yield potential. As a result, it will be possible to ensure the optimum use of the nectar sources and to take maximum advantage of the beekeeping activities.
Footnotes
Academic Editor: Miguel Acevedo
Declaration of conflicting interests
The author(s) declared no potential conflicts of interest with respect to the research, authorship, and/or publication of this article.
Funding
The author(s) disclosed receipt of the following financial support for the research, authorship, and/or publication of this article: This study was supported by Karabük University within the scope of Scientific Research Projects with a KBÜ-BAP-15/2-DR-025 code.