
Abstract
The article presents out-of-vehicle channel measurement results in ultra-wide band spanning 3–11 GHz bandwidth using a vector network analyzer for localization applications. Experiments for different distances and different angles around the parked car are carried out. From the power delay profiles, the distance between the antennas is calculated exploiting the linear dependence of distance with line-of-sight delay peak. The coordinates of a transmitting antenna are found with the help of two receiving antennas following a two-dimensional time-of-arrival-based localization technique. A comparison of the calculated coordinates with the original exhibits an error of less than 6% which establishes the suitability of the proposed approach in locating other neighboring cars.
Introduction
Locating a personal vehicle is the key step for many transportation applications, be it safety-critical, for example, railway crossing surveillance, 1 or non-safety-critical, for example, finding a vehicle in parking lot. 2 There exists different global navigation satellite systems (GNSSs), such as Global Positioning System (GPS) in the United States, Galileo in Europe, Global Navigation Satellite System (GLONASS) in Russia, BeiDou in China, and Navigation with Indian Constellation (NaVIC) in India, to determine the location of a car in outdoor scenarios. Car localization is also possible to some extent with the help of terrestrial cellular mobile networks. However, finding exact locations of vehicles in an enclosed space represents a major challenge. The positioning systems mentioned before cease to work in confined and underground areas and it is necessary to find a suitable method for such scenarios.
A fingerprinting-based indoor positioning method for Bluetooth network is described in Chen et al. 3 along with real measurements. The real-time positioning with Bluetooth is difficult due the high latency involved in its device discovery phase. The popular IEEE 802.11p standard for Car-2-X communication also cannot be used for positioning in underground garage. 4 On the other hand, there had been plenty of literature that vouch for ultra-wide bandwidth (UWB) technology due to its low transmit power, effectiveness in counteracting multipath fading, and high-resolution capability in the time domain.5,6 Different UWB-based localization mechanisms can be found in Gezici et al. 7 and Svecova et al., 8 and the geometric localization topology for UWB systems is presented. As far as real-life measurements are concerned, measurements at a open-space parking lot were performed by a real-time UWB multiple-input multiple-output (MIMO) channel sounder in Zetik and Thoma, 9 and authors of Zwirello et al. 10 described the UWB positioning method with error prediction based on scenario geometry for indoor applications. It is envisaged that UWB will be used for intra-vehicular sensor networks and remove, at least partly, the communication cables in near future.11–16 The intra-vehicle UWB network may be integrated for localization around vehicles. There is already some measurement studies available17,18 for communication and positioning inside vehicle. In another study, 19 the penetration loss for a device inside passenger compartment is described while the device is trying to receive UWB signals from outside the car.
UWB has better penetration as it supplies a huge bandwidth at a lower central frequency. A mathematical measure of this is the radar range resolution, given by
There are mainly three variants of localization algorithms proposed in the literature 21 based on received signal strength (RSS), angle of arrival (AOA), and time of arrival (TOA). The RSS-based algorithms require detailed signal fingerprints which are site-specific and make the measurement very cumbersome. 21 On the other hand, AOA algorithms require receiver antenna arrays or array of sensors. 22 Comparison of RSS and TOA techniques was performed for UWB indoor scenarios in Sangthong et al. 23 Considering the high-time resolution of UWB signals, TOA-based schemes seem most viable low-cost low-power high-precision alternative. Ultra-wide band technology has been successful in TOA-based short-range localization and ranging, 24 particularly in indoor areas.25,26
The contributions of this article are as follows:
We measured the frequency-domain forward transfer channel coefficients with a vector network analyzer (VNA) for out-of-car UWB propagation in an underground garage. In Dammes et al., 27 the suitability of VNA-based measurement is emphasized in the context of localization. The VNA-based measurement can obtain real channel measurements in frequency domain which can be used for localization simulation algorithms after suitable post-processing, that is, converting the data to the time domain.
The measured data are used to construct power delay profile (PDP) in distance domain and distance of the transmitter antenna is estimated from line-of-sight (LOS) peak in PDP. The dependence between LOS path delay and distance is studied and suitable function for delay interpolation has been formulated based on polynomial fitting.
We present the basic geometrical topology for a simple two-dimensional (2D) localization which helps to find the location of other cars in the vicinity of the test vehicle.
The rest of the article is organized as follows. Section “Measurement setup” describes the equipments and parameters for measurement. Section “Measurement results” provides detailed distance estimation and localization results. Finally, some conclusions are drawn in section “Conclusions and future work” along with possible directions to extend the current work.
Measurement setup
Measurements are realized with one transmitter (Tx); three receiver (Rx) antennas, Rx1, Rx2, and Rx3; and a VNA, following the basic principle as outlined in Dammes et al., 27 around a five-door Skoda Octavia car. The car is parked at the middle of the lowest basement floor in University garage. As shown in Figure 1, all passenger windows and doors of the car are closed, and all equipments for measuring and data recording are installed outside the car on the opposite side of the measurement area. Figure 1 also shows zoomed versions of the Tx antenna, the primary Rx antenna (Rx1), which serves as a reference point for Tx antenna placement, and the front end of the VNA.

The vehicle under test and measuring instruments.
The block diagram for the measurement setup is described in Figure 2. The VNA was used to sweep the entire ultra-wide band (3–11 GHz) with a frequency step of

Block diagram of the measurement setup.
During post-processing of data, the frequency-domain channel transfer functions are converted into time-domain channel impulse responses (CIRs) through inverse fast Fourier transform (IFFT). Thereafter, a simple squaring of the CIR followed by averaging yields the PDP. All the processing of the measured complex channel transfer functions
Calculation of the CIR using IFFT in combination with rectangular window.
Peak detection above threshold. The threshold (−45 dB) was set by simple visual inspection.
Calculation of the Tx antenna coordinates using the TOA technique.
For both transmission and reception, omnidirectional identical conical monopole antennas are used. Figure 3 presents the measured radiation pattern of the antennas. It can be seen that the H-plane pattern is circular which suggests that if the Tx and Rx antenna are placed at same height, ideally there should not be any effect of antenna orientation.

Measured gain pattern of the conical monopole antennas in E-plane and H-plane.
Figure 4 displays the position of the receiving antennas. The first receiving antenna, Rx1, is installed on the roof of the vehicle where regular car radio antennas are mounted. The second antenna, Rx2, is located at the front end of the roof at a distance of 1.13 m from Rx1, and both Rx1 and Rx2 are placed at a height of 1.5 m above the floor. Lastly, Rx3 is fixed on the car bonnet near windshield at a height of 1 m. All three antennas are installed in a straight line along the roll axis of the vehicle.

Placement of the receiving antennas.
The transmitting antenna is set at a height of 1.5 m above ground (at the same level of Rx1 and Rx2) with the help of a tripod stand and its position is changed to 23 different locations as depicted with blue solid circles in Figure 5. The distances of Tx from all three Rx antennas are listed in Table 1.

Placement of the transmitting antenna.
Distance and angle of transmitting antenna.

Tx installation points follow concentric semi-circles around Rx1 with an increasing radius of 3, 4.5, 6, 7.5, and 9 m at an uniform angular separation of 45°, that is, at angles of 0°, 45°, 90°, 135°, and 180° relative to the roll axis which connects Rx1 with Rx3 via Rx2. This arrangement ensures that there always exists a direct LOS path between Tx and Rx1 (as well as between Tx and Rx2), whereas the path between Tx and Rx3 is mostly non-LOS (NLOS) with LOS path being available at only certain angles and distances.
Measurement results
Distance estimation
The frequency-domain data obtained through the experiments consists of discrete channel frequency response recorded at equally spaced

where

where

depends on the frequency step
For calculating the distances between Tx and Rx antennas, TOA technique is used. TOA is based on the detection of the first ray received by a particular Rx antenna. This is achieved by a search algorithm that compares individual signal samples of the PDP with a certain threshold to avoid noise and identify the first amplitude peak that corresponds to the LOS time delay,

In Figure 6, we superimpose all PDPs corresponding to Rx1 obtained for different Tx antenna positions. The PDPs are plotted in the distance domain instead of the delay domain for better understanding. The PDPs for same Tx–Rx separation but with different angles with Rx1–Rx2–Rx3 axis form distinct groups. Thus, we may conclude that there is almost no effect of angular variation in distance estimation. Furthermore, the peaks in the same group overlap with each other and are very close to the actual distance shown with red dotted lines. Although this is expected since the H-plane gain pattern is omnidirectional, deviations in the actual field data are common due to site topology. The propagation may be affected by the reflections from roof and floor, the obstruction by pillars, and the presence of other vehicles.
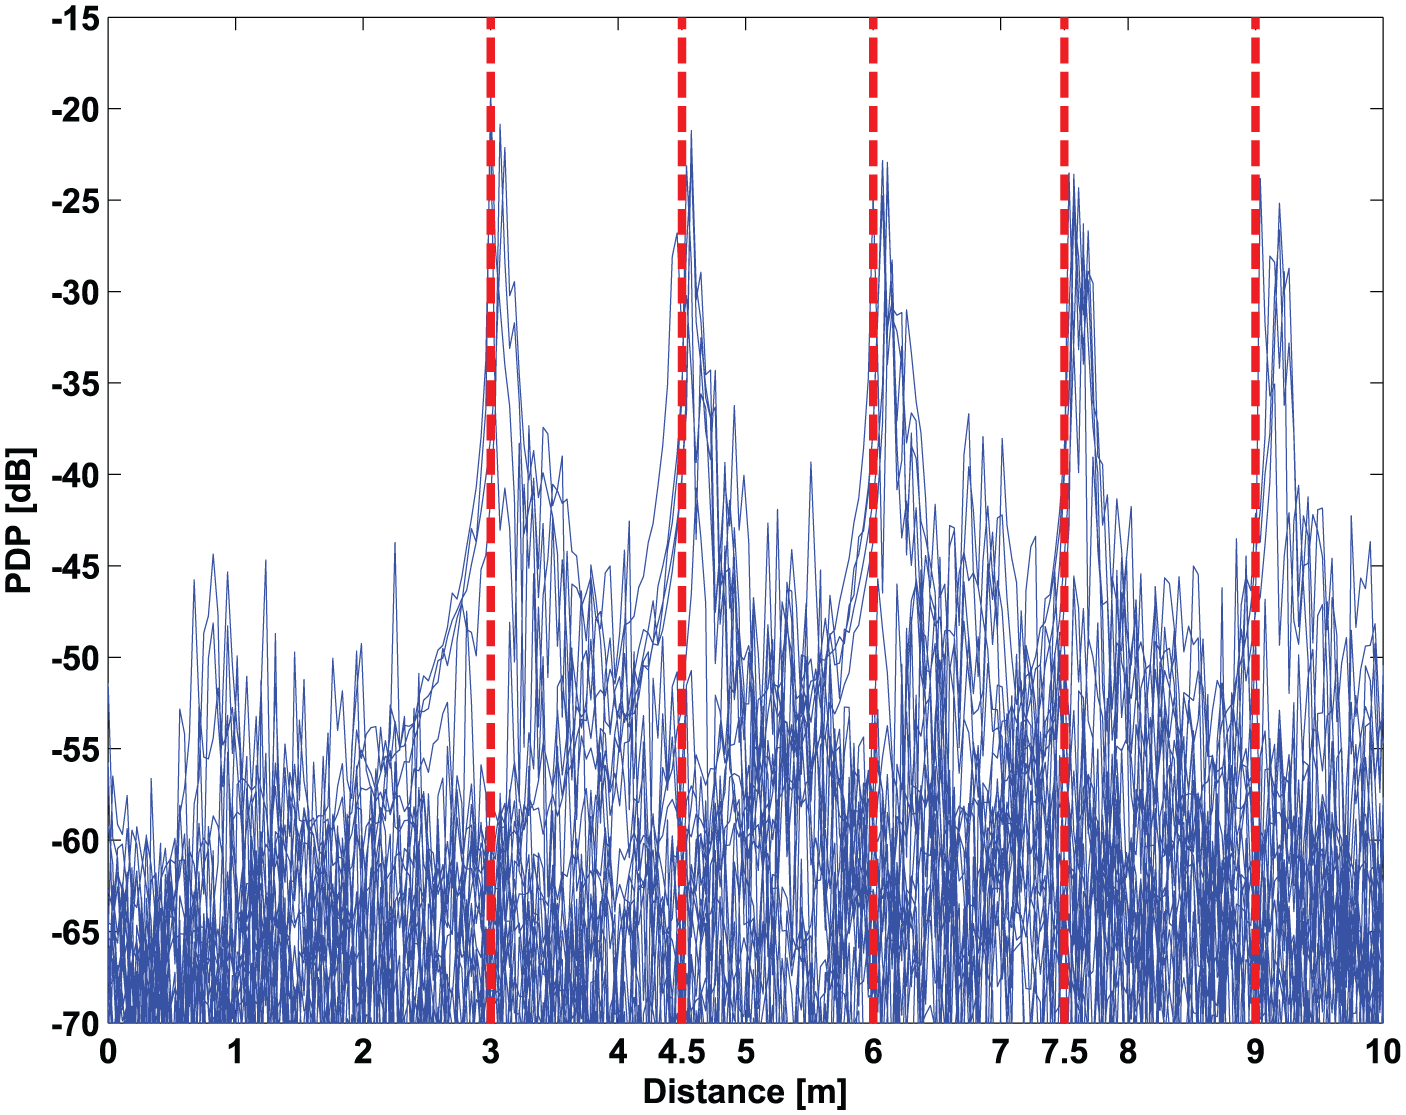
Superposition of PDPs for Rx1 for all Tx positions.
Table 2 gives the real and calculated distance between Tx and Rx1 for all the 23 different measurement points. In most of the cases, the deviation is about 2.5% with the maximum deviation being 5% which translates to an error of 15 cm at a distance of 3 m. The same information for Rx2 and Rx3 are given in Table 3 where a maximum of 6% deviation is noticed. The maximum deviation is for measurement no. 10 for all three Rx antennas, and the deviation for all other measurements is very low indicating some measurement error that might have occurred during that particular measurement. Although the maximum error obtained for this particular set of measurement is 15, 16, and 17 cm for Rx1, Rx2, and Rx3, respectively, the error can be considered small compared to the dimensions of the vehicle.
Distance of Rx1 from Tx antenna positions.

Distance of Rx2 and Rx3 from Tx antenna positions.

While analyzing Tables 2 and 3, one may find a positive bias in the calculated distances, that is, the calculated distance is always more than the actual distance. It is also interesting to see some correlation among the error statistics for all the three Rx antennas irrespective of their positions, that is, be they on the roof or on the windshield. This may be related with the calibration plane and phase center of the antenna. The VNA was calibrated only for the coaxial cables without considering interfaces of the antennas. All the observations are, however, subjected to two limitations. First, the distances between Rx and Tx antennas were measured by a ruler, and there is a possibility of error in the measurement. Second, due to the discrete nature of the PDP time axis, the first peak can only be detected with an accuracy of distance resolution
Delay distance dependence
In this subsection, we depict the uniformity in the delay-distance dependence in a graphical manner. This proves the robustness of the TOA-based distance estimation technique for our chosen experimental environment. We begin by finding the expected first peak delays
Next, as shown in Figure 7, we plot


Delay versus distance.
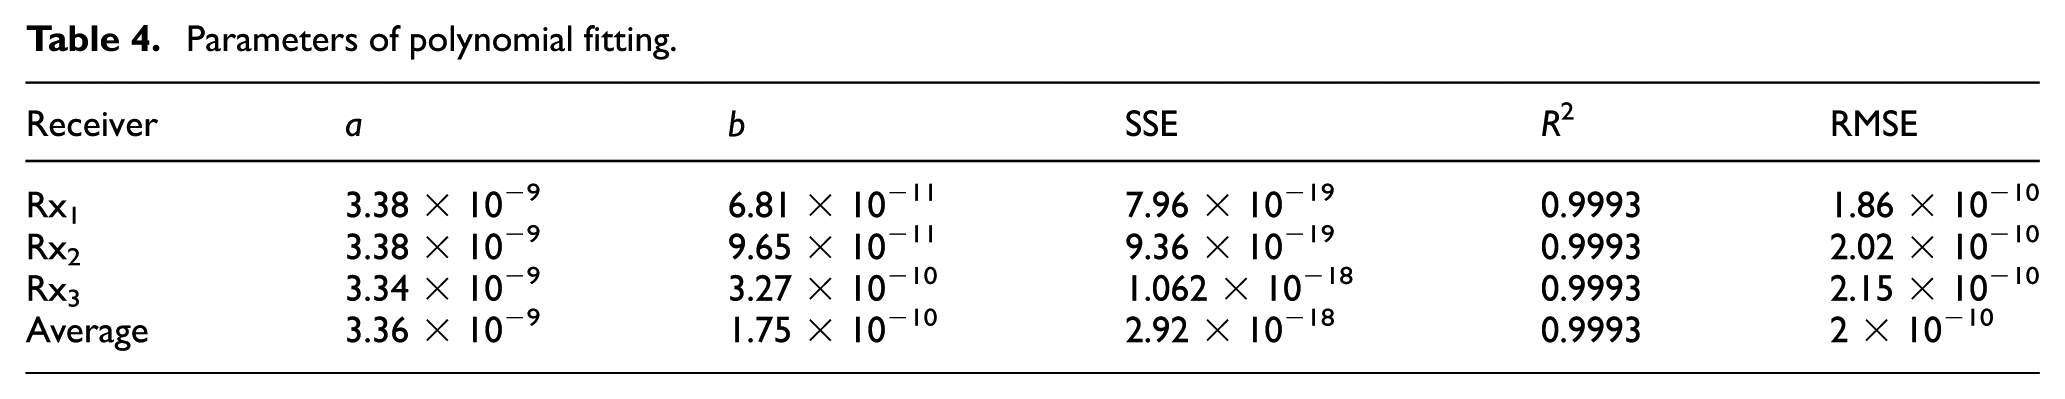
The results of the fitting are shown in Table 4. The calculated coefficients, a and b, are fairly constant for all three Rx while sum of squares due to error (SSE) as well as and root mean square error (RMSE) are close to zero and the coefficient of determination (R2) is close to unity. This indicates the goodness of fit and based on the coefficients for the linear function, it is possible to even interpolate the distance for other values of LOS path delay, for which measurement data are not available.
Parameters of polynomial fitting.
Localization
Finally, we describe the simple 2D localization performed from the distance estimates as obtained from the first peak detection of PDPs in the distance domain. Two receivers on the car roof, Rx1 and Rx2, are used to locate the Tx antenna as the Tx antenna is placed at same height. It is a well-known fact that two reference points on plane are sufficient to find 2D coordinates.
Figure 8 describes the geometrical topology where the coordinate system has the unknown Tx antenna node
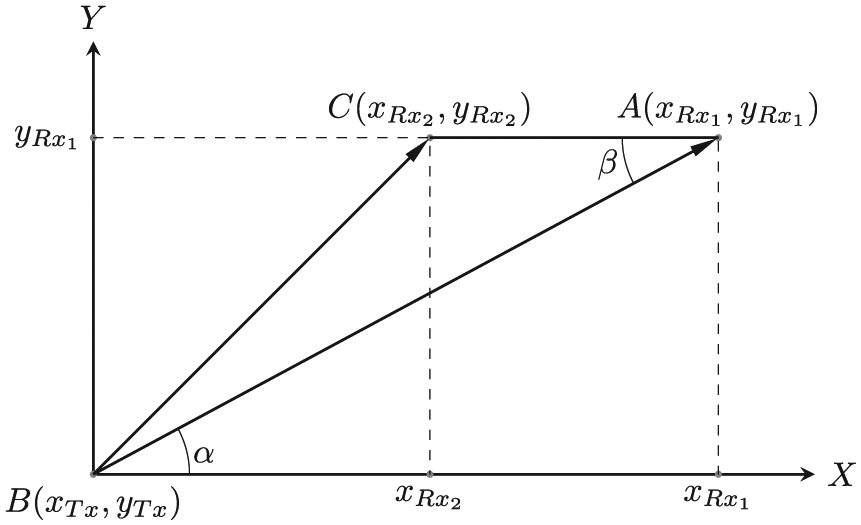
The principle of 2D localization.
As the actual coordinates of Rx1 are known (relative to the parking lot floor plan), it is enough to find the relative coordinates


From the theory of parallel line angles, it is easy to show that the angle
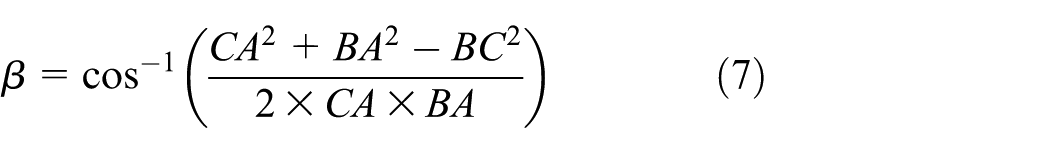
The side CA is fixed and equal to
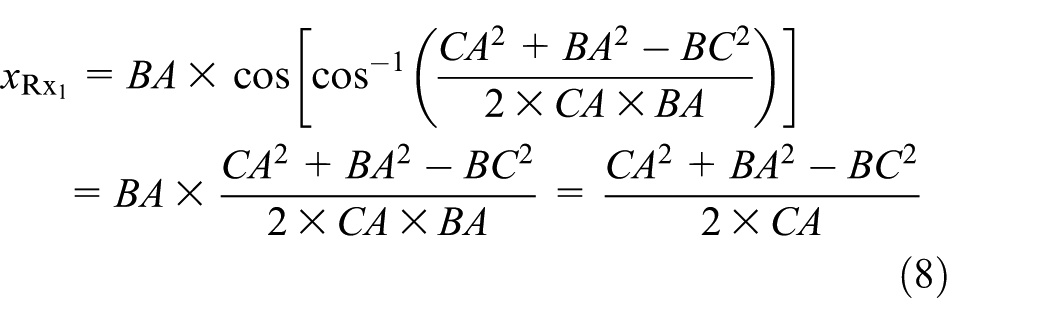
and

In the second step, a detailed map of calculated Tx coordinates are constructed in Figure 9 and compared with the measured coordinates. The goal of constructing this 2D localization map is to assess whether the simple TOA algorithm results correspond to reality in a rough sense at least. In other words, is it possible to reliably detect a vehicle on a particular parking lot. The application does not need accurate coordinates with mm level accuracy, and it can work with rough estimation of the car position in cm range. Table 5 lists the measured and calculated coordinates of Tx antenna along with the deviation for each measured location. The deviation is few centimeters at most and indicates that UWB is robust in locating other cars in the vicinity.
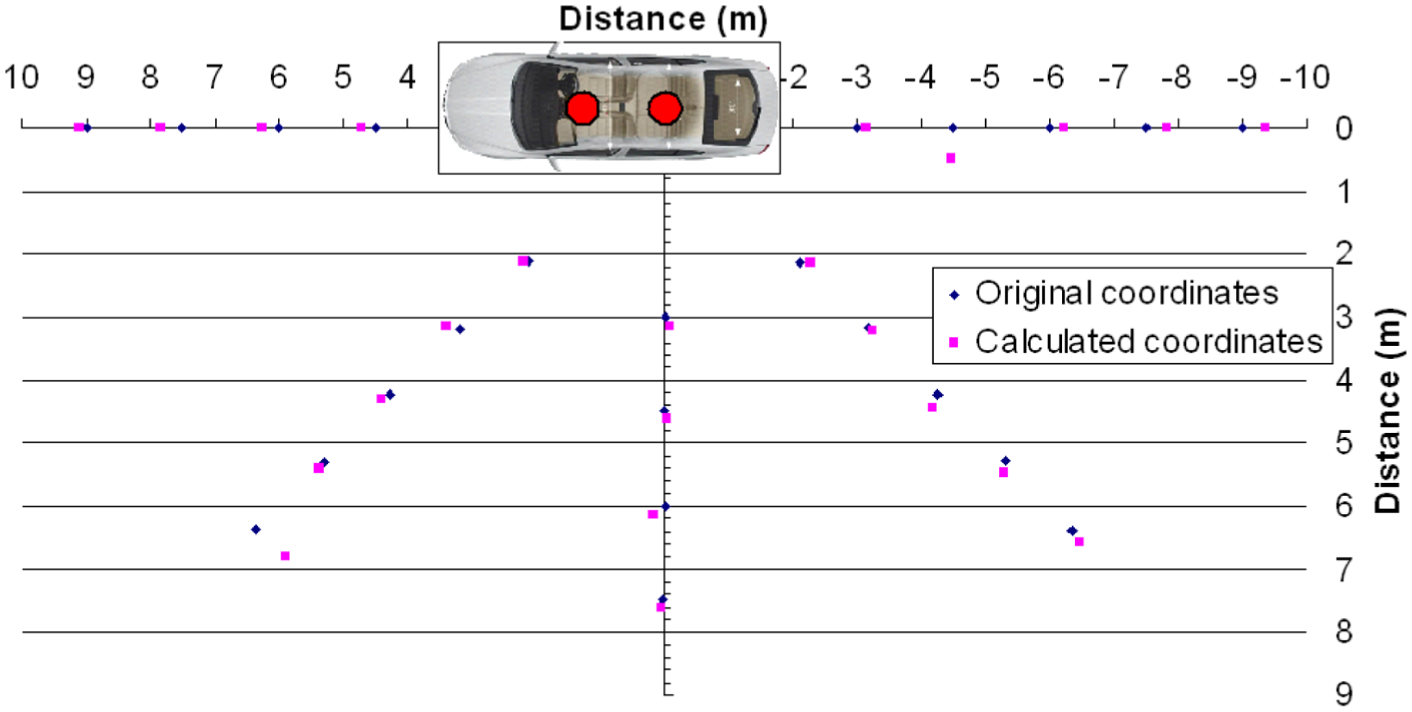
Actual and estimated position of the Tx antenna.
Comparison between measured and calculated coordinates of Tx.

The main problem associated with the localization using two receivers is the inability to determine the zone location of the transmitter relative to the receiver axis. However, in this particular case, it was not a serious issue as we considered only one side of the vehicle.
Conclusion and future work
In this article, UWB real-world measurements for out-of-vehicle scenarios in an underground garage have been presented. Based on the measurement results, it is possible to realize a distance-delay linear relationship which is exploited to find distance of the transmitting antenna from receiver antennas. The estimated distances are used for TOA-based 2D localization with only two receivers and the calculated coordinates exhibit small error. The proposed solution is sufficient to determine the positions of nearby vehicles in an underground garage.
The simple mechanism described in this article is unable to provide information regarding whether the car is on the left or on the right side of the roll axis. If we place the third receiver away from the roll axis, the problem can be solved by applying the standard trilateration technique. Another important extension is to assess the effect of vehicle mobility, which is a big challenge with the current VNA-based setup, because both Tx and Rx should be connected to the VNA via cables and the degree of movement is restricted to the length of the cable. Our research group has developed a generic time-domain measurement setup 28 from off-the-shelf user equipment and we plan to perform experiments with moving cars in near future.
Footnotes
Academic Editor: Leandro Villas
Declaration of conflicting interests
The author(s) declared no potential conflicts of interest with respect to the research, authorship, and/or publication of this article.
Funding
The author(s) disclosed receipt of the following financial support for the research, authorship, and/or publication of this article: This work was supported by the SoMoPro II Programme, Project 3SGA5720 Localization via UWB, co-financed by the People Programme (Marie Curie action) of the Seventh Framework Programme (FP7) of EU according to the REA grant agreement no. 291782 and by the South-Moravian Region. This publication reflects only the author’s views and the Union is not liable for any use that may be made of the information contained therein. The research is further co-financed by the Czech Science Foundation, project no. 13-38735S Research into wireless channels for intra-vehicle communication and positioning, and by Czech Ministry of Education in frame of National Sustainability Program under grant LO1401. For research, infrastructure of the SIX Center was used. The generous support from Skoda a.s. Mlada Boleslav are also gratefully acknowledged. The funding received did not lead to any conflicts of interest regarding the publication of this manuscript.