
Abstract
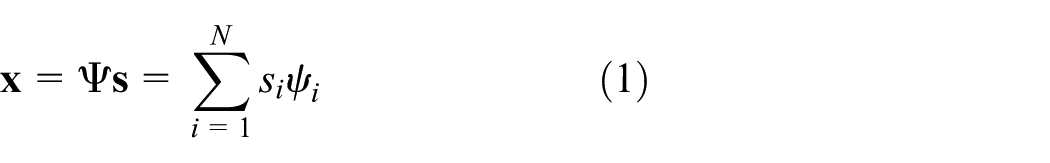
Compressive sensing is a promising technique for data gathering in large-scale wireless sensor networks. Existing compressive sensing–based data gathering techniques still follow sampling than compression paradigm. In this article, we proposed a random sampling zero-encoding data gathering scheme for wireless sensor networks, which exploits virtual Gaussian energy diffusion model to obtain sampling and compression data gathering. Our proposed data gathering model not only can make simultaneous sampling and compression but also do not need to assign projection matrix to each sensor node. Our scheme can efficiently resolve two types of sensor networks’ data gathering problems: recover missing sensory data and extend monitoring field using incomplete random sampling. Extensive experimental results show that our proposed random sampling zero-encoding data gathering model has good performance for reconstructing the sensory data in wireless sensor networks.
Keywords
Introduction
Wireless sensor networks (WSNs) are regarded as the bridge to connect human society and the physical world, which are widely deployed for monitoring and disseminating information about various phenomena of interests.1,2 A WSN can contain large-scale sensor nodes, but it has its own features: (1) sensor node is resource-constrained such as energy, computation, storage, and bandwidth; (2) sensor networks are error-prone such as packet loss, transmission error, and abnormal reading; and (3) the sensory data of the same monitoring field often have strong spatial–temporal correlation. One of the major challenges for designing sensor networks is minimal samples and communication cost with obtaining fidelity information at sink.
In-network compression is an essential technique to reduce communication costs. Traditional compression techniques require sensor nodes with a strong computational power and need to exchange side information among sensor nodes such as transform-based compression and joint entropy compression, which are not suitable to data compression for WSNs. Compressive sensing (CS) is a new sampling and compression paradigm which is based on the fact that a relatively small number of linear combination of a compressible or sparse signal can contain most of its salient information. To the best of our knowledge, existing periodical compressive data gathering techniques based on CS still separate the process of sampling and compression.3–6 Sampling than compression CS data gathering techniques would bring many problems. First, the sampling ratio is relatively high because too many sensor nodes should take part in one measurement gathering. Second, the data gathered could be easily damaged because the sensor network is an error-prone network. Third, the number of CS measurements is difficult to adaptive control because the sink lacks of trusted comparison sensory data.
In this article, we present a random sampling zero-encoding data gathering model to reconstruct the sensory data for WSNs, which aims to make compression and sampling simultaneously, and it is used for improving the robustness of CS measurements and reducing sampling rate. Our main contributions are as follows:
We presented a random sampling zero-encoding data gathering model based on virtual Gaussian energy diffusion model which can make simultaneous sampling and compression and need not to assign projection matrix to sensor nodes
We analyzed that the orthogonal Gaussian energy diffusion basis has good compression performance for spatially correlated signals. Meanwhile, we also proved that sampling matrix and orthogonal Gaussian energy diffusion basis satisfy restricted isometric property (RIP) condition with probability tending to 1
According to our proposed random sampling zero-encoding data gathering model, we proposed an efficient missing sensory data recovery scheme, which can reduce the number of sampling sensors significantly
The rest of this article is organized as follows. In section “Related works,” we present the related work. The foundations of CS are introduced in section “Basic of CS.” In section “Problem statement,” we give the problem statement and present random sampling zero-encoding data gathering model. In section “Random sampling zero-encoding sensory data reconstruction,” we propose two types of applications based on random sampling zero-encoding model in detail. Section “Experimental results” reports our experimental results, and the conclusions are given in section “Conclusion.”
Related works
Compressive data gathering
In recent years, many compressive data gathering techniques were proposed. D Baron et al. 7 proposed distributed CS that enables new distributed coding algorithms for multi-signal ensembles exploiting both intra- and inter-signal correlation structures, and also gave three joint sparsity models. Rabbat and colleagues8,9 applied CS theory to single-hop data gathering in WSNs to obtain efficient compression for network data. S Lee et al.10,11 proposed joint optimization of transport cost and reconstruction for spatially localized CS in multi-hop sensor networks. Luo et al.5,6 proposed compressive data gathering based on CS theory to effectively reduce communication costs and prolong network lifetime in large-scale monitoring sensor networks. In the previous studies,3,4,12 the authors extended CS data gathering to dual-layer compressed aggregation and adapted the number of measurements during the data gathering. To the best of our knowledge, existing researches still separate the processes of sampling and compression. Sampling than compression compressive data gathering techniques would bring high data transmission cost.
Incomplete sensory data recovery
There exist two groups of incomplete sensory data recovery, which recover the missing sensory data using correctly received sensory data and reconstruct the monitoring field sensory data using incomplete sampling. The missing sensory data could be obtained by retransmission techniques or reconstructed by spatial interpolation techniques.
13
But retransmission would increase network burden which can lead to more packets loss and more energy consumption. To reconstruct the entire monitoring field using incomplete sampling, spatial correlation interpolation or transform domain interpolation can be done to reconstruct the missing samples.3,14–16 Sheikhhasan
14
and Umer et al.
15
presented distance-weighted interpolation technique to reconstruct the missing samples–based spatial correlation of the sensory data. Guo et al.
16
proposed sparsity-based spatial interpolation algorithm via solving the
Basic of CS
CS is a new kind of compression and sampling paradigm. It asserts that a small number of linear projections of sparse or compressible signals can contain sufficient information for reconstruction of the signals.17–19 While Shannon–Nyquist sampling theory stated that the sampling rate must be at least twice the maximum frequency to avoid losing information when capturing a signal, CS theory breaks through the bottleneck of Shannon–Nyquist’s sampling theory for sparse or compressible signal and makes simultaneous sampling and compression possible.
We assume that
where

where
Definition 1 (RIP)
Suppose

for all k-sparse vectors
For the second problem, the reconstruction

If the measurement vector

where
From the framework of CS theory, we can see that CS codec scheme shifts the complexity from encoder to decoder and makes encoder become very simple.
Problem statement
In this article, we focus on periodical compressive data gathering in large-scale WSNs. According to CS theory, compressible signal recovery process is to first recover its corresponding sparse signal and then recover the original signal by inverse sparse basis transformation. Why don’t we imagine the spatially correlated signal as the energy diffusion of multiple virtual sources? If it can be, the process of spatially correlated signal recovery is equivalent to identify the locations and amplitudes of the corresponding virtual sources. What is more, if the energy diffusion model of virtual source satisfies a certain property, each sample value can be considered as a CS measurement. If the above conditions hold, then every sensory value is both sampled value and compressed value which achieves sampling and compression simultaneously.
In this section, we shall establish an energy diffusion model to meet the above conditions and to prove that a single sample value can be considered as a CS measurement.
Basic assumption
To simplify the problem statement, we make the following reasonable assumptions for periodical compressive data gathering in WSNs:
The monitoring field contains M sensors and a sink. Each sensor samples a real value periodically, and the sink is responsible for gathering and recovering the sensory data
All sensors sample once in a given periodical time interval and each periodical time is called a round data gathering
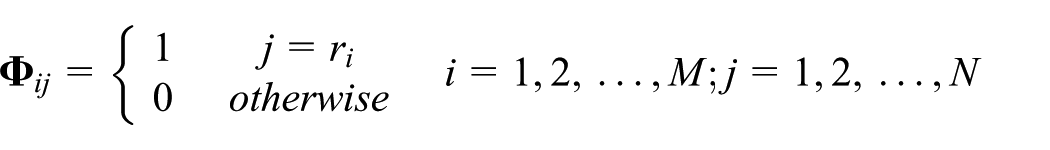
The monitoring field is partitioned into N grid cells which indicate the resolution offered by the sensor network. The distance between neighboring grid cells is considered as one unit. M sensor nodes are randomly deployed in N grid cells, and each grid cell contains at most one sensor node
For each round data gathering, the monitoring data of N grid cells are denoted by
Problem formulation
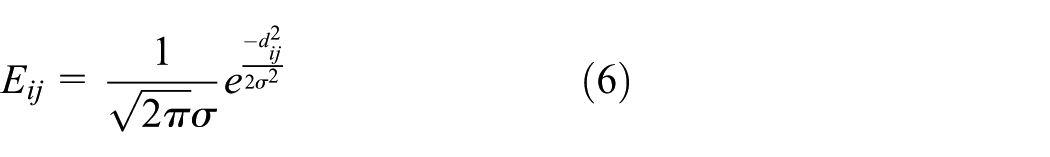
To transform spatially correlated signals to energy diffusion sources, we need to establish an energy diffusion model which does not need to meet the real energy diffusion model because energy sources are virtual. For the same spatially correlated signal, when different energy diffusion models are selected, it means different energy sources distribute in the monitoring field. Without loss of generality, we define the energy diffusion model as Gaussian model
where

We denote Gaussian energy sources by

Since there exist N grid cells and M sensors in the monitoring field, M samples can be expressed as

where
where

where

If we can exploit
and

where
Does
satisfy sparsity?
In this subsection, we display that
For any spatially correlated signal

The element mean and element variance of every row of
Figure 2 shows two types of signals compression results. In Figure 2(a), the signal comes from a block pixel value of “Lena” which can be considered as strong spatially correlated signal. In Figure 2(c), the signal comes from GreenOrbs 22 within the same round data gathering and sorted by sensor node Mote_ID which can be considered as weak spatially correlated signal. Figure 2(b) and (d) illustrates that the energy of transformed coefficients under orthogonal Gaussian energy diffusion basis are mainly concentrated in a few elements. Based on the above analysis, we can consider that the orthogonal energy diffusion basis has compression function for spatially correlated signal.
The transformed coefficient signal
Does
obey RIP?
In this subsection, we first present the statistical properties of
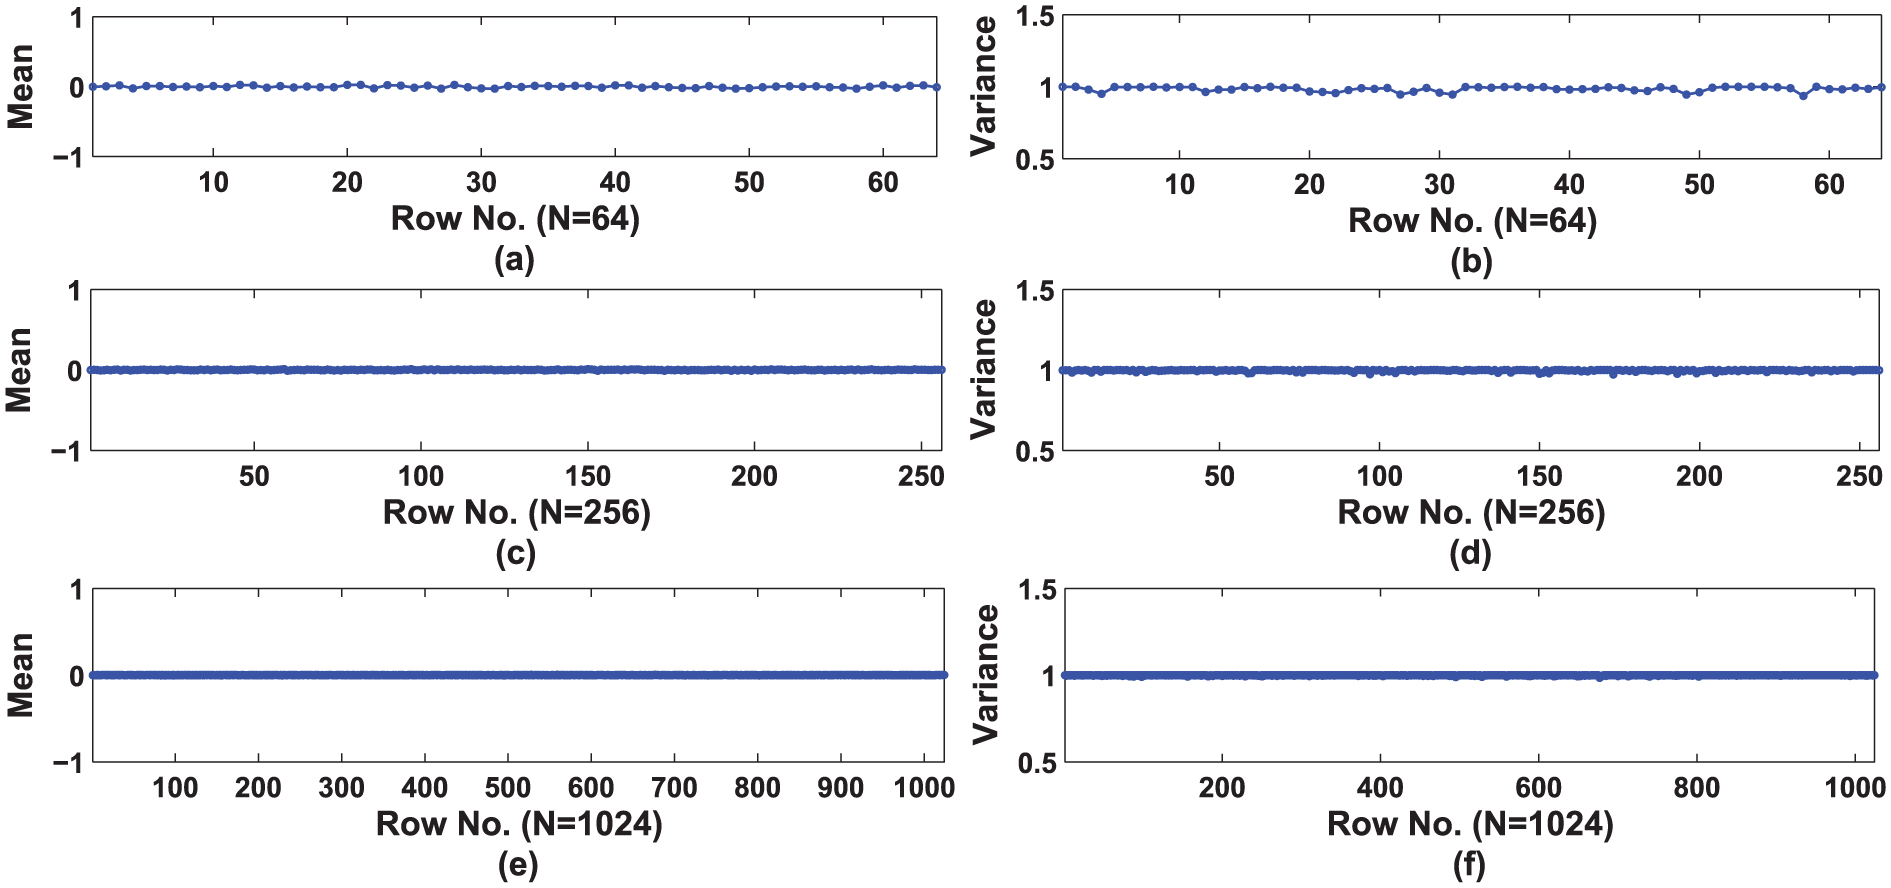
The element mean and element variance of every row of
In the following part, we shall prove that
Definition 2 (sub-Gaussian)
A random variable

holds for all
Corollary 1
If the
Theorem 1
Fix

for all N-dimensional k-sparse signal
According to Theorem 1, we know that
Random sampling zero-encoding sensory data reconstruction
In the above section, we have analyzed that each sample can be considered as a CS measurement under Gaussian energy diffusion model. In this section, we present a random sampling zero-encoding data gathering scheme according to the above theory discussion. Our proposed compressive data gathering model can be applied to two types of practical applications: (1) recover the missing sensory data due to packet loss, transmission error, abnormal reading, and so on and (2) extend the monitoring field using incomplete random sampling.
Efficiently recovering missing sensory data
Because sensor network is an error-prone network, packet loss, transmission error, and abnormal reading are very common phenomena especially for large-scale WSNs. First, we analyzed sensory data of two real sensory systems to illustrate the statistical results of missing sensory data. We selected 45 rounds sensory data of GreenOrbs 22 which contain 330 sensor nodes and Intel Berkeley Research lab 25 which contain 54 sensor nodes, respectively. In this subsection, the missing sensory data only refer to lost packet and abnormal reading. Figure 4(a) displays continuous 45 rounds missing sensory data ratio of GreenOrbs from 18 December 2010, 00:00 with 10-min interval for each round.Figure 4(b) shows continuous 45 rounds missing sensory data ratio of Intel Berkeley Research lab from the epoch 6486 to 6528. Figure 4 illustrates that the missing sensory data are very common phenomena which can reach more than 50% such as Intel Lab Data. According to Figure 4, we can know that the missing sensory data seriously affect the overall monitoring results. Retransmission techniques, however, are commonly used to handle packet loss phenomenon. It can effectively resolve the packet loss when the load of corresponding sensor node and communication link is lighter. Otherwise, packet retransmission could lead to more packet loss.

The missing sensory data ratio of two real sensor networks: (a) continuous 45 rounds sensory data ratio comes from GreenOrbs data with 10-min interval for each round and (b) continuous 45 rounds sensory data ratio comes from Intel Lab Data from the epoch of 6848 to 6528.
In order to recover the missing sensory data, we designed a post-processing sensory data recovery scheme based on our proposed random sampling zero-encoding data gathering model. Moreover, the lost packet cannot be retransmitted in our sensory data recovery scheme which can reduce the load of sensor networks. Our proposed missing sensory data recovery scheme includes the following steps:
Partition the monitoring field into N grid cells and map the sensors to grid cells;
Record the missing sensory data;
Reconstruct all sensory data based on our proposed random sampling zero-encoding data gathering scheme using correctly received sensory data;
Extract the missing sensory data from the reconstructed N sensory data
In this data recovery scheme, the number of grid cells N is equal to the number of sampling sensors M, and each grid cell has a sensor. We assume that the sink obtains

If the missing sensory data can be considered as randomly distributed in all sensory data, then the correctly received sensory data can also be considered as random distribution. We can use

and

where

where
If the missing sensory data cannot be considered as random distribution such as consecutive sensory data loss corresponding to spatial block sensory field, we can transform this case into randomly distributed by reshuffling techniques and also can improve the compressibility of the original sensory data. In the following, we give the sorted method based on Gaussian energy diffusion model which is called Gaussian sort (GS). Figure 5 shows the GS order of N sensory data. Due to rearrangement of the order of the original sensory data, it can also be seen as random distribution even if it is a continuous block of sensory data loss. In the experimental section, we shall give the GS order which can also significantly improve the compressibility of sensory data.

Gaussian energy diffusion order—GS order.
Extend monitoring field using incomplete random sampling
Through a limited number of sensor nodes to obtain a larger monitoring data is also an important research issue for sensor networks. For example, to obtain the entire monitoring field sensory data as an “image,” if each “pixel” of the monitoring field should be deployed a sensor which requires deploying too many sensors. It may be impossible in sometimes considering from the scale of sensor network and sensor node deployment. In this subsection, we proposed an extension monitoring field scheme using incomplete random sampling based on our proposed random sampling zero-encoding data gathering model.
To implement our proposed scheme, we assume that the monitoring field is two-dimensional (2D) plane, and the sink needs know the location of each sensor nodes. To simplify the reconstruction scheme, we also assume that the WSN is ideal and the missing sensory data cannot occur. The process of extending the monitoring field using incomplete random sampling contains the following steps:
Divide the entire monitoring field into N grid cells which must be based on spatial location information;
Assign the M sensor nodes to the N grid cells;
The sink gathers M sensory data within each given a periodical time interval;
The sink reconstructs the monitoring data of N grid cells based on our proposed random sampling zero-encoding data gathering model after each round data gathering
For step 1, we first must divide the entire monitoring field into N grid cells based on spatial location information which represents the resolution of the monitoring field, and M sensor nodes are independent randomly deployed in the entire monitoring field and each grid only can contain one sensor node. For step 2, M sensor nodes are mapped into N grid cells based on their locations. In step 3, each sensor node samples once in a given periodical time interval and sends its sensory data to the sink. Step 4 would be carried out after data gathering. We assume that the data of the M samples and N grid cells are denoted by

and

where
Experimental results
In this section, we conduct extensive experiments to evaluate the performance of our proposed zero-encoding sensory data gathering model, which contains two aspects: the performance of missing data recovery and the performance of extending the monitoring field using incomplete sensory data. Before the experiments, we give the experimental data sets and the performance metrics. To obtain a variety of real data experimental results, we come up with four real different ways to generate the real data sets for our experiments:
Intel Lab Data. Real temperature data sets obtained from 54 sensor nodes network which deployed in the Intel Berkeley Research lab. 25
GreenOrbs data. Real temperature data set obtained from a forest monitoring WSN which contains 330 sensor nodes. 22
Weather temperature data. temperature distribution data provided by WorldClim. 26
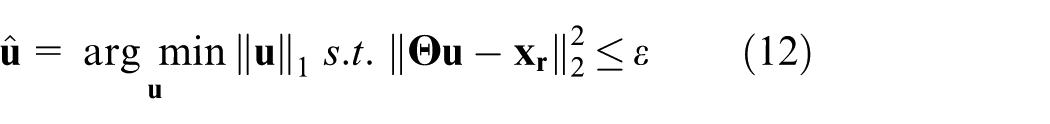
In our experiments, we use the CoSaMP
21
algorithm to solve

where
Real sensed data recovery
To evaluate the performance of our proposed missing sensory data recovery scheme, the experimental data sets are selected from the Intel Lab Data 25 and GreenOrbs data. 22 CS technique cannot directly apply to single round data gathering because the Intel Lab Data only contains 54 sensor nodes. In our experiment, we exploit multi-round sensory data as single signal to carry out our proposed missing data recovery scheme. In the following, we carry out our experiment from three types of sensory data under Mote_ID order and GS order, and the three types of sensory data are as follows:
Continuous six rounds temperature sensory data of epoch 6520–6525 come from Intel Lab Data which contains 208 correctly received sensory data and 116 missing sensory data
A round temperature sensory data of 19 December 2010, 14:30–14:40 come from GreenOrbs data which contains 274 correctly received sensory data and 40 missing sensory data
Randomly selected missing sensory data from 256 correctly received temperature sensory data of 19 December 2010, 14:30–14:40 of GreenOrbs data under the same round
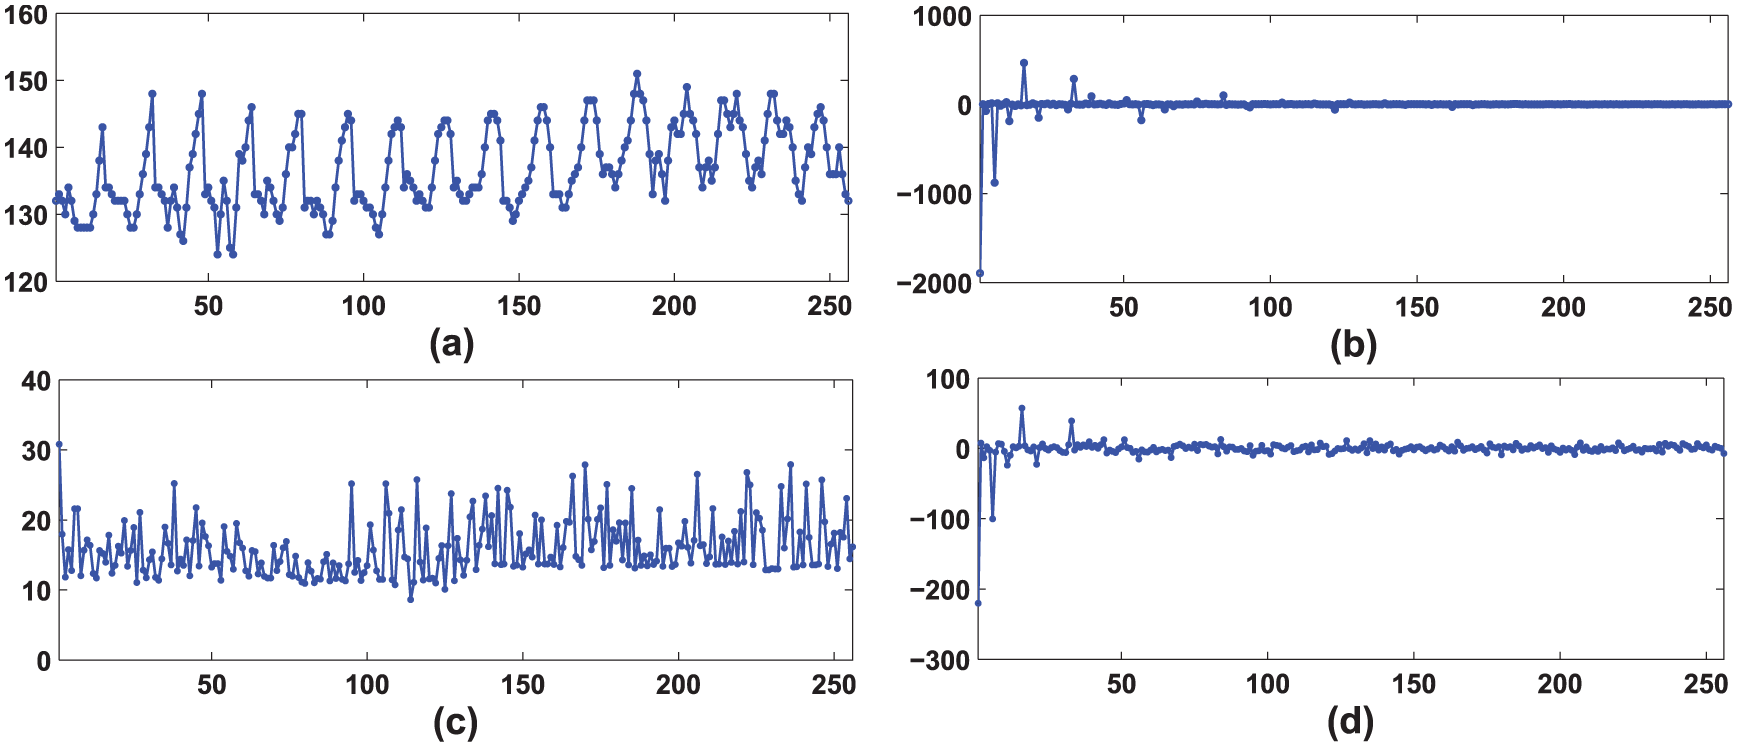
Figure 6 shows the original continuous six rounds temperature sensory data of Intel Lab Data and its recovery sensory data under Mote_ID order and GS order. In Figure 6(a), there are 324 temperature sensory data which contain 208 correctly received sensory data and 116 missing sensory data; the missing temperature sensory value is set to

(a) Continuous six rounds sensory data come from Intel Lab Data sorted by Mote_ID; (b) and (c) are the recovery sensory data using Mote_ID order and GS order, respectively; (d) 208 correctly received sensory data; and (e) and (f) are the recovery sensory data corresponding to the correctly received sensory data using Mote_ID order and GS order, respectively.
Because the Mote_ID order sensory data of the Intel Lab Data are considered as strong spatial correlation signal, it achieved good recovery performance. In the following, we shall exploit GreenOrbs data to evaluate our proposed missing sensory data recovery scheme. Figure 7 shows the round temperature sensory data of GreenOrbs and its recovery sensory data under Mote_ID order and GS order. In Figure 7(a), there are 274 correctly received sensory data and 40 missing sensory data which are denoted by
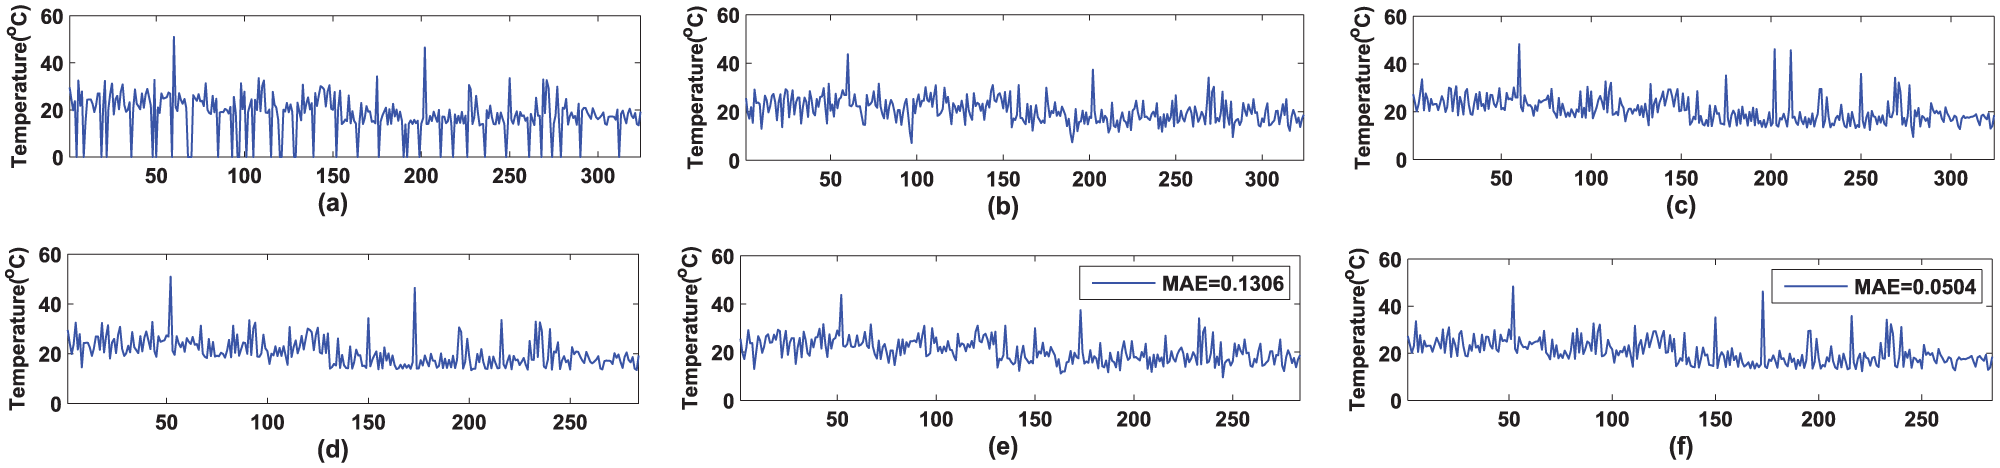
(a) A round sensory data come from GreenOrbs data sorted by Mote_ID; (b) and (c) are the recovery sensory data using Mote_ID order and GS order, respectively; (d) 284 correctly received sensory data; and (e) and (f) are the recovery sensory data corresponding to the correctly received sensory data using Mote_ID order and GS order, respectively.
In order to better display the comparison results between the original sensory data and the recovered sensory data, we randomly selected missing sensory data from 256 correctly received sensory data of GreenOrbs data set to evaluate our proposed missing data recovery scheme. Figure 8 illustrates that the recovery performance of GS order significantly outperforms Mote_ID order under different number of CS measurements. Actually, our proposed random sampling zero-encoding data gathering model can not only be used for missing sensory data recovery but also be used to reduce the samples for WSN data gathering, namely, we can randomly select a part of sensors to take part in sampling during each round data gathering.

The MAE comparison between Mote_ID order and GS order of sensory data under different number of measurements.
Meteorological data reconstruction
In this subsection, we evaluate the performance of our proposed extension of the monitoring field using incomplete random sampling over a set of temperature distribution data provided by WorldClim.
26
The temperature data set partitions the global surface into
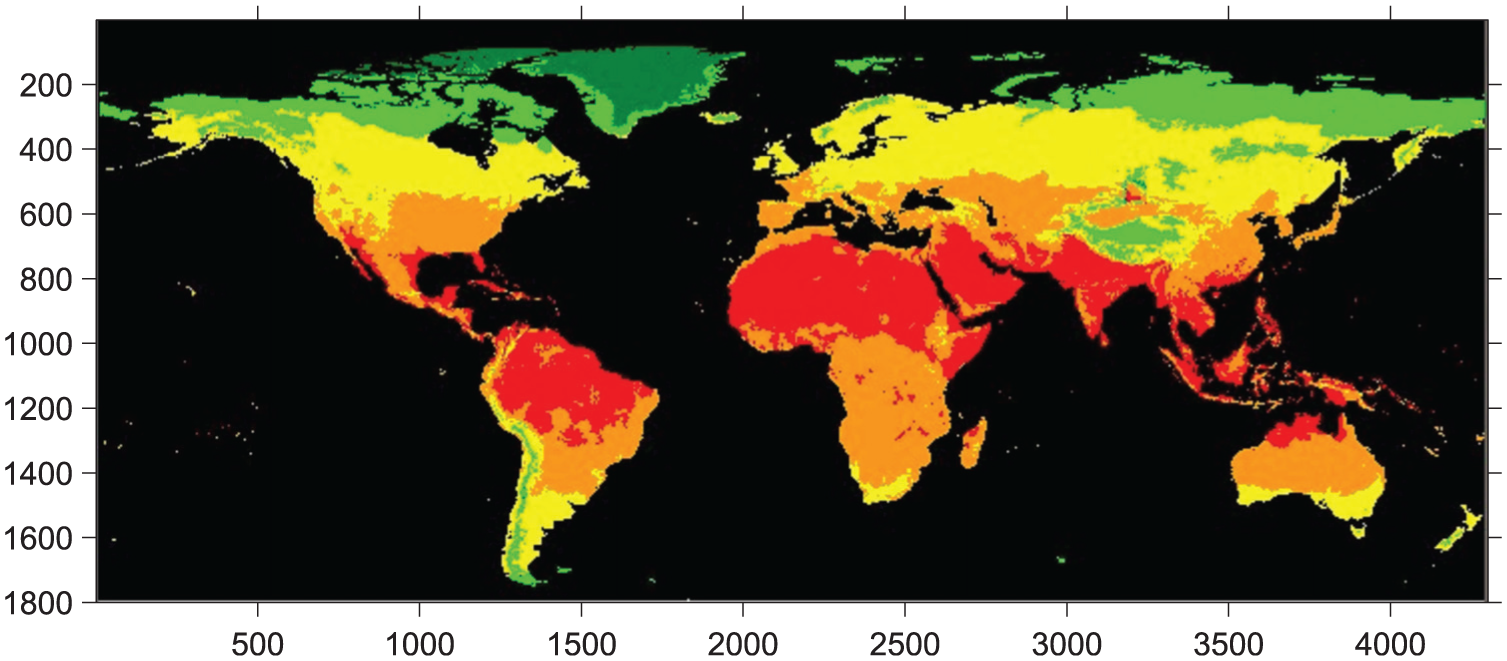
A snapshot of mean monthly surface temperature in September over global land areas, excluding Antarctica.

(a) Original temperature data and (b), (c), (d), (e), and (f) are the reconstructed temperature data corresponding to
The

The reconstructed errors corresponding to Figure 10(b)–(f).
Conclusion
This article investigates the problem of sensory data reconstruction in WSNs based on CS. We first proposed a random sampling compressive data gathering model based on virtual Gaussian energy diffusion model. Then, we analyzed that orthogonal Gaussian energy diffusion basis has good compression function and proved that the product of sampling matrix and orthogonal Gaussian energy diffusion basis satisfies RIP of CS. Our proposed random sampling compressive data gathering model makes simultaneous sampling and compression be possible, which does not want to assign projection matrix to sensor nodes. The experimental results show that our proposed random sampling zero-encoding data gathering model has good performance.
Footnotes
Academic Editor: Weifa Liang
Declaration of conflicting interests
The author(s) declared no potential conflicts of interest with respect to the research, authorship, and/or publication of this article.
Funding
The author(s) disclosed receipt of the following financial support for the research, authorship, and/or publication of this article: The work presented in this paper was supported by the National Natural Science Foundation of China (grant nos 61303209, 61402009, 61302179, and 61572366) and the research funds of the university (grant nos WXZR1524 and WXZR1503).