
Abstract
At present, intravenous infusion in clinical medicine is a very important treatment method in medical care, and it is the main work content of medical staff to ensure the safety and effectiveness of intravenous infusion process. The monitoring system of infusion patient’s physical signs is integrated with sensor technology, bio-electronic technology, and computer network technology. By means of sensor detection, program control and data processing, the automatic detection and control of intravenous infusion process and real-time monitoring of the pulse information are realized. The monitoring equipment has been unable to adapt to the rapid development of medical technology. In this article, based on ZigBee module, automatic control of drip rate, abnormal alarm, real-time liquid crystal display of infusion progress, and other functions are realized without manual intervention. At the same time, the hardware part of the lower computer combines the detection of ECG and pulse to design a multi-parameter monitoring system of vital signs, and realizes the parameter synchronization management requirements of the monitoring terminal based on the local area network. The test proves that the research content in this article is higher than the traditional clinical management mode in terms of monitoring data consistency and data synchronization management accuracy, which can not only reduce the labor intensity of nursing staff, improve work efficiency, but also greatly reduce the potential risks in the nursing process, which is the future application trend of clinical medical nursing work.
Keywords
Introduction
With the development of economy, people’s requirements on medical and health quality are also constantly improving, which makes the market demand for medical monitoring equipment increase continuously. 1 New medical concepts and medical models developed by medical treatment, advanced information technology, and the cross-application with many disciplines are also constantly contributing to the medical and health cause. 2 With the popularization and application of mobile devices such as mobile phones, it has become a trend to combine the traditional medical monitoring with mobile intelligent devices to produce convenient, mobile and intelligent health monitoring technology. At the same time, it also makes the health monitoring technology not only limited to hospitals and other public places, but also makes the traditional hospital monitoring gradually to the grassroots level community-based and family-based independent health monitoring will develop. 3 Therefore, the development of an intelligent infusion monitoring and multi-parameter monitoring system of vital signs based on mobile devices has a positive significance not only for realizing the automation of infusion nursing work, improving the medical efficiency and quality of the hospital, but also for the health monitoring and health management of the elderly and intensive care patients. 4
Physiological parameters such as body temperature, pulse, heart rate, and blood pressure are relatively stable within a certain range, but when they change greatly, it indicates that pathological changes may occur in the human body. 5 As a commonly used medical monitoring device in clinical practice, the main function of multi-physiological parameter monitoring device is to realize the monitoring of human vital signs. 6 In this article, based on the monitoring terminal worn by patients during intravenous infusion in medical institutions, the monitoring air physical data (including blood pressure, heart rate, body temperature, etc.) is provided to the system through ZigBee network. The system collects abnormal data, sends the abnormal data and other information to the data control center in real time, and alerts the medical staff to realize the effect of intelligent supervision of the whole process of intravenous infusion.
In May 2015, the telemedicine center developed by Mercy Medical Insurance Company in the United States was opened to the public, which can provide advanced telemedicine services for patients in dozens of large medical institutions within the company’s capacity. The center consists of 300 full-time doctors, nurses, researchers and technical specialists, which can provide users with 24 h uninterrupted video and voice services, including remote ICU, remote ECG, and home monitoring. Industry experts estimate that by 2020, the number of beneficiaries of the telemedicine center will reach 3 million. In May 2016, the annual meeting of the American Association for Telemedicine at ATA announced that about one million Americans are now wearing implantable cardiac devices or pacemakers. These devices can provide remote real-time heart monitoring medical services for patients with heart disease.
With the advantages of low cost, low complexity, and real-time collection of physiological information of patients, wireless sensor network has great potential for development in medical research, ward monitoring, daily care, and other biomedical fields. It plays an excellent role in patients’ physiological data collection, health status monitoring, drug trial monitoring, and telemedicine.
In this article, under the background of high demand for medical monitoring, the wireless sensor network technology is introduced, and the characteristics and application fields of this technology are introduced, so the ZigBee wireless communication technology is adopted. A wireless medical monitoring system based on the ZigBee technology is designed and developed through in-depth study of the characteristics of ZigBee technology, protocol structure, communication principle, and so on. The data is transmitted to the coordinator node by using the ZigBee wireless communication technology, and the WiFi module of the node transmits the data to the host computer wirelessly, and finally, the relevant data can be displayed and stored in real time on the designed host computer software.
This article designs a patient-oriented monitoring system based on the ZigBee technology, which has the following technical innovations:
The heart rate, body temperature, pulse, and other function are detected simultaneously by the detection module, and are displayed in the display module in real time through the serial port connection of the single chip so that the defect of simplification of the current detection equipment is changed.
In the detection module, the traditional oscillometric method is improved, and the blood pressure is measured by using the correction factor improved oscillometric method, which is verified to improve the accuracy of the traditional oscillometric blood pressure measurement.
The Zigbee module is used for wireless transmission to monitor the vital sign parameters in real time and transmit the monitoring data effectively at regular time.
Sign monitoring system for clinical intravenous infusion patients
Intravenous infusion monitoring module and patient signs monitoring function module are integrated into a system. The two functional modules can work independently or cooperatively to complete the monitoring work of patients with severe diseases. The whole system has the characteristics of small size, simple operation, friendly interface, strong real-time performance, and wide application fields, which reduces the workload of medical staff and improves the quality of monitoring quantity. 7 This article mainly studies the following contents.
Design of wireless communication protocol
For the network framework of the medical mobile terminal system, the ZigBee module is added to the server, and appropriate communication frame format and communication process are developed through wireless transmission, so as to realize the link between the local ZigBee module and the wireless terminal and the data transmission between the monitoring terminal and the mobile monitoring terminal. 8
Infusion monitoring
By selecting appropriate liquid drop and liquid level sensor, we can detect the liquid drop and liquid level, respectively. The output of the sensor is adjusted by the signal conditioning circuit and input to the micro-controller for collection and processing. The infusion information can be displayed on the screen in real time. The initial setting of infusion parameters (such as setting the dropping speed, alarm volume, and total drug volume) can be achieved through key setting. The segmented PID motor control can realize the automatic control of drip speed and the termination control of infusion. 9
ECG, pulse signal detection
First, to choose the appropriate ECG and pulse sensor for signal acquisition, and according to the characteristics of the sensor output signal respectively, to design the signal conditioning circuit, and regulate the ECG and pulse signal input to the micro-controller, modulus conversion, and then convert the result by wireless transmission module sent to medical mobile terminal monitoring software for real-time display, store, and manage. 10
Wireless transmission module
Wireless network is the role of the main system terminal monitoring data sent to the server. In monitoring, the vital signs in patients with abnormal signals possible danger, will monitor the object and call the police for help. Information sent to the remote server, is not just about the vital signs in patients with physiological parameters of the transmission reliability, but also it is more important to decide the life safety detection object. 11 Compared with the WiFi mode which is widely used in the market, the Zigbee protocol also has the advantages of strong anti-interference, not easy to cause frequency conflicts, and better confidentiality.
ZigBee module is selected as the wireless communication module of the monitoring system. The dl-20 wireless window transparent transmission module is adopted, which can work in the public frequency band of 2400–2450 Hz. The CC2530 chip used in the module conforms to the IEEE802.15.4 protocol. Through the module, the traditional serial device can realize wireless transmission, which is free of development and easy to use. 12 The built-in chip CC2530 in ZigBee module can be directly connected with single-chip microcomputer through serial port, and connected to P8 port of single-chip microcomputer. When the sensor collects abnormal data of vital signs of patients, ad analog-to-digital conversion is conducted between CC2530 built-in ZigBee module and MCU, and the data is sent to routing node or ZigBee gateway through radio frequency part of wireless module 13 to realize data push function. The interface circuit between DL-20 module and MCU is shown in Figure 1.

Interface circuit between DL-20 module and single chip microcomputer.
Infusion monitoring module
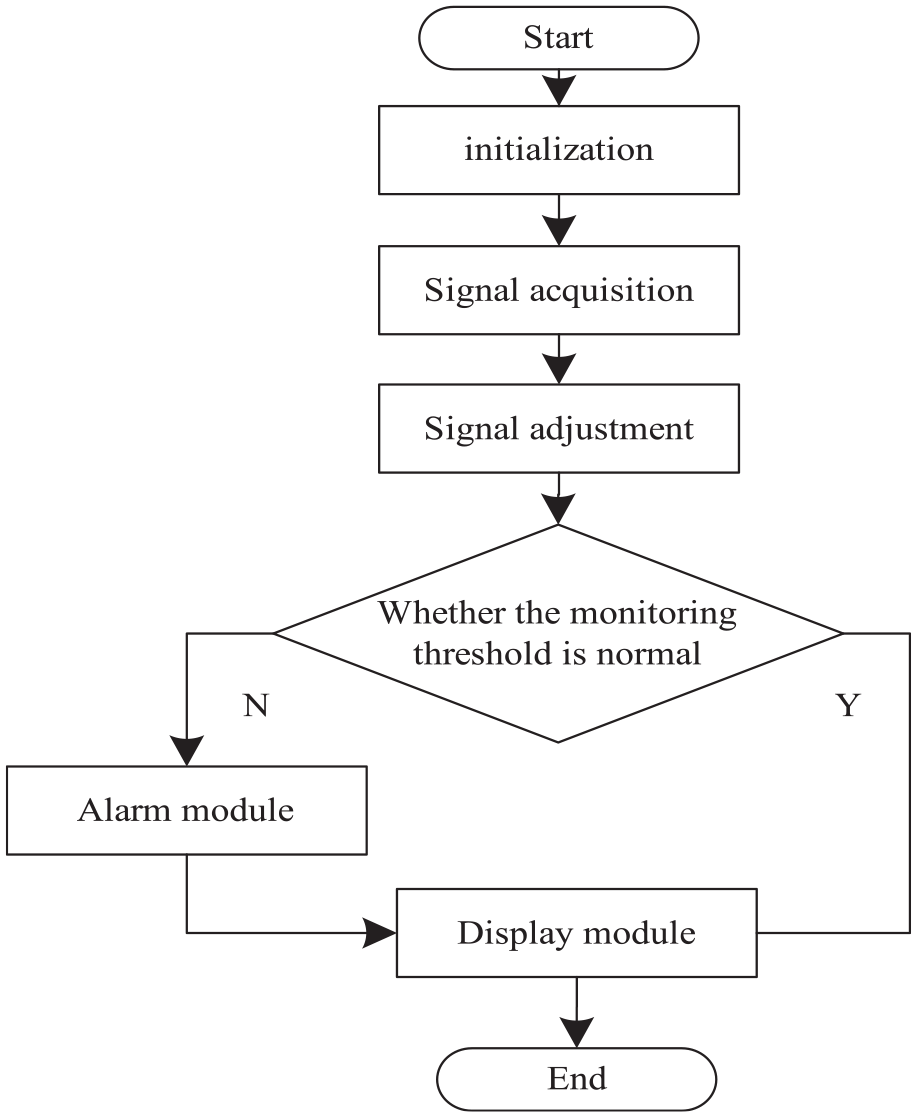
The infusion monitoring module is mainly composed of detection, control, display, and alarm modules. Its design idea is: the detection module completes the detection of liquid drops and liquid level information, the control module adjusts the dropping speed and can block control, the display module displays the infusion information in real time, and the alarm module is used to alarm when the infusion is finished or abnormal conditions occur, so as to realize the automatic infusion process, dynamic detection control reduces manual intervention, 14 and the module flow is shown in Figure 2.
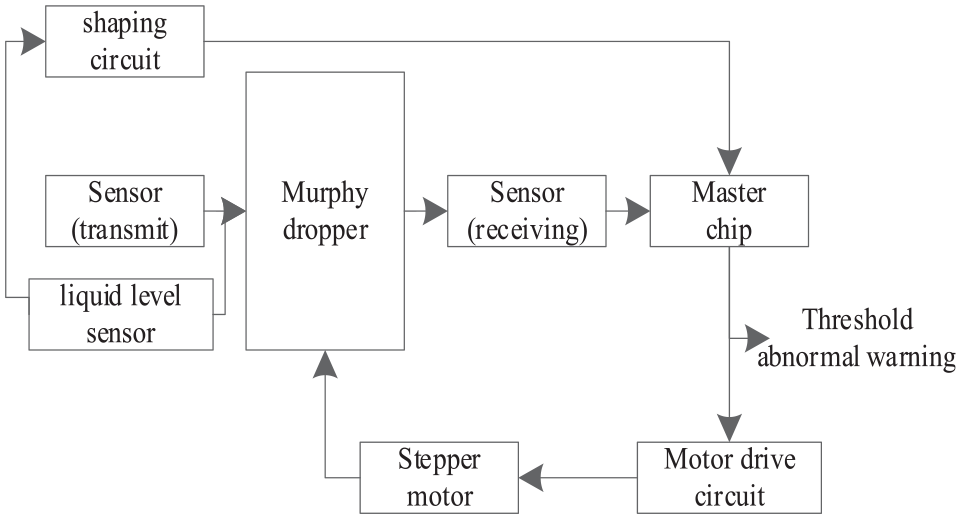
Overall layout structure diagram of infusion monitoring.
The specific implementation process is as follows: (1) the liquid drop and liquid level sensor detect the liquid drop and liquid level state respectively, and the liquid drop sensor counts the number of drops in the process of infusion; (2) the liquid crystal real-time display can set the information such as the total amount of the liquid, the dropping speed, and the alarm amount by pressing the key; (3) the actual dropping speed and the remaining liquid volume can be calculated according to the droplet count value and real time monitoring of the output signal of liquid level sensor; (4) calculate the difference between the actual drip speed and the set drip speed, and judge the residual liquid volume and alarm warning volume through the step motor real-time control of the dripping speed. When the residual amount is less than or equal to the reminder amount or the liquid level sensor outputs effective signal, the motor automatically blocks the infusion and gives an alarm.15–17
Physical signs monitoring module
Heart rate and pulse monitoring module
Circuit design
Heart rate refers to the number of beats per minute in a normal person’s quiet state. Heart rate is a form of fluctuation produced by the aorta flowing through other parts of the body’s arteries when blood is injected into the aorta through the ventricle during the periodic contraction and relaxation of the heart. This wave is called pulse wave.18–20 Therefore, the heart rate value can be obtained by studying and calculating the pulse wave, and the waveform is shown in Figure 3.

Pulse waveform.
Each cycle of heart rate is divided into two stages. Stage 1 is the period of rapid ventricular ejection. After the end of ventricular ejection, the pulse wave is at Point A, and then, with the closure of the aorta, it enters stage 2. Stage 2 is the period from the time of ventricular ejection in this fluctuation cycle to that before the next cycle, and the duration of pulse wave cycle is longer. After Point A, when the blood in the aorta regurgitates toward the aortic valve, it impacts the aortic valve, and the blood cannot enter the ventricle due to the closure of the valve and returns to the aorta, as shown in Point B. Then, when the pulse wave falls, because of the vascular resistance, the speed is slower than the rising speed and relatively stable. Due to the reflection of the pulse wave in the artery, Point B is formed. Point C is the trough of the heavy pulse wave. The above is the description of a complete pulse wave formation process. Because pulse wave propagation is affected by vascular wall elasticity, blood viscosity, and vascular diameter, pulse wave of different people has great difference, so the calculated heart rate value is also different. 21
Selection of the heart rate monitoring method
Heart rate monitoring uses sensor technology to monitor the change of blood volume in subcutaneous tissue and the collected pulse wave, and then calculate the heart rate value. In this article, the photoelectric method is used to monitor the pulse signal, and the heart rate is calculated by counting the interrupt count of the MCU itself.
Unit circuit design
Photoelectric pulse signal measurement is the light generated by the optical emission circuit through the human body to the fixed equipment. At this time, the parameters in the patient’s blood are collected and become electrical signals after a series of changes, and then processed and displayed by the two-stage filter band-pass filter circuit. The system monitoring terminal pulse monitoring module unit circuit is shown in Figure 4, which mainly includes photoelectric sensor detection circuit, secondary band-pass filter circuit, and comparison circuit. 22

Monitoring terminal pulse monitoring module unit circuit.
Selection of the photoelectric sensor device
The photoelectric sensor is mainly composed of two parts: the light-emitting device and the receiving device. After comparison, the photodiode with higher sensitivity and the ability to amplify the current according to the change of light are selected as the conversion circuit device. The light-emitting circuit uses the red light-emitting diode with a wavelength of 0.6–0.7 μm, and the voltage drop is 1.5–2.0 V. The current is 10–20 mA. After comparing several photosensitive elements, it is decided to use the photosensitive diode as the signal receiver, because it has a higher sensitivity in the light source range, changes with the change of ambient light, and has a gain function for the light signal. R14 is mainly used for partial pressure and current limiting, so R14 = 7.5k is selected.
The work flow of photoelectric sensor part is the whole circuit, which is connected with single chip microcomputer through PI. The PWM module of the single chip microcomputer generates 38 K pre-pulse signal trigger circuit, transmits signal through infrared light-emitting diode, and sends it to processing circuit after receiving by light-emitting diode. The photoelectric sensor circuit is shown in Figure 5. 23

Photoelectric sensor circuit.
Selection and design of that device of the two-stage band-pass filter circuit
The logic of the secondary band-pass filter circuit removes the DC voltage in the circuit through the DC-blocking low-pass reverse amplifier, suppresses the high-frequency signal, weakens the 50 Hz power frequency disturbance in the first step, amplifies the retained signal by 100 times in the first step, and controls the frequency range to be 0.05–20 Hz. According to

Logic of two-stage band-pass filter circuit.
After the sensor composed of light-emitting diode and light-sensitive diode collects the signal, the signal is amplified by the front-end amplifier circuit, and then the two-stage band-pass filter circuit is used to isolate and suppress noise. Finally, the 0–5 V square wave pulse signal needed by the single chip microcomputer is obtained by shaping the waveform through the integration and comparison circuit. The square wave pulse signal is used as the interrupt signal to calculate the period. The pulse number is then obtained, and the heart rate calculation is completed. 26
Temperature monitoring module
Body temperature is the most basic representation of vital signs. Since the internal temperature of the body is not easy to measure, it is usually obtained by measuring the temperature of the skin. As the body lesions will cause abnormal temperature of the corresponding parts, body temperature is an important indicator to understand the state of life. In daily life, most of them rely on mercury thermometer, which is more accurate, but the time taken is too long. 27 In the design process of this system, the thermistor temperature measurement method is selected by comparing the commonly used temperature measurement methods.
Circuit design
MF52-103-3435 is selected as the terminal temperature monitor for temperature monitoring. The MF52-103-3435 thermistor obtains the temperature signal, and then displays it in the display module after signal adjustment. If the temperature is abnormal and exceeds the set threshold range, an alarm will be given. 28 The logical structure of the temperature monitoring module is shown in Figure 7.
Logic structure of temperature monitoring module.
Temperature monitoring module circuit uses voltage of 3.3 V, and R5 is the NTC thermistor for temperature measurement, R1, R3, R4, and R6 are used as a bridge balance adjustment. The whole circuit is divided into two parts, one is fixed and the other is changed. The resistance value of thermistor varies slightly with temperature, and the voltage and temperature change. Behind the INA333, op-amp amplifier is a two way of voltage difference, and the change of the voltage and temperature are one-to-one correspondence, the higher the temperature, the smaller the voltage change. Rg selected and amplification effects of a reference as shown in Table 1, system monitoring terminal use 1.01Ω Rg, gain is equal to about 100. 29
Rg selection parameter comparison table.

Body temperature calculation
During the implementation of the system, after the temperature and voltage values are measured by yourself, according to the measured voltage temperature pairs 30 are shown in Table 2.
Curve piece wise linearization (linear-regression).

In Table 2, the temperature measurement accuracy is greatly improved by using piece wise linearization. The maximum error is ± 0.5°C, which meets the requirements of the system.
Blood pressure monitoring module
At present, there are three common methods to measure blood pressure: one is the Korotkoff method, the other is the oscillometric method, and the third is the pulse wave velocity method. Because the measurement of blood pressure by manual auscultation is greatly influenced by human factors and has a certain subjectivity, it is difficult to measure the accurate value. The oscillographic method uses pulse wave to measure blood pressure. The main process is to use the change of the pulse wave amplitude and to obtain blood pressure value in the process of cuff inflation and deflation.
The monitoring terminal uses the oscillographic method to measure blood pressure. The hazy arterial blood pressure is generally used as the reference value of blood pressure measurement. The cuff type blood pressure measurement is selected as the system design of this article. The mixed signal of static pressure and pulse wave is detected by blood pressure sensor and converted into voltage signal.
Circuit design
The normally closed solenoid valve 0520D of the monitoring system has a rated voltage of 3 V, a current of less than 260 ma, a venting speed of less than 3 s, and a pressure range of 0–350 mmHg. Through the height of the pin of the single-chip microcomputer to control the switch state of the valve, it is necessary to make the corresponding pin end of the valve at the low level at the beginning, so that the valve is in the open state. The logical structure of blood pressure monitoring module is shown in Figure 8.

Logical structure of blood pressure monitoring module.
Through the design of air valve, air pump driving circuit, and single chip microcomputer program, the air valve and air pump inflate and deflate the cuff, and the pressure sensor is used to monitor the blood pressure signal in the process of inflation and deflation.
Blood pressure calculation
The terminal blood pressure measurement method of this system is improved on the basis of the traditional oscillographic method. In the process of measuring blood pressure by inflation and deflation, correction factor is a group of data obtained through multiple measurements. In this article, the method of blood pressure measurement is named as the correction oscillographic method.
First, when the cuff is inflated by the air pump, the systolic pressure and diastolic pressure are monitored by the system terminal, which are recorded as PS1 and PD1 respectively, and then, the single-chip microcomputer controls the air valve deflation. At the same time, the system terminal also monitors a group of systolic and diastolic blood pressure, which are recorded as PS2 and PD2. Finally, the blood pressure value is corrected by the correction factor. Systolic and diastolic blood pressures were calculated. Calculation equation is as follow

In equation (1),
The solution process of correction factor is as follows: first, a variety of high-precision sphygmomanometers are selected to measure the blood pressure of test object A for many times in a short time interval, and the average value is calculated as the blood pressure standard. After that, the same object A is measured, a systolic pressure


The correction factors

Process flow of diastolic blood pressure measurement.
The comparison of the principles of aeration measurement and bleed measurement is shown in Table 3.
Comparison of the principle of inflation measurement and deflation measurement.

The measurement of diastolic and systolic blood pressure is a reciprocal process in which the first diastolic blood pressure is measured and the second systolic blood pressure is measured, while the other is the first systolic blood pressure and the second diastolic blood pressure are measured. This requires that in the development process of the system, the two pressure values should be measured at the same time, and the time complexity should be minimized.
The single chip microcomputer continuously collects through the INPUT port, and the corrected oscillogram method after the system is improved, it measures blood pressure in the process of continuous inflation and venting. The single-chip microcomputer controls the charging of the air pump and the venting of the air valve through the program of ULN2003, so as to realize the purpose of measuring blood pressure by charging and venting and ensure the measurement value of blood pressure is more accurate.
System test and analysis
The monitoring system terminal runs stably and realizes all the functions of the original design point. The main purpose is to verify the accuracy and reliability of the monitoring data of the system terminal. The system monitoring terminal is tested. The comprehensive analysis and comparison of the monitoring results of the system and the more accurate data in reality that are carried out, and the advantages of the system are described.
Test analysis of heart rate monitoring
In order to verify the accuracy of the system, three males aged 20, 35, and 55 are tested twice, respectively, using the monitoring system terminal and finger pressing method. The data are shown in Table 4.
System test and finger pressing test data.
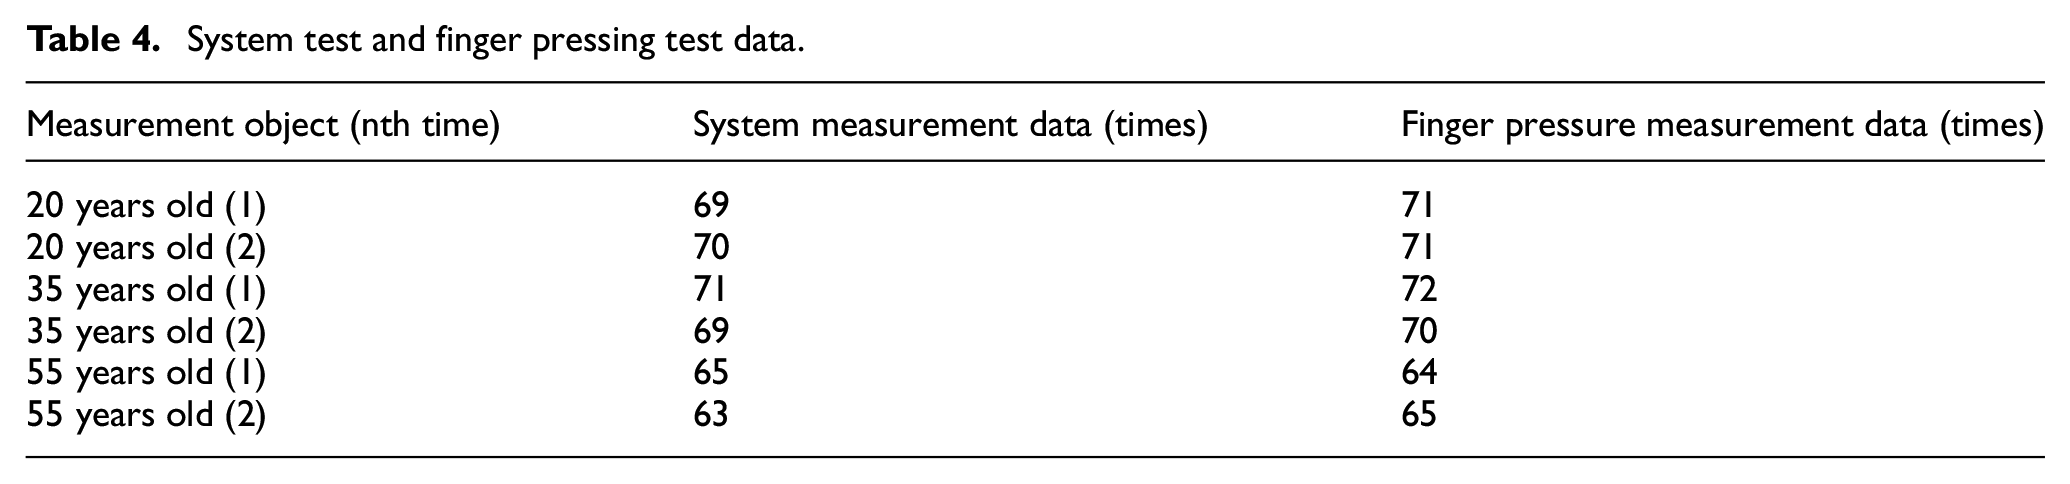
The pulse value measured by this monitoring system is not different from the number of traditional Chinese medicine manual counting. The error of all the measured values is less than three times. Perhaps, the error is caused by the action. In software design, the threshold is set to 60–120 times. If it is beyond the range in the actual application process, the alarm will be given if the measurement is made for three times or more in a row.
Body temperature collection and analysis
The temperature data collected by the system is compared with the mercury thermometer in reality. The results show that the sensor used by the system is more practical than the mercury thermometer. Temperature test data collected by MF52-103-3435 sensor and mercury thermometer are shown in Table 5.
Comparison of temperature data.

The bending curve is shown in Figure 10.

Comparison of body temperature measured by sensor and mercury thermometer.
In Figure 10, the comparison of the two kinds of body temperature measurements is analyzed and summarized as follows:
The sensor measurement is real-time measurement, which needs no time waiting. Compared with the linear measurement of the mercury thermometer, it takes 15 s to wait, and the sensor measurement is more accurate.
The temperature measured by the sensor is consistent with that measured by the mercury thermometer.
The experimental results show that the temperature monitoring method can meet the needs of physical signs monitoring during infusion.
Collection and analysis of blood pressure and pulse signals
Blood pressure and pulse are collected using a mercury sphygmomanometer and a system to simultaneously measure the invited subjects. The statistical results of manual measurement count are shown in Table 6.
Blood pressure measurement result data.

The mean value and standard difference of blood pressure are calculated and compared. The analysis results are shown in Table 7.
Comparison results of blood pressure data.
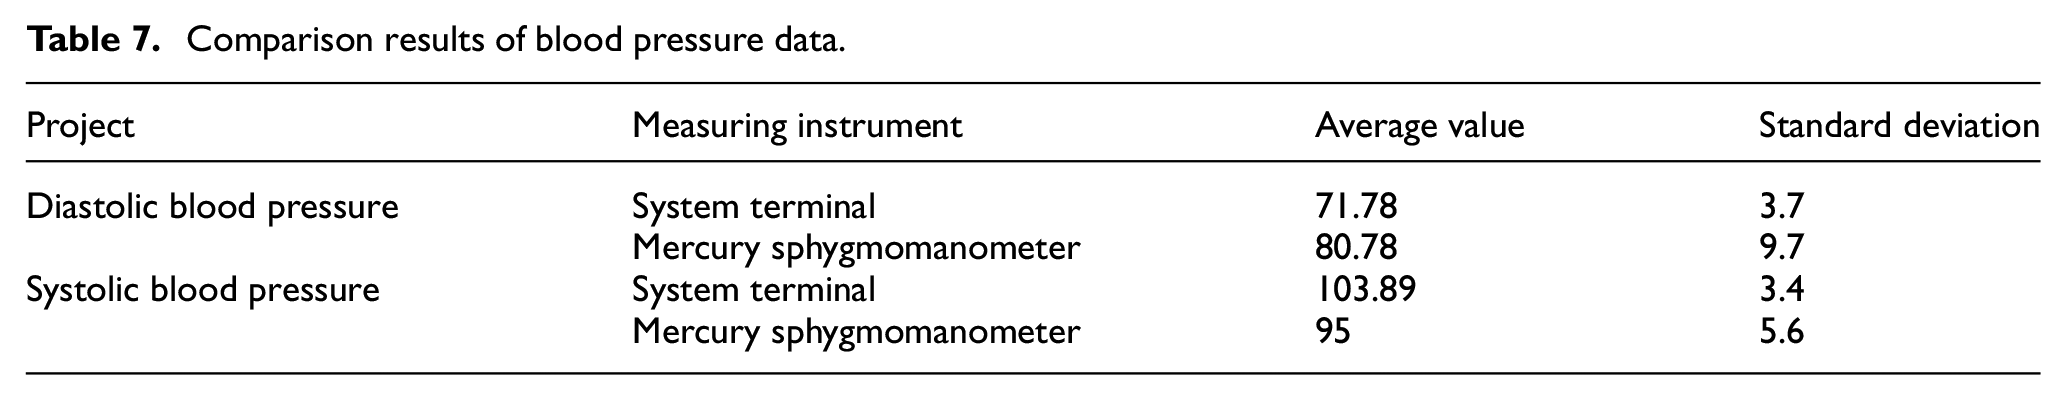
In Table 7, mean and standard deviation data of diastolic blood pressure and mercury sphygmomanometer of the monitoring system are presented. Based on the results, it is concluded that the diastolic and systolic blood pressure values that could be monitored at the terminal of the Zigbee technology, clinical signs monitoring system for patients with intravenous infusion are respectively higher than the results measured by mercury sphygmomanometer + 6 mmHg and 2.2 mmHg, with both mean difference and standard deviation meeting the requirements.
Therefore, the blood pressure monitoring module designed in this article has reached the standard, and the measurement value of the system terminal belongs to the accuracy level. At the same time, it also verifies that the blood pressure measurement based on the oscillometric method has improved accuracy compared with the traditional oscillometric method.
Conclusion
In this article, a detailed study and experiment are conducted on the infusion droplet detection method and the wireless network ZigBee technology, and a practical wireless infusion monitoring system implementation scheme is proposed. A new droplet velocity detection method based on multi-sensor data fusion improves the adaptability of infusion monitoring system in the complex and changeable infusion ward scene. The wireless network ZigBee technology is applied in the medical infusion scene, which can be used for the new method of drug liquid type identification in the infusion scene. The terminal of the physical signs monitoring system is verified and analyzed, and the modules of heart rate monitoring, temperature monitoring, and blood pressure monitoring are tested comprehensively. The test results show that the system is faster and more accurate than the traditional method in the monitoring of vital signs. More importantly, this device provides a great guarantee for patients’ physical health and disease prevention after delivery.
In the future work, the main focus will be on the following directions:
The infusion speed detection method adopts a multi-sensor data fusion method, but the method is not limited to an event detection and weighted average method which is proposed at present. The methods such as naive Bayes, Kalman filtering and the like can be adopted to improve the sensitivity for detecting the infusion state of a patient.
The system uses the Zigbee protocol as the implementation technology of wireless mesh network, but in the actual medical scene, a single network communication technology cannot meet all the needs of people. Complex scenes need a variety of communication means to coexist. Therefore, it is also possible to investigate how to use a multimode gateway in the same system to simultaneously meet medical devices with different communication needs.
Footnotes
Handling Editor: Francesc Pozo
Declaration of conflicting interests
The author(s) declared no potential conflicts of interest with respect to the research, authorship, and/or publication of this article.
Funding
The author(s) received no financial support for the research, authorship, and/or publication of this article.