
Abstract
Objective. This study aimed to investigate age-related changes in cortical auditory evoked potentials (CAEPs) while considering three crucial factors: aging, high-frequency hearing loss and sensation level of the CAEP stimulus. Method. The electrophysiological and audiometric data of 71 elderly participants were analyzed using multiple regression analysis to investigate the association of CAEPs with the factors of aging, high-frequency hearing loss and sensation level of the CAEP test stimulus. Results. Aging was significantly associated with prolonged N1 and P2 latencies and reduced P2 amplitude. Elevated thresholds related to the sensation level of the CAEP stimulus were significantly associated with increased N1 and P2 amplitudes and decreased N1 latency. A significant relationship was detected between high-frequency hearing thresholds and the shortening of P2 latencies and the reduction of P2 amplitudes. Conclusion. The results of this study highlight the complex interplay of aging, high-frequency hearing loss and the sensation level of the CAEP stimulus on CAEP components in elderly people. These factors should be considered in future research using CAEPs to enhance overall understanding of auditory processing in the aging population.
Introduction
As individuals age, speech understanding commonly becomes an issue. Advanced age is typically accompanied by age-related hearing loss (ARHL), which is characterized by a gradual elevation in high-frequency thresholds crucial for speech perception.1-4 Another contributing factor to these issues is age-related changes in the central auditory system which can stem from both physiological aging and compensatory changes due to decreased hearing sensitivity.5,6
Cortical auditory evoked potentials (CAEPs) have frequently been used to investigate age-related changes in the central auditory system. Some studies have reported prolonged latencies in elderly persons,7,8 whereas others have observed no significant differences between younger and older adults.9,10 However, some authors have reported increased amplitudes,7,11 some have reported decreased amplitudes, 8 and others have detected no significant aging effect on N1-P2 amplitudes. 12 Similar to the effects of aging, studies related to sensorineural hearing loss (SNHL) reveal inconsistencies across the results. Certain studies have documented prolonged latencies,13,14 whereas others have noted heightened amplitudes.14-16 Conversely, some research has observed diminished amplitudes,17,18 in contrast to others which have reported no alterations in the P1-N1-P2 response among adults with hearing loss. 19
The methodological differences among these studies, including variations in stimulus and recording parameters, electrode placement, stimulus audibility, age-related characteristics, and sample sizes, may have contributed to the observed disparities. For instance, a consensus appears to exist regarding the elongation of N1-P2 latencies in normal-hearing elderly persons when speech stimuli are employed.8,19-23 This phenomenon can be attributed to the increased susceptibility of speech-evoked CAEPs to age-related degeneration which slows neural transmission.
Additional potential explanations for these disparities may be linked to confounding factors stemming from the differences among elderly subject cohorts in various studies. For example, differences in age distribution or hearing loss characteristics between the two groups of elderly adults may introduce a confounding influence on the outcomes. It is imperative to note there is insufficient research on how these two factors, which commonly coexist, impact CAEPs in the older age period. Moreover, variability exists in the criteria employed for the inclusion of normal-hearing elderly persons in these studies, with many failings to exclude individuals with slight high-frequency hearing loss. This could be attributed to the challenge of determining entirely normal-hearing elderly individuals at advanced ages. However, the omission of slight high-frequency hearing loss in specific individuals within normal-hearing cohorts may have confounded the results.
Likewise, with older cohorts, in addition to aging, both the severity and duration of hearing impairment may exert potential influences on CAEPs. This influence can be linked to the sensation levels of the CAEP stimuli. Existing evidence has indicated that to a certain extent and in normal-hearing adults, an elevation in the acoustic stimulus sensation level typically yields reduced latencies and increased amplitudes of CAEPs. 24 However, SNHL presents an additional effect which can be associated to compensation or cortical reorganization within the central auditory system. Several studies comparing sensorineural hearing-impaired adults with their normal-hearing counterparts have revealed enhanced N1 and P2 amplitudes in individuals with SNHL.15,19,25 Campbell and Sharma 14 proposed that SNHL leads to amplified CAEP amplitudes because of inefficient resource allocation. Nevertheless, the consensus regarding the impact of SNHL on N1 and P2 amplitudes particularly in cases involving elderly participants remains elusive. Harkrider et al 26 reported enhanced N1 amplitudes for hearing-impaired older adults; McClannahan et al 16 and Tremblay et al 19 reported similar amplitudes for normal-hearing and hearing-impaired groups when the sound pressure level of the test stimuli remained constant. The disparities observed in the outcomes of the aforementioned studies indicate confounding factors associated with aging and reduced auditory sensitivity.
The primary aim of this study was to elucidate the relationship between age, degree of high-frequency hearing sensitivity, and pure-tone thresholds corresponding to the sensation of the CAEP stimulus in individuals with ARHL. However, when attempting to investigate these effects within an older cohort, a significant challenge arose because of the continuous nature of these variables. The data of these variables exhibited continuity and lacked reasonable cutoff values for categorical comparisons. Therefore, we confined the scope of this study to explore relational models demonstrating how the P1-N1-P2 complex changes with respect to the core variables related to ARHL. Gaining a deeper understanding of the fundamental factors influencing CAEPs in individuals with ARHL could enhance control in study designs and augment the utility of CAEPs as a diagnostic tool for future research.
Materials and Methods
All procedures were conducted according to the principles of the Declaration of Helsinki and were approved by the Dokuz Eylul University, Ethical Committee (protocol number: 2020/16-02). All participants signed an informed consent form before participating in the study.
Participants
A total of 71 elderly individuals with ARHL (mean age ± SE: 72.76 ± 0.65 years, age range: 65-85 years, 38 females, 33 males) participated in the study. Pure-tone thresholds were measured in the frequency range of 250 to 8000 Hz for air conduction and 500 to 4000 Hz for bone conduction using an Astera 2 audiometer (Otometrics, Madsen, Denmark). The mean hearing thresholds for the right and left ear of participants are provided in Figure 1. Tympanometry and acoustic reflex tests were conducted using a Zodiac 2 acoustic immittance meter (Otometrics, Madsen, Denmark).
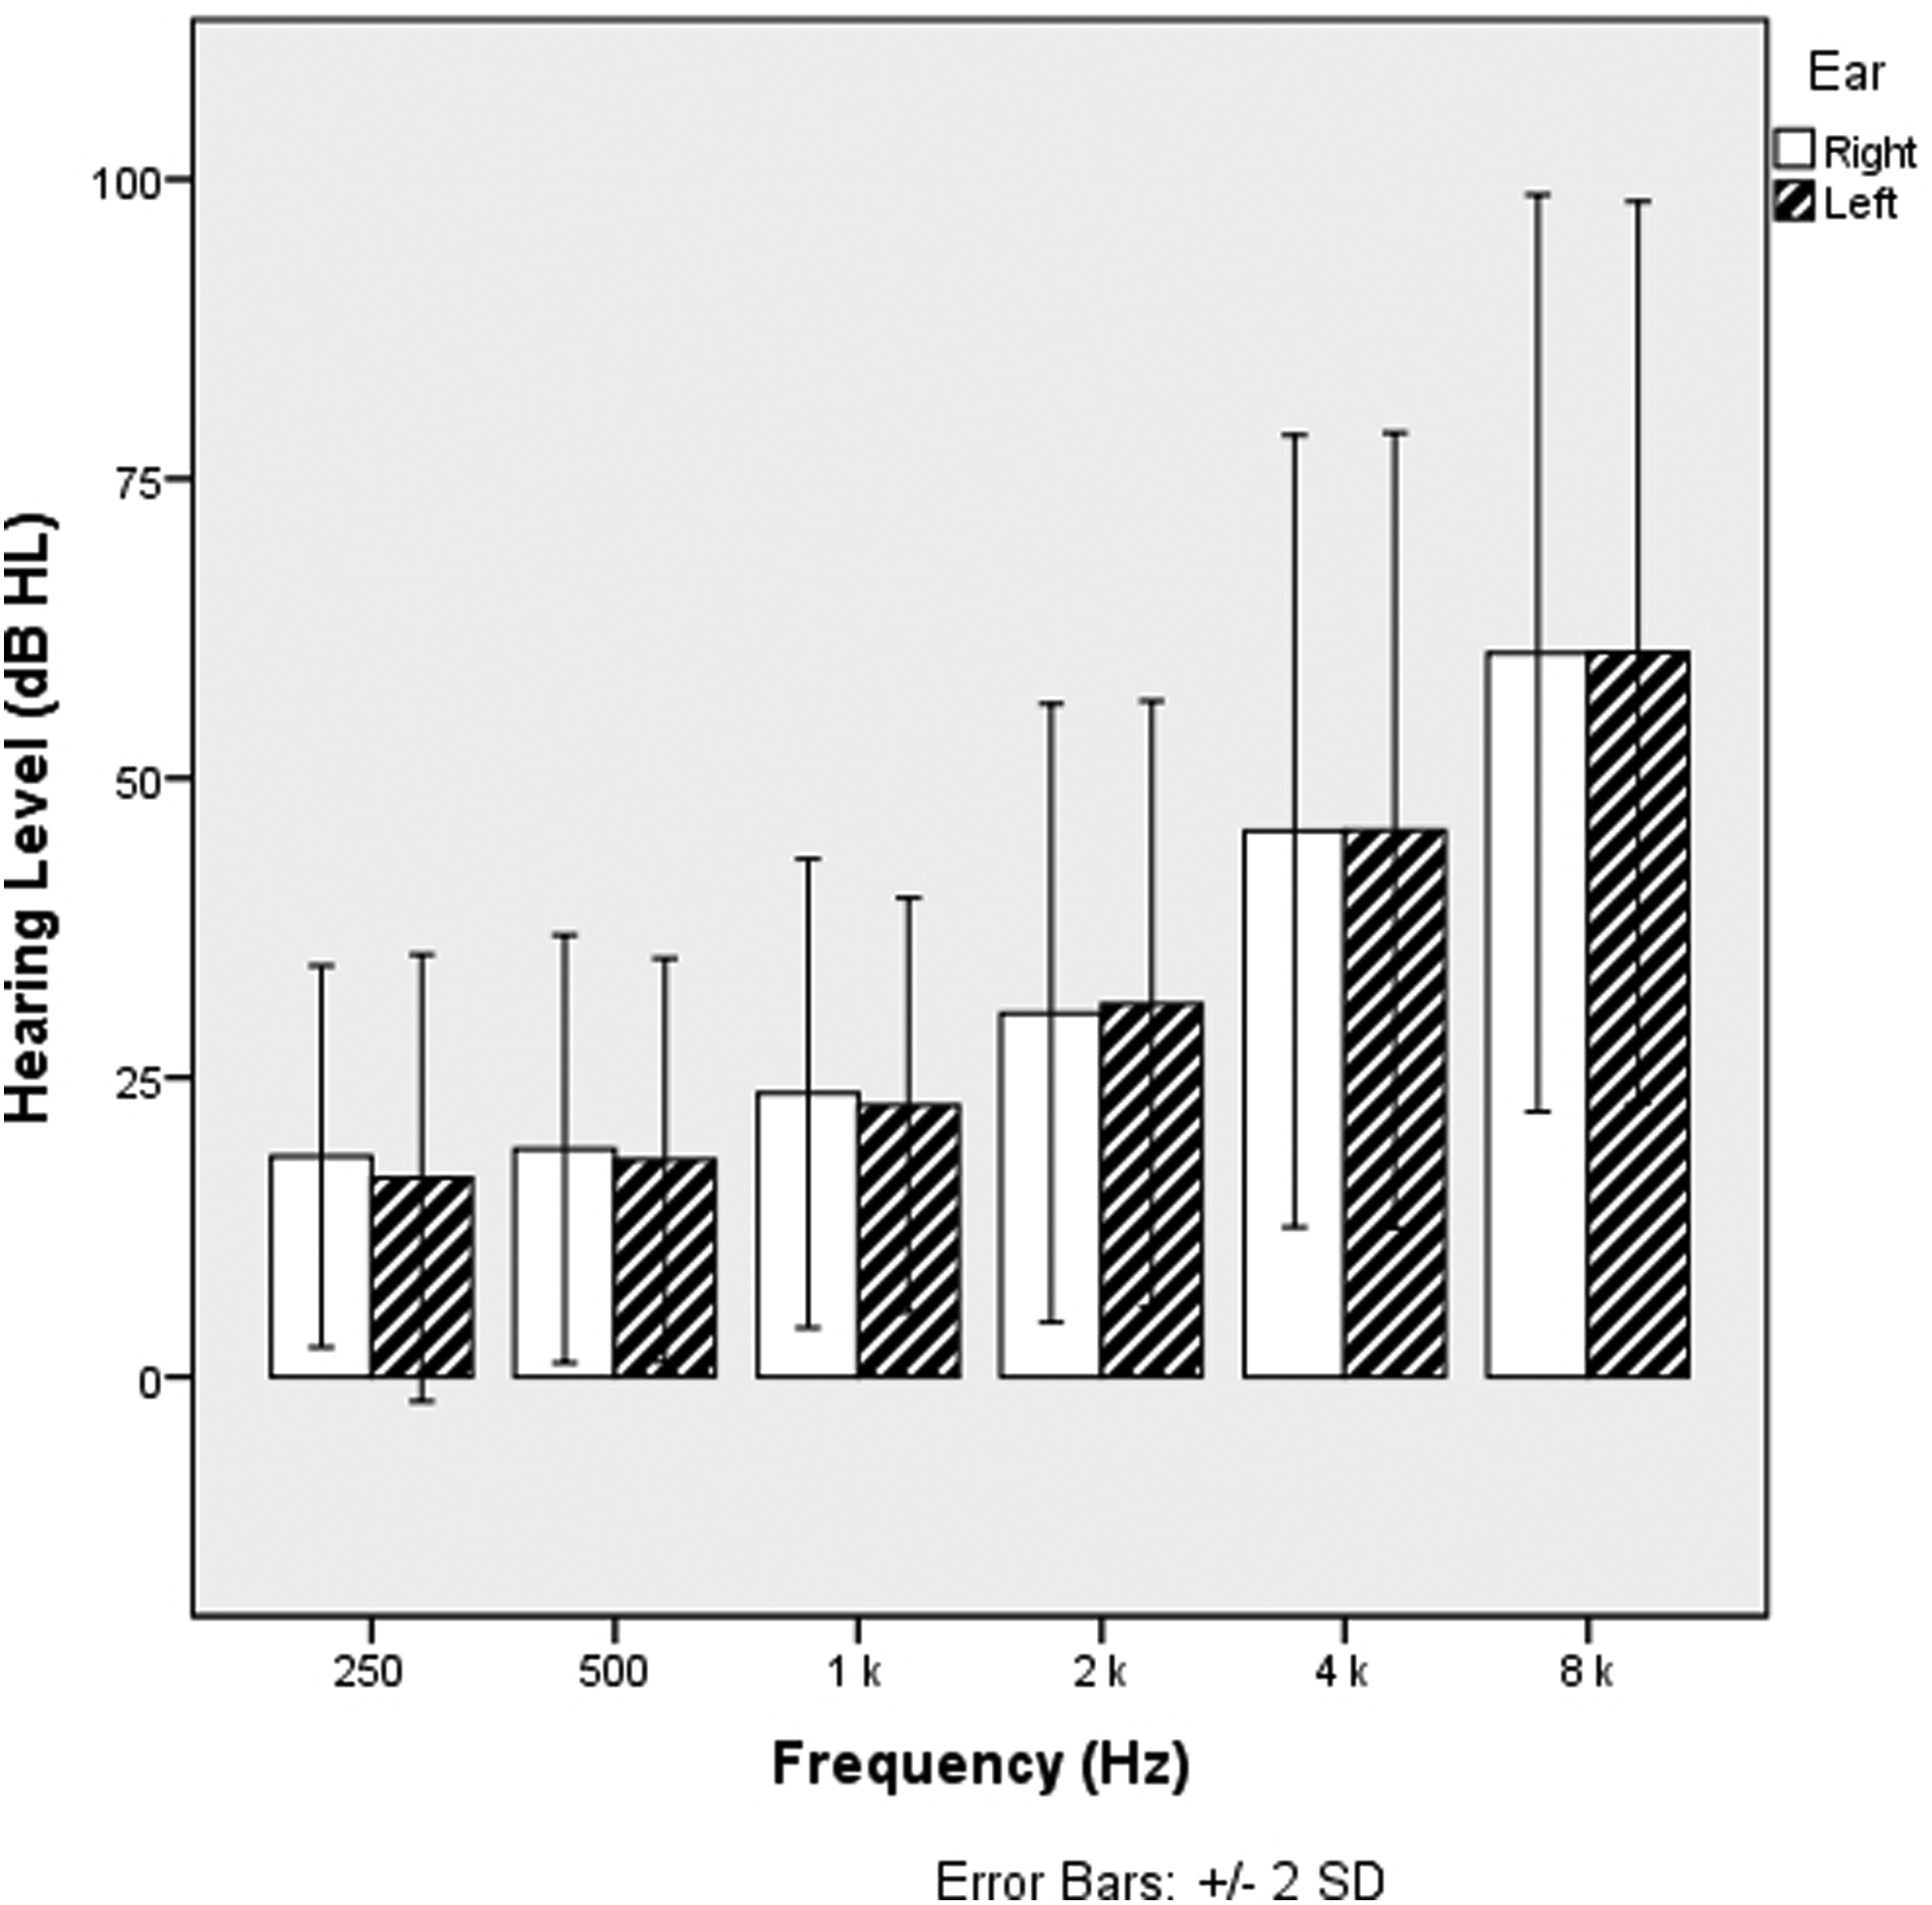
The mean hearing thresholds for the right and left ear of participants. Vertical lines represent the ±2 standard deviation of each mean.
The inclusion criteria for the study required participants to be adults aged 65 years or older with normal hearing to mild hearing loss (pure-tone average (PTA) of 0.5, 1, 2, and 4 kHz ≤ 40 dB HL). Tympanometry and acoustic reflex test results were required to indicate normal middle ear function. Participants with hearing loss were required to have a hearing profile consistent with ARHL, characterized by symmetrical high-frequency SNHL with no air-bone gap and interaural threshold differences below 15 dB across the 0.5-4 kHz range. There was no significant difference between the PTA values of the right and left ears (unpaired t-test, t = 0.174, df = 140, P = 0.862). Subjects with an otologic or neurological medical history, a history of hearing loss or experience with hearing aids were excluded.
Stimuli
A sudden onset and a 21-ms duration speech signal was used as the CAEP stimuli. This was a voiceless burst signal extracted from a recorded speech consisting of the /g/ phoneme. This method was implemented based on its effectiveness in demonstrating age-related changes in CAEPs. 19 In addition, the energy spectrum of the signal exhibited a peak at approximately 1250 Hz, with the majority of its energy concentrated within the 500-1500 Hz frequency range. Hence, this was deemed suitable for our study's objective because of its lack of energy at high frequencies. A custom-made two-channel amplifier and 3A insert earphones were used to monaurally introduce the stimuli. The stimuli were presented at a constant level of 85 dB SPL (broadband linear weighted, Brüel and Kjær, 2250, Denmark) to the better ear of participants (34 right ears, 37 left ears). By using this high-intensity level of stimulation, we ensured the stimulus's energy spectrum was audible among all participants.
Data Recording
Cortical responses were recorded using the HEARLab system (Frye Electronics, Tigard, OR) with electrodes positioned at the vertex midline (positive), contralateral mastoid (negative) and forehead (ground). Raw electroencephalographic signals were collected within a duration window of −200 to 600 ms. The band pass filter was set with cutoff frequencies of 0.2 and 30 Hz, and the artifact rejection threshold was established at 150 μV. Each waveform was derived from the average of 200 epochs. During the CAEP measurements, to ensure alertness, the participants were seated in a recliner chair in an acoustically isolated room and instructed to watch a soundless documentary film on DVD.
Upon confirming the replicability of the waveforms, the two waveforms were subsequently averaged to yield a unified waveform for each participant. The initial negative peak at approximately 50 ms, the subsequent negative peak at approximately 100 ms and the ensuing positive peak at approximately 200 ms are marked as P1, N1, and P2, respectively. The analysis windows were set as follows: 30-100 ms for the P1 peak, 75-175 ms for the N1 peak and 150-275 ms for the P2 peak, following established guidelines. 27 CAEP amplitudes were determined on the basis of the highest values within these specified time intervals. Latencies were extracted from the coordinates of peak points or midpoint locations when no prominent peaks were present. An observer who was not involved in data collection identified the P1, N1 and P2 peaks. Another observer who was blinded to the participants’ audiometric data independently verified the identified values.
Statistical Analysis
Statistical analysis and graphics were performed using the Statistical Package for the Social Sciences for Windows, Version 25.0 (IBM Corp., Armonk, NY), and Microsoft Excel 2019 (Microsoft, Redmond, WA, USA). Stepwise regression analysis was conducted to explore whether age, pure-tone threshold at 1 kHz, and PTA of 2 and 4 kHz could explain the variance in CAEPs in older individuals. The effect sizes for the multiple regression models were assessed according to Cohen's guidelines, 28 where values of ≥ 0.02, ≥ 0.15 and ≥ 0.35 indicate small, medium and large effect sizes, respectively. The statistical power analysis conducted for the research revealed a statistical power of 71% (0.71) with a medium effect size and calculated using Cohen's f² effect size method. An alpha level of 0.05 was administered for all analyses. The illustrations of the marginal effects of each significant explanatory variable were created using Jeffrey's Amazing Statistics Program (JASP), version 0.18.2
Results
Figure 2 displays the characteristics of the CAEP waveforms for the 71 older participants. Figure 3 illustrates the grand-mean CAEP waveforms categorized dichotomously based on age and PTA at 0.5, 1, 2 and 4 kHz. The N1 peak was identified in all subjects with a mean latency of 93.39 ms (±8.15) and an amplitude of −5.81 (±2.93). Similarly, the P2 peak was identified in all subjects with a mean latency of 183.97 ms (±19.00) and an amplitude of 4.68 (±2.17). However, it is worth noting that most participants did not exhibit a consistent and robust P1 morphology, and this can be attributed to phase cancelation by N1. 29 Consequently, statistical analyses for the P1 responses were not conducted; instead, the P1 data has been presented in Figures 2 and 3.
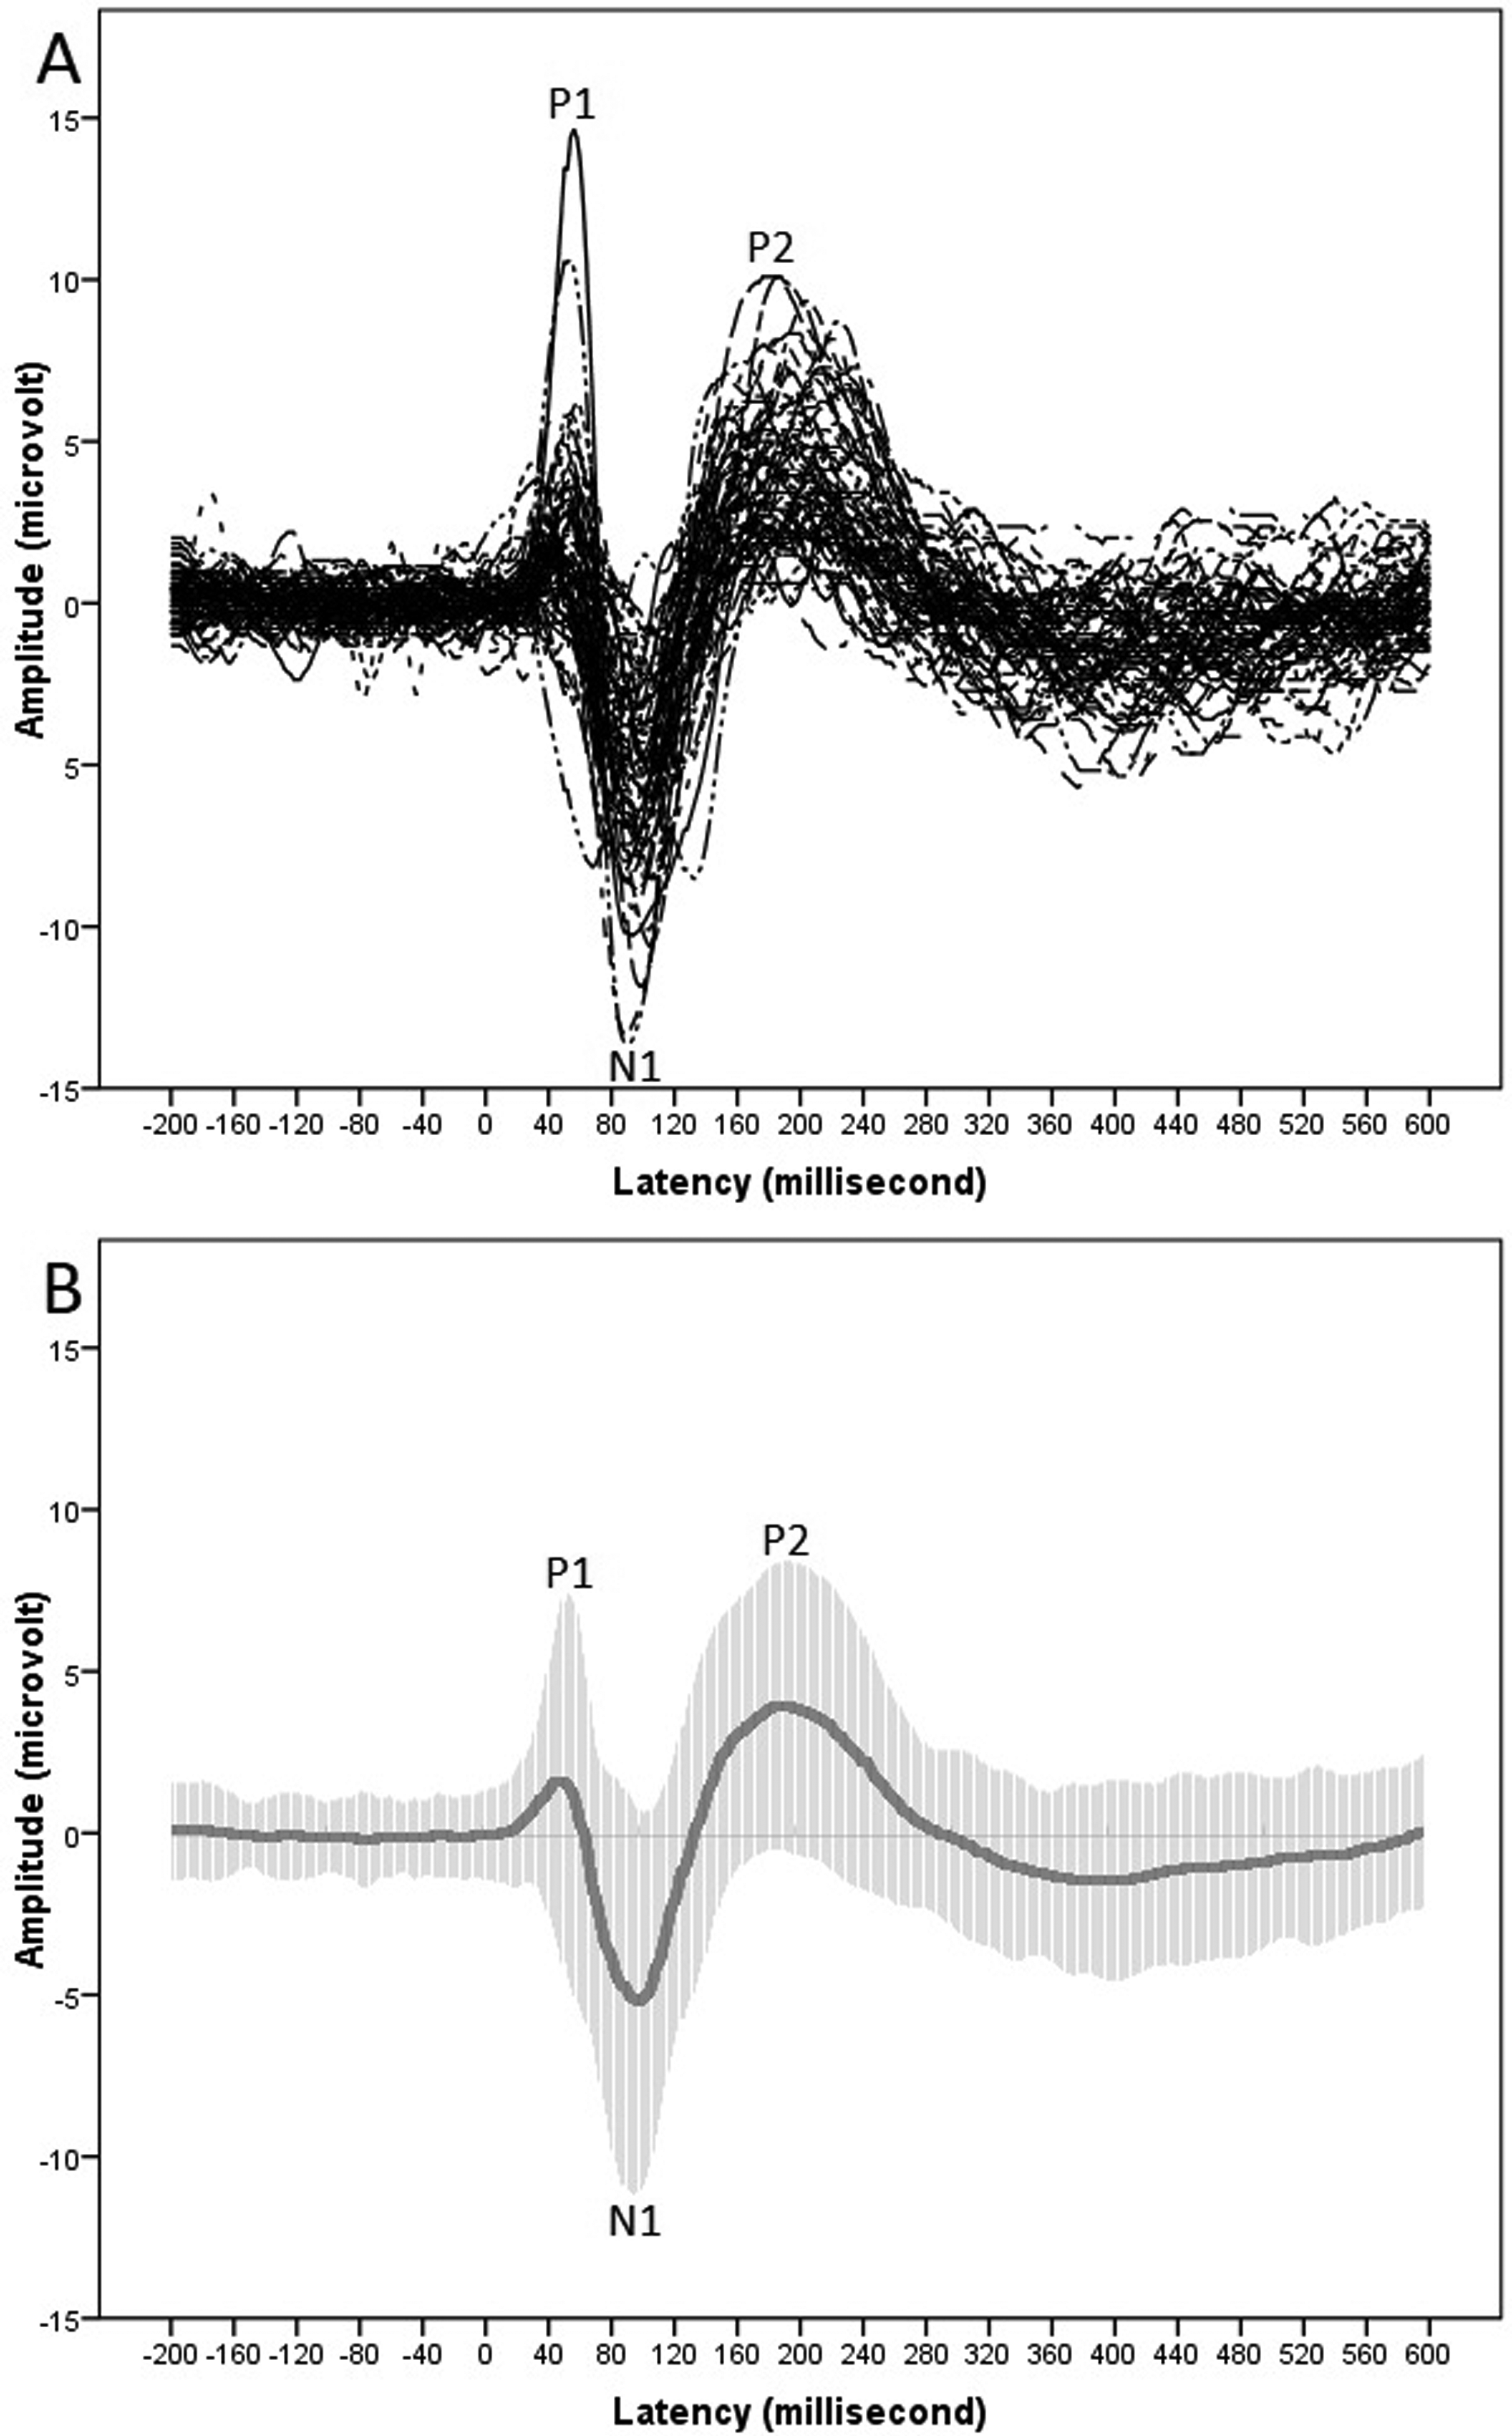
(a) CAEP waveforms for 71 elderly participants. (b) Grand-mean waveforms with ±2 standard deviations in time domain (shaded area). CAEP, cortical auditory evoked potential.
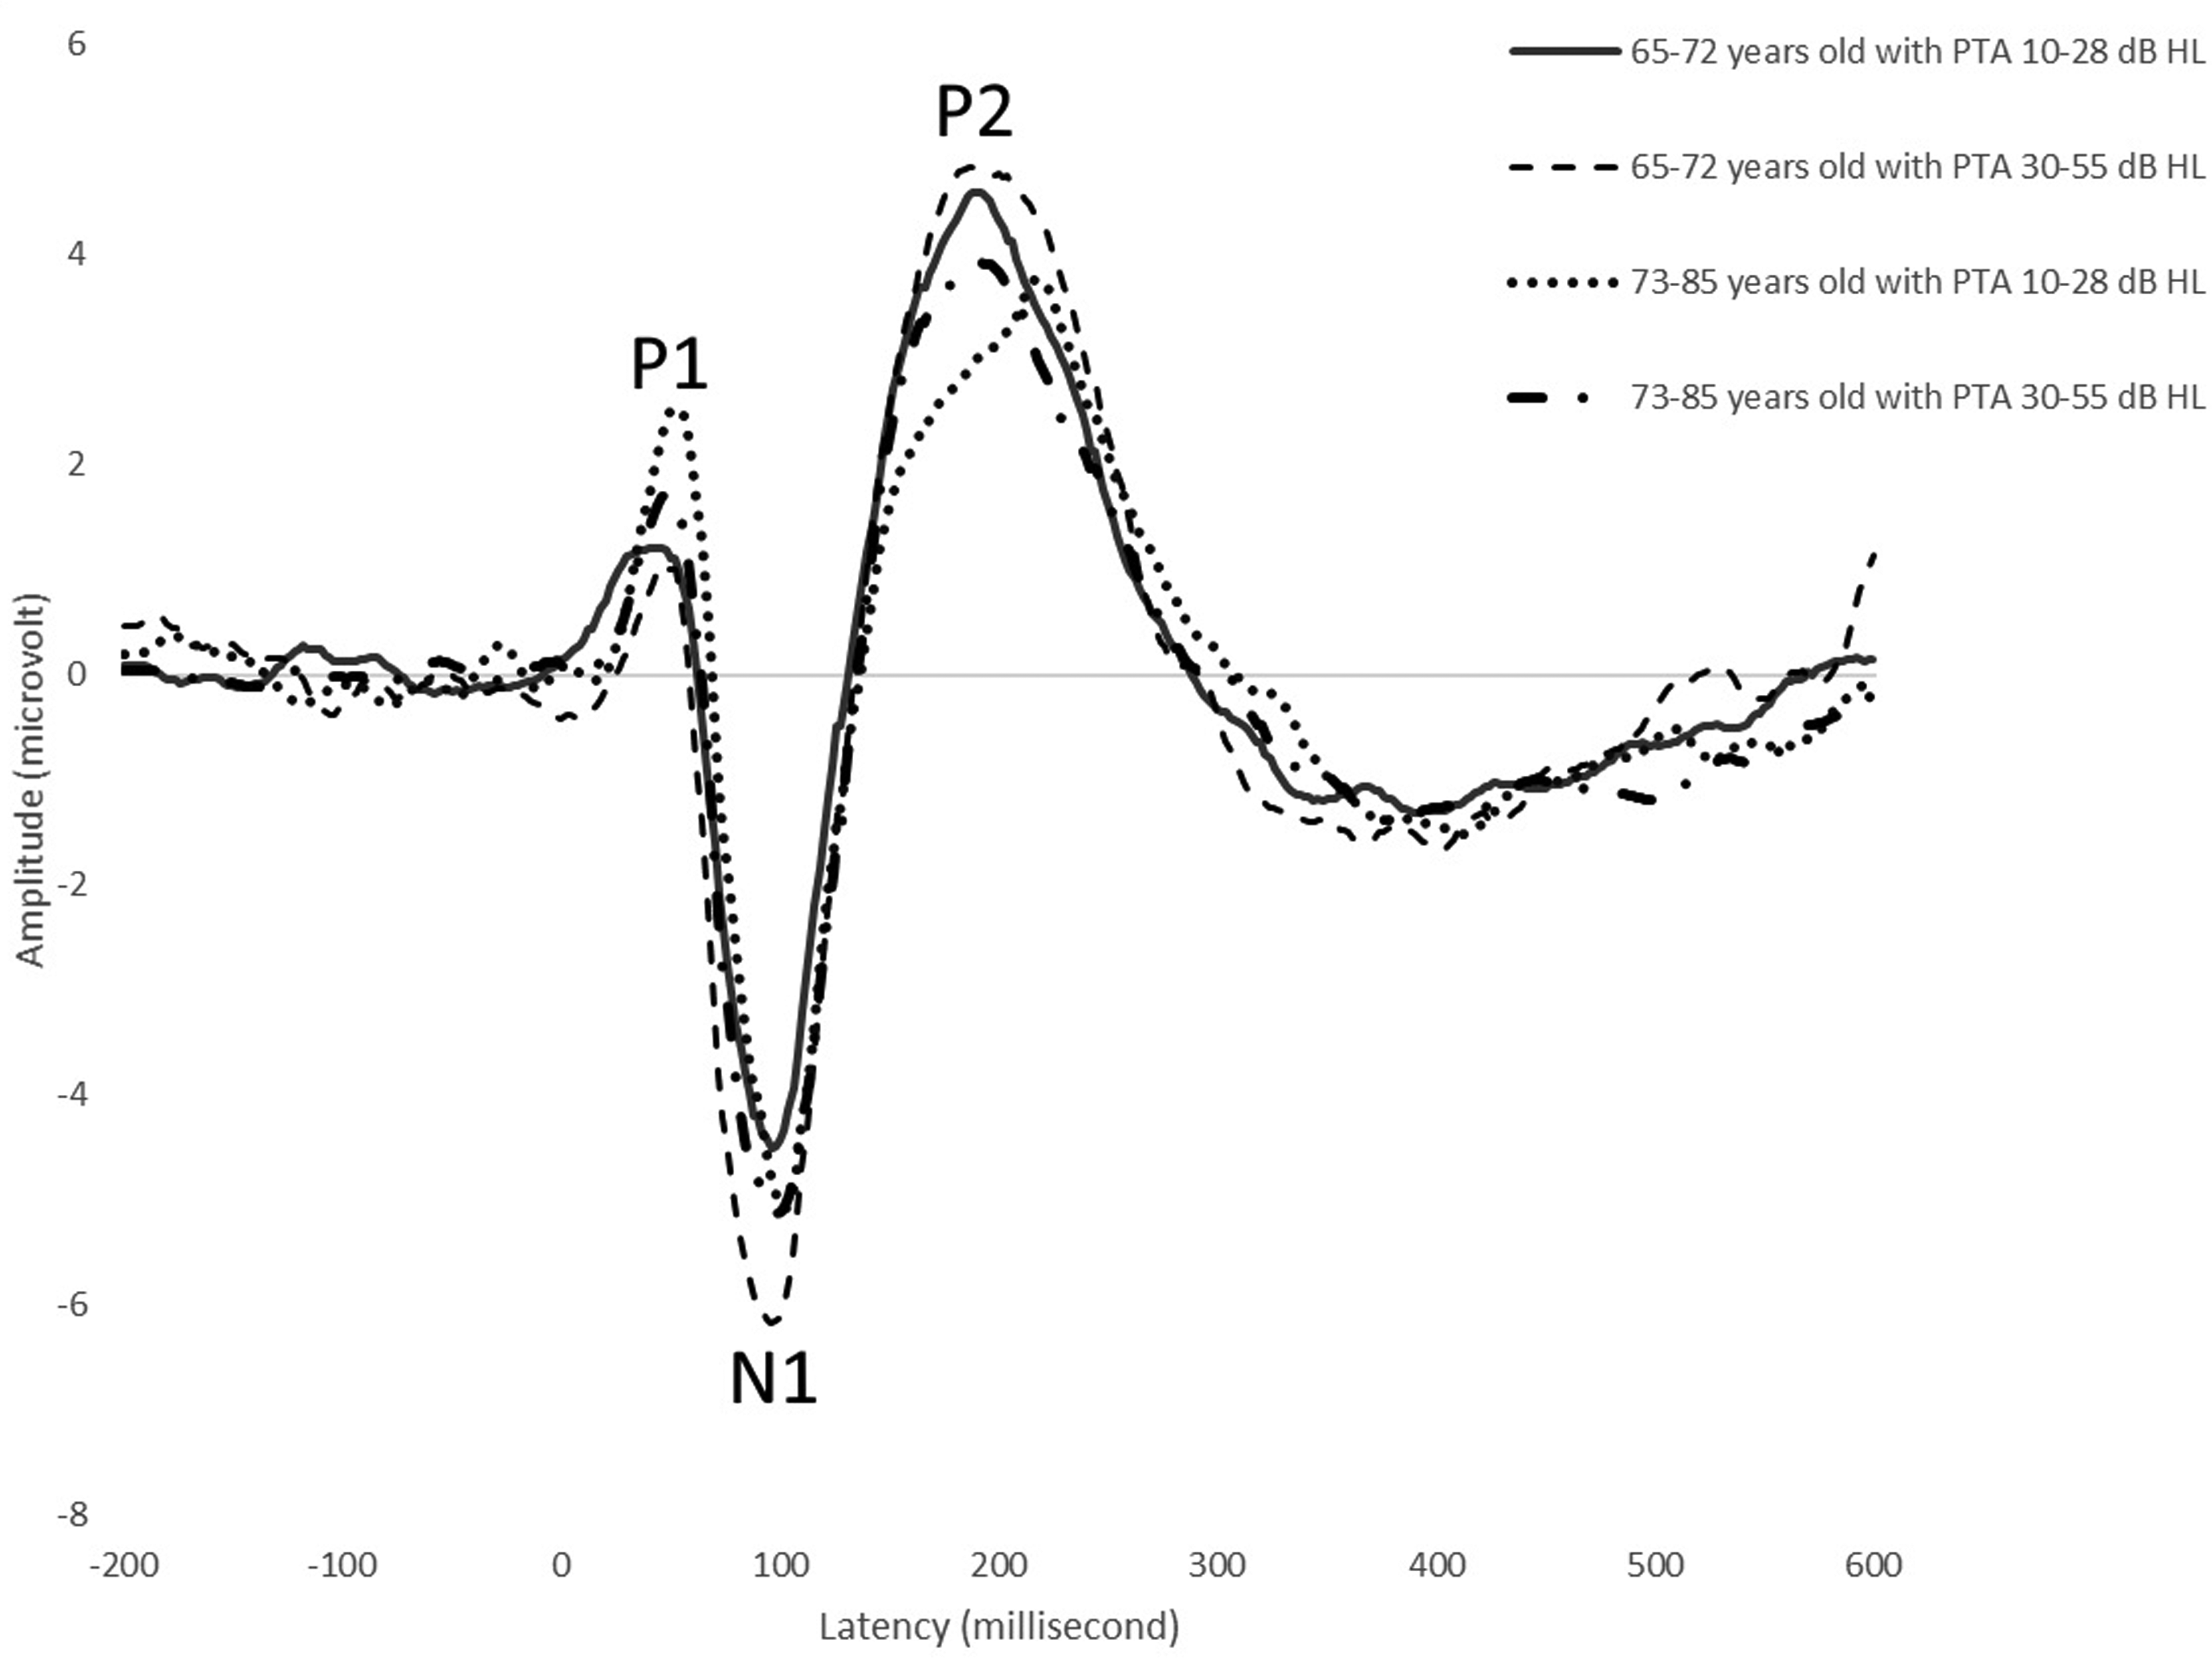
Grand-mean waveforms categorized based on participants’ age and PTA of 0.5, 1, 2 and 4 kHz. Categorization was carried out dichotomously using the medians of age and PTA. PTA, pure-tone average.
All data were examined against the assumptions for multiple regression analysis, which are the prerequisites that must be fulfilled for the results of the regression model to be considered valid and reliable. 30 The assessment of these assumptions including multicollinearity, homoscedasticity, linearity, independence, and normal distribution revealed no indications of violations.
The stepwise regression model yielded statistically significant predictions for various CAEP parameters. For N1 latency, the model was significant (F(2, 67) = 11.569, P < 0.001) with a medium effect size (Cohen's f2 = 0.344), and an adjusted R-squared of 0.234. Age and 1 kHz thresholds both yielded statistically significant contributions to this prediction (P < 0.001).
Similarly, for the N1 amplitude, the model was significant (F(1, 69) = 8.966, P < 0.01) with a small effect size (Cohen's f2 = 0.129), and an adjusted R-squared of 0.102. 1 kHz thresholds emerged as the sole significant explanatory variable of N1 amplitude (P < 0.01).
Regarding P2 latency, the model was significant (F(2, 68) = 6.246, P < 0.01) with a medium effect size (Cohen's f2 = 0.186), and an adjusted R-squared of 0.132. Age (P < 0.01) and PTA of 2-4 kHz (P < 0.05) which significantly contributed to the prediction.
Finally, for the P2 amplitude, the model was significant (F(3, 6) = 5.552, P < 0.01) with a medium effect size (Cohen's f2 = 0.248), and an adjusted R-squared of 0.163. Age (P < 0.05), 1 kHz threshold (P < 0.01), and PTA of 2-4 kHz (P < 0.05) all yielded statistically significant contributions to the prediction. Detailed regression coefficients and standard errors are presented in Table 1. Figure 4 illustrates the actual CAEP latencies and amplitudes in comparison to their predicted values. The marginal effects of each explanatory variable are indicated in Figure 5.
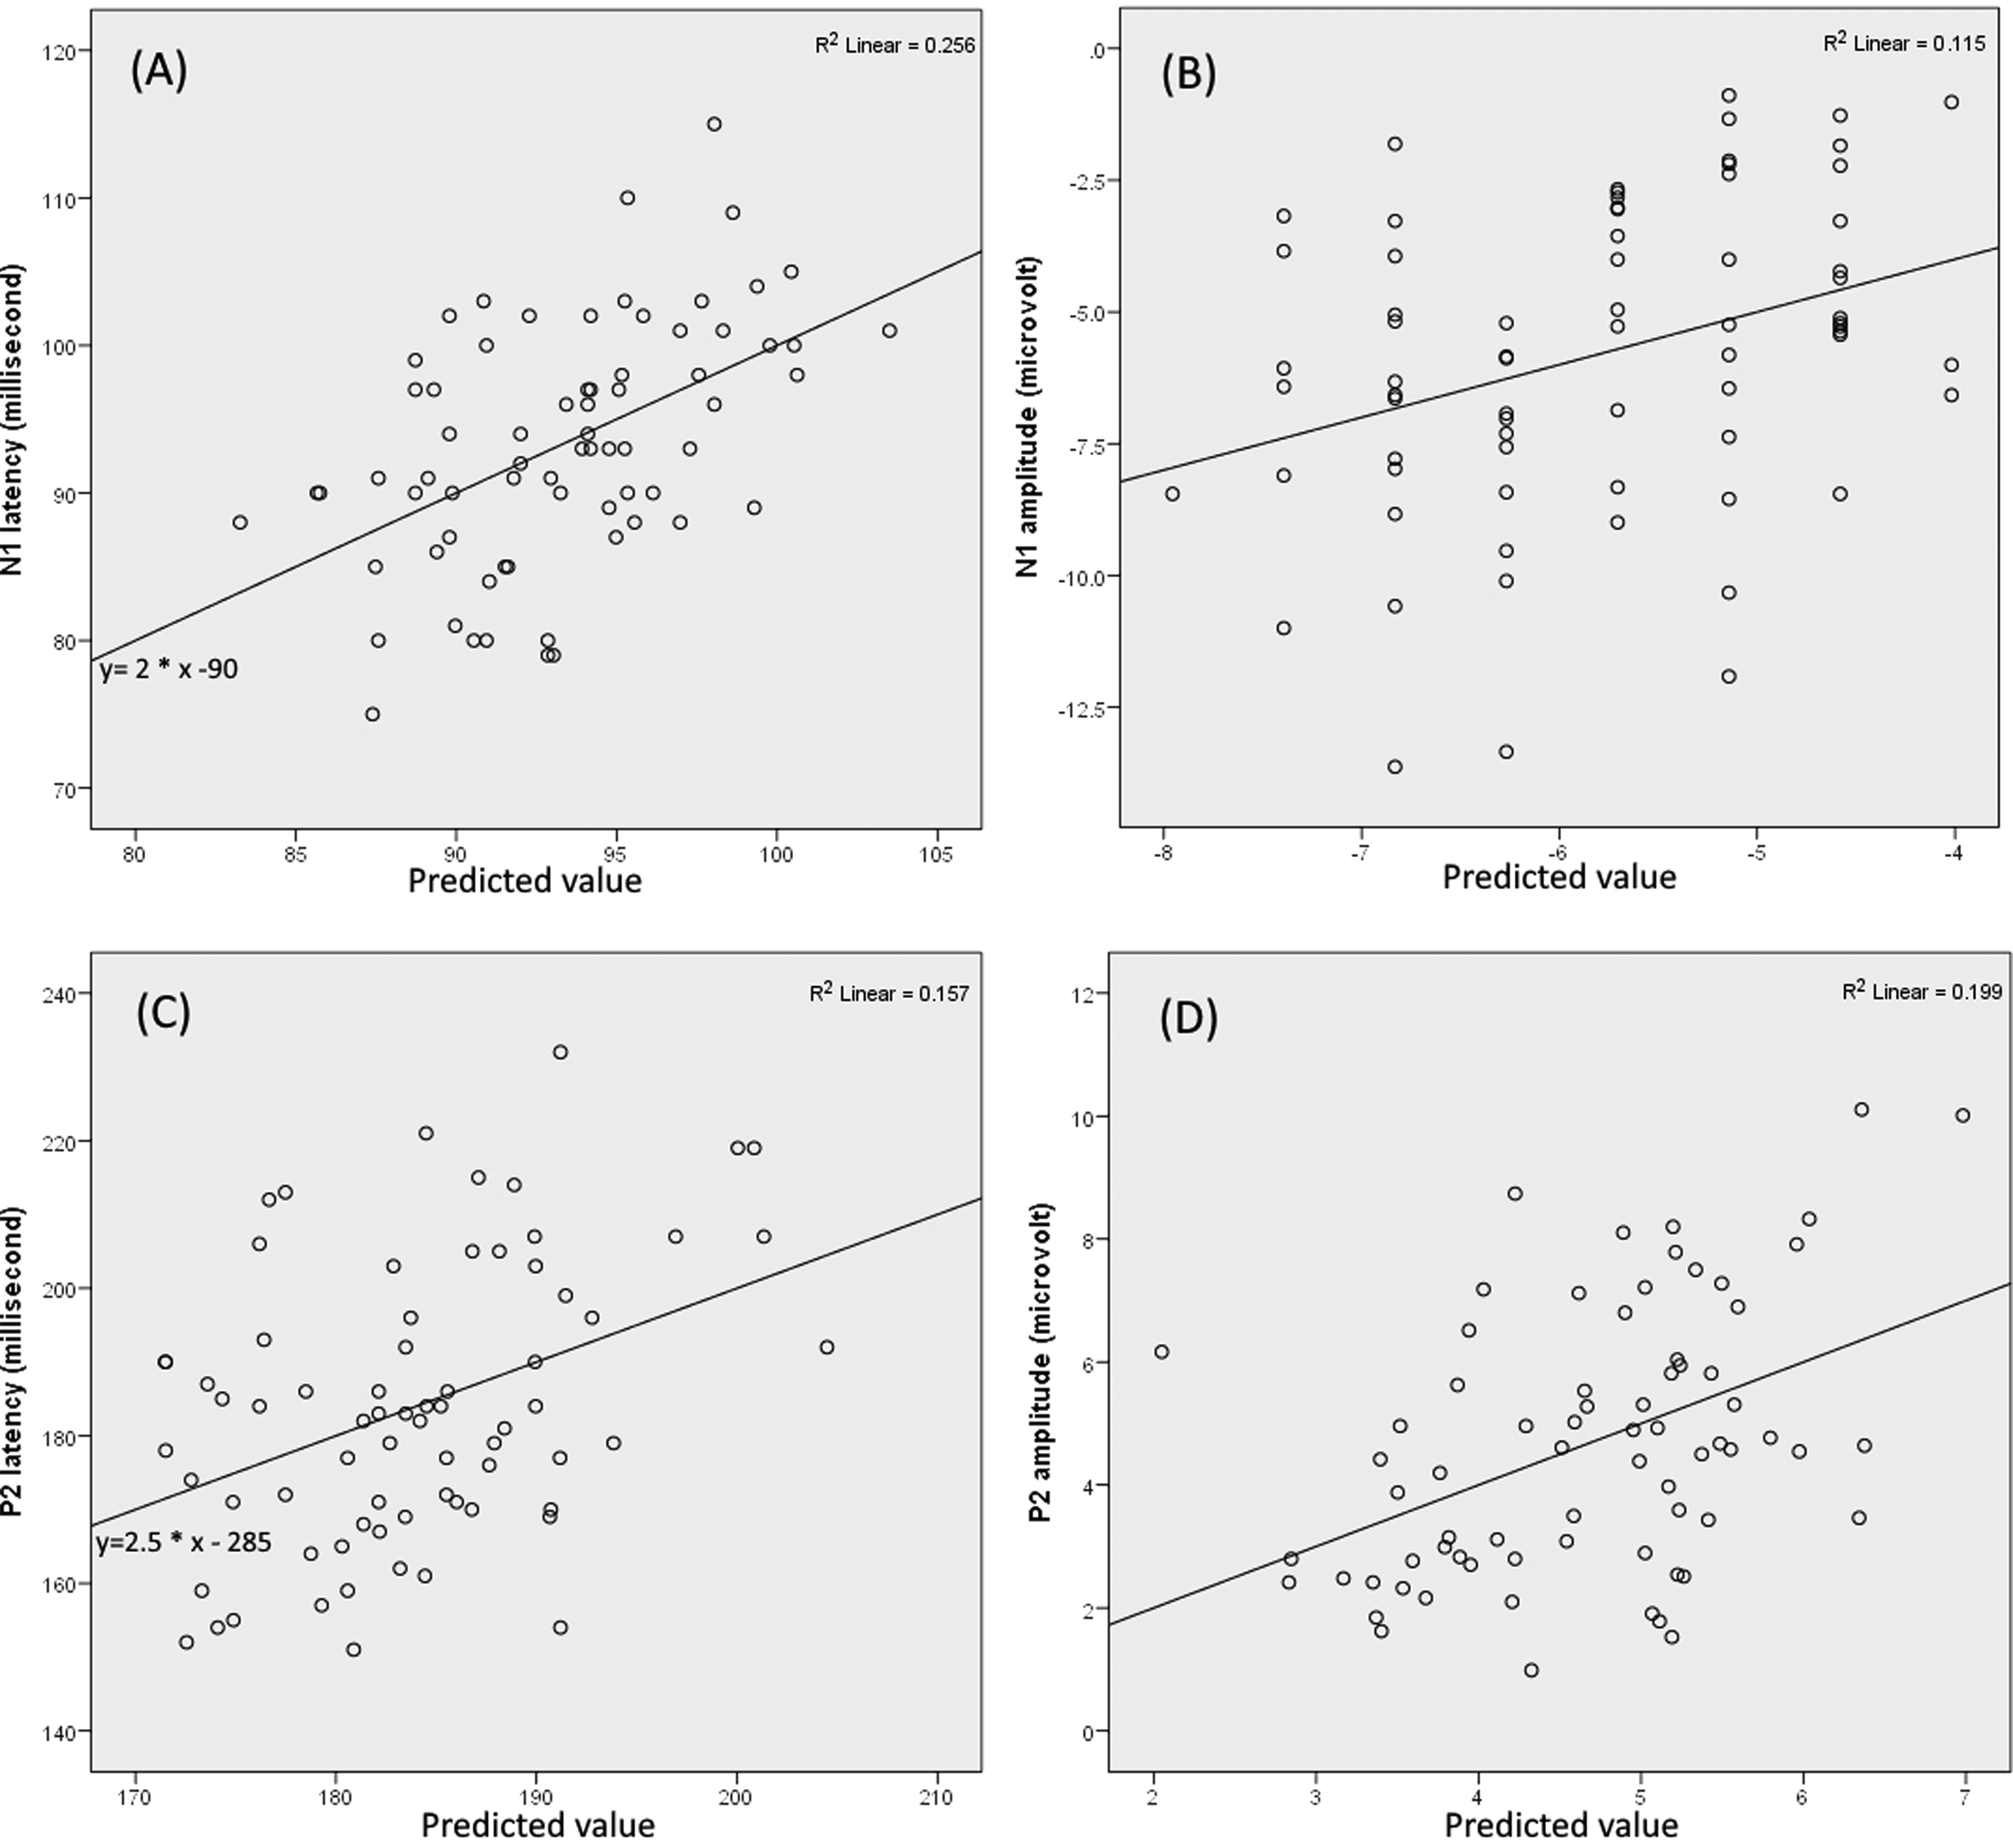
Actual CAEP latencies and amplitudes versus their predicted values. The solid lines represent the fitted lines of the data points. Alongside each line, the equation of the fit line and the R-squared value of the corresponding regression model for each CAEP component are displayed. The scatter plot (a) illustrates the N1 latencies compared to the predicted values obtained from the regression equation: γ=59.188 + (0.577*X1) - (0.364*X2) where X1 represents age and X2 represents 1 kHz threshold. The scatter plot (b) illustrates the N1 amplitudes compared to the predicted values obtained from the regression equation: γ=-3.454 - (0.113*X1) where X1 represents 1 kHz threshold. The scatter plot (c) illustrates the P2 latencies compared to the predicted values obtained from the regression equation: γ=104.996 + (1.296*X1) – (0.417*X2) where X1 represents age and X2 represents PTA of 2-4 kHz. The scatter plot (d) illustrates the P2 amplitudes compared to the predicted values obtained from the regression equation: γ=11.651 – (0.100* X1) + (0.092* X2) – (0.045* X3) where X1 represents age, X2 represents 1 kHz threshold and X3 represents PTA of 2-4 kHz. CAEP, cortical auditory evoked potential. PTA, pure-tone average.
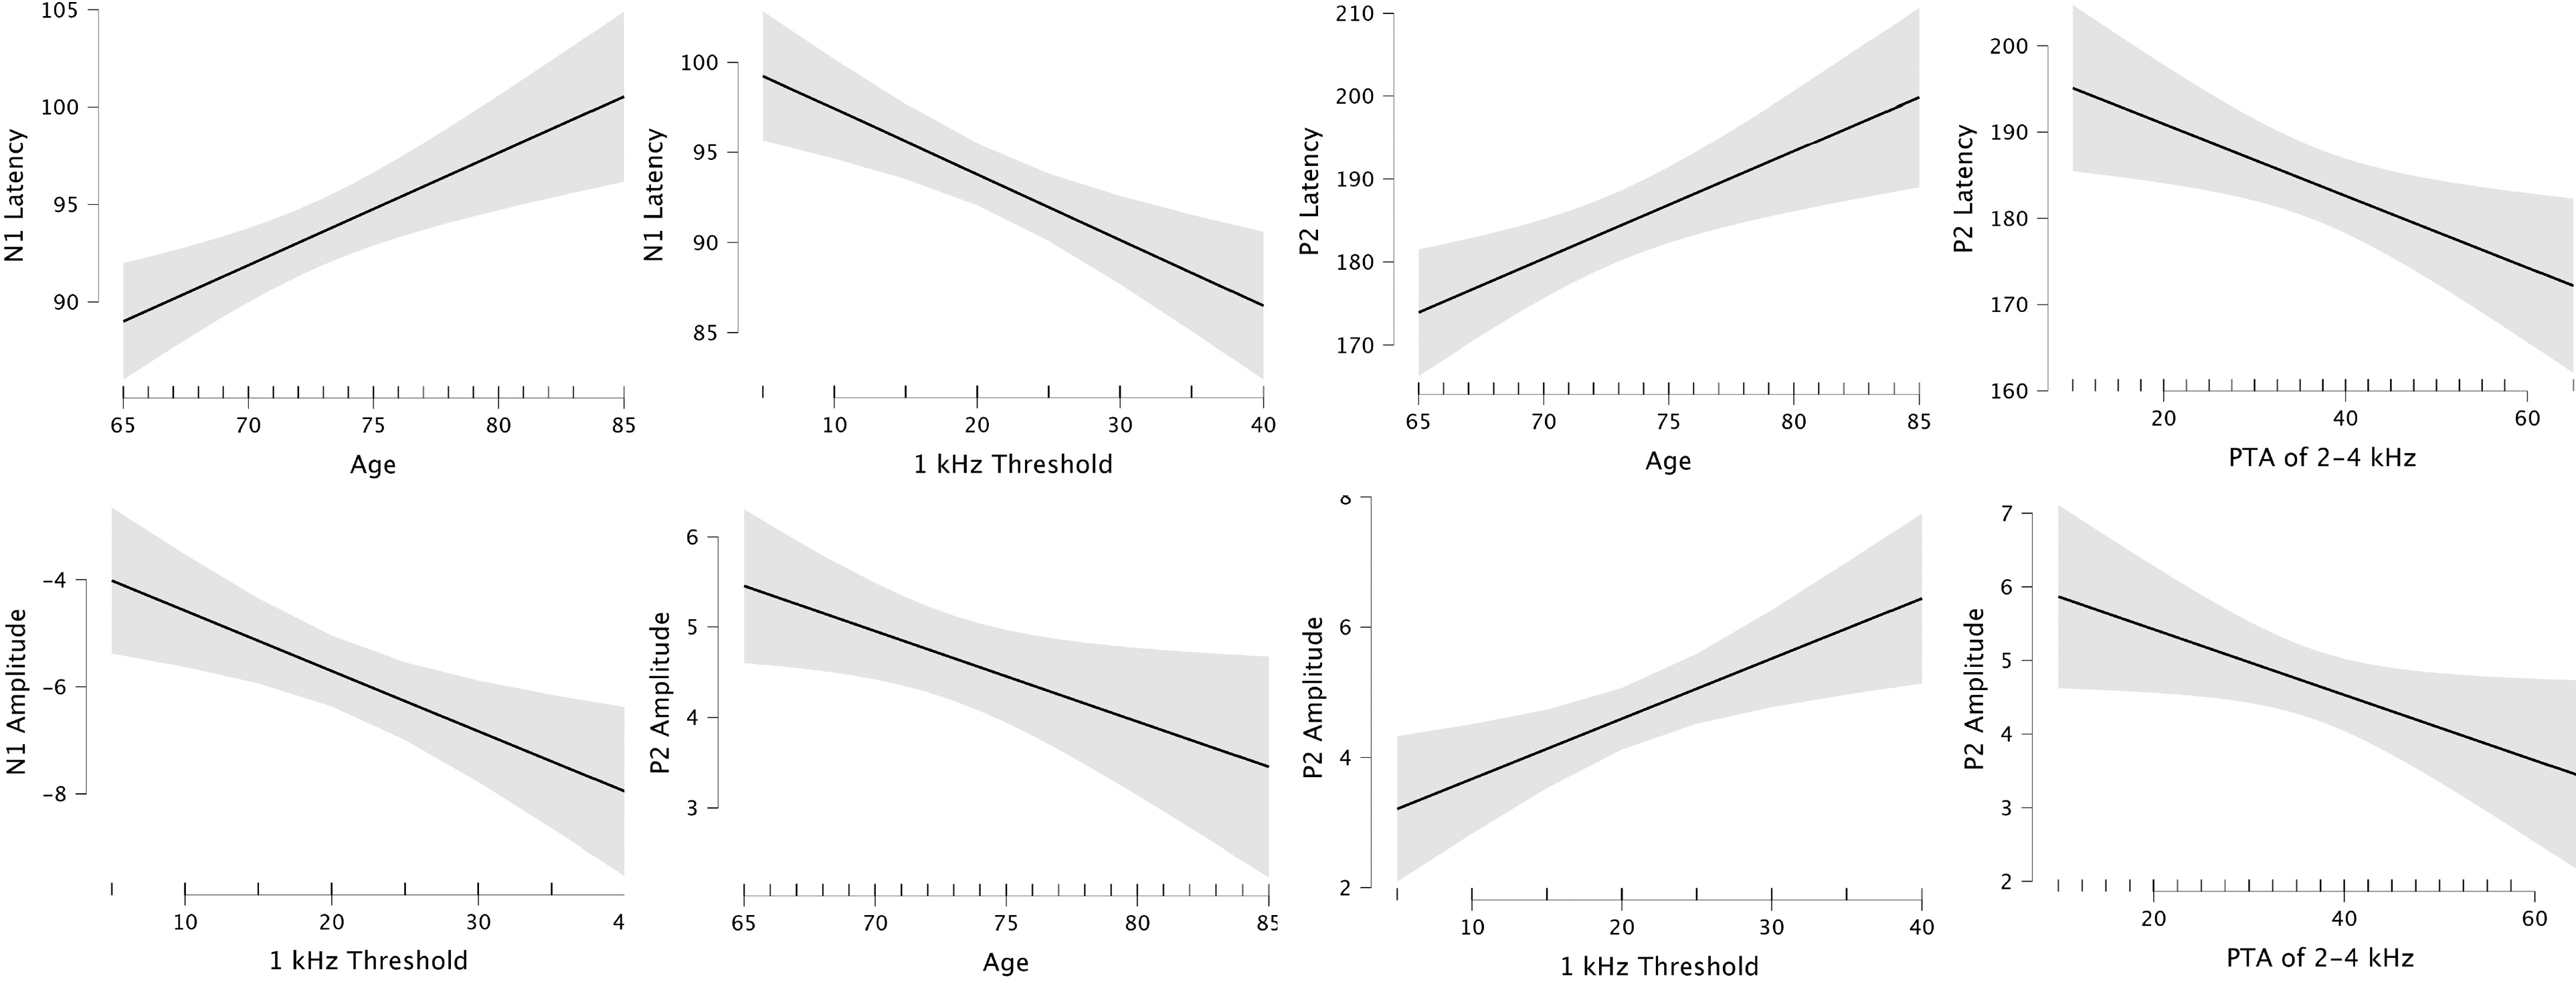
Marginal effects of explanatory variables of the regression analysis illustrating the changes in CAEP latencies and amplitudes corresponding to the changes in each significant variable while holding other variables constant. CAEp, cortical auditory evoked potential.
Regression Analysis for Older Adults with Age-related Hearing Loss.
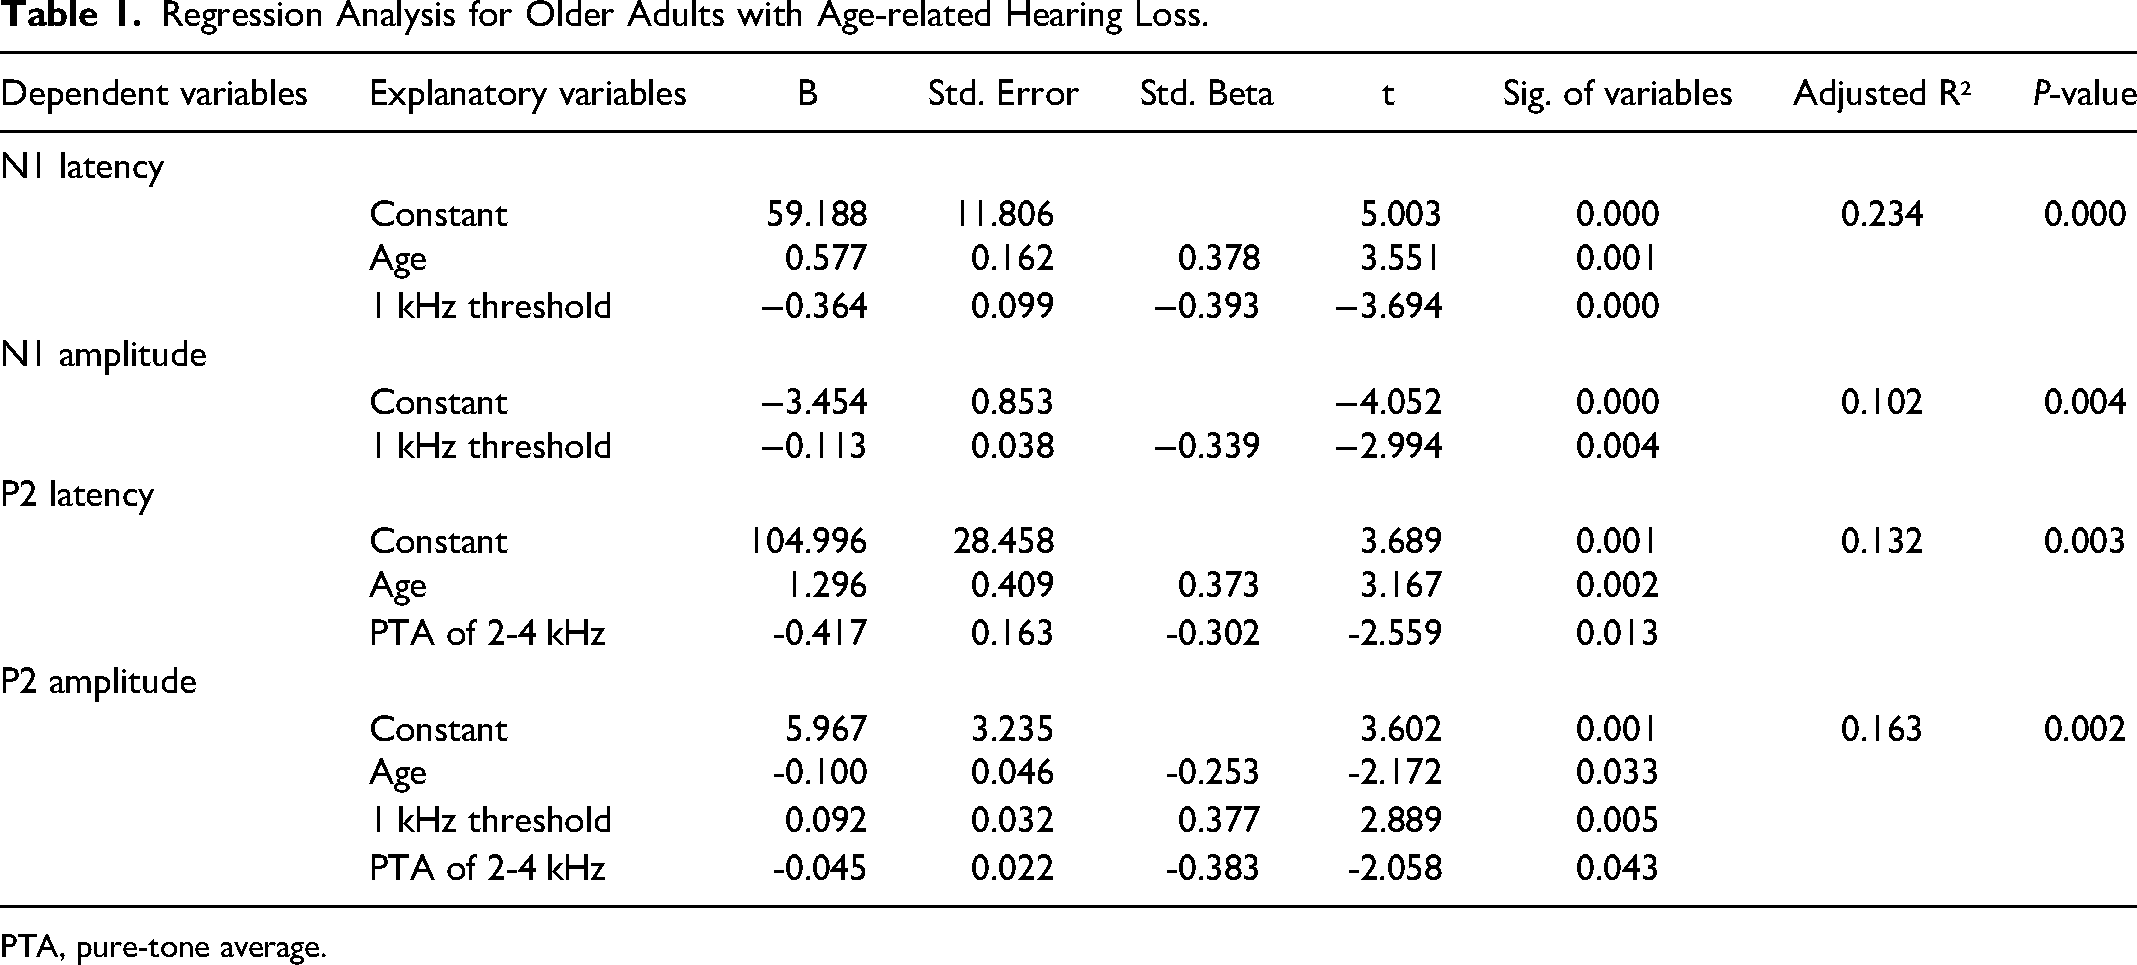
PTA, pure-tone average.
Discussion
There are several unclarified issues related to the impact of ARHL on CAEPs and with this objective, we focused on two key factors: advanced aging and SNHL. We aimed to assess the influence of SNHL by examining two distinct aspects; the first pertaining to factors related to the sensation level of the CAEP test signal.9,24,31 In contrast, the second encompasses other factors related to the severity of hearing loss, such as structural changes in the central auditory system resulting from auditory deprivation.32,33
To disentangle these effects, we used a relatively narrow-band CAEP signal with an energy spectrum largely confined to the 500 to 1500 Hz frequency range. We attempted to determine whether there was an association between the sensation level of the CAEP signal and CAEPs through the 1 kHz thresholds of the participants, which closely corresponded to the energy peak of the CAEP stimulus. In addition, we simultaneously assessed the second aspect using the PTA of thresholds at 2 and 4 kHz. Considering that ARHL primarily manifests as a reduction in high-frequency sensitivity, we concluded that the severity of SNHL would be better represented by a high-frequency-weighted PTA.1-3 Consequently, when interpreting our findings within the research design framework, it is reasonable to infer that the 1-kHz thresholds reflect variations resulting from the sensation level of the CAEP stimulus. In contrast, a PTA of 2-4 kHz is more likely to represent variations due to the severity of SNHL.
Our results display an association between aging and the prolongation of N1-P2 latencies. This finding is consistent with prior research demonstrating prolonged N1 latencies7,9,11,12,19,20,22 and P2 latencies7,11,12,19-23,34-38 suggesting age-related degeneration in the neural processing of sound, resulting in reduced neural synchrony, increased processing time, and inefficiencies in sound processing at the cortical level. In comparison to prior research, our study differs in its examination of the effects of aging on CAEPs during the older stages of life. The results indicate that the impact of aging, leading to a prolongation in N1-P2 latencies, persists into older ages.
Regression analyses have indicated that in conjunction with participants’ ages, their hearing thresholds at 1 kHz and PTA of 2-4 kHz were also significant explanatory variables for N1 and P2 latencies, respectively. The estimates of N1 and P2 latencies in regression models exhibit a positive association with age, as evidenced by positive beta coefficients. In contrast, the contributions of 1-kHz thresholds to N1 latencies and PTA of 2-4 kHz to P2 latencies are characterized by negative beta coefficients (refer to Figure 5). Consequently, these findings suggest that the severity of SNHL and the sensation level of the CAEP stimulus can confound the association between aging and prolongation of CAEP latencies in older adults.
Our results are consistent with those of prior research, indicating an association between enhanced N1-P2 amplitudes and SNHL.7,14,15,19,26,39 An important finding of the current study is that this significant association relies on participants’ 1-kHz hearing thresholds which are crucial for detecting CAEP stimuli. Our results also indicate a significant contribution of age and 2-4 kHz PTA to the prediction of P2 amplitudes. However, this contribution is in the opposite direction compared with the 1 kHz thresholds (refer to Figure 5). These findings suggest that the effect of advanced aging and the degree of high-frequency hearing loss may confound the observed association between SNHL and P2 amplitudes which may explain the inconsistent results reported in the literature.8,12,16,19,20,23,25,40
Another noteworthy result is the observed association between increased 1-kHz thresholds and CAEP amplitudes, even at relatively high sensation levels. Well above their hearing thresholds, a level of 85 dB SPL was used to present the CAEP stimulus to participants (refer to Figure 1). This may suggest that the increase in CAEP amplitudes associated with SNHL reflects issues arising from suprathreshold auditory processing, such as loudness recruitment in SNHL, 15 rather than extra auditory effort for detecting signals resulting from hearing impairment. An explanation for loudness recruitment is the cortical reorganization due to auditory deprivation. Studies employing fMRI and EEG techniques have documented atrophic changes in cortical auditory regions, recruitment of frontal cortical regions and redundant auditory processing in neighboring cortical areas associated with SNHL.41-43
Additional evidence supporting this perspective may be the observed association between the increase in high-frequency thresholds and the reduction in P2 latencies. Indeed, our results, indicating a shortening of CAEP latencies with high-frequency hearing loss, can be best explained by the recruitment of cortical areas resulting from auditory deprivation. This is particularly relevant because high-frequency hearing sensitivity in ARHL can be assumed to be associated with the duration and severity of auditory deprivation in individuals who do not use hearing aids. Considering the factor that the use of hearing aids may compensate for the central changes resulting from auditory deprivation, the participants in this study were selected from individuals with no previous experience with hearing aids.
Limitations
A limitation of the current study is its reliance on single-channel EEG acquisition which captures only a limited aspect of the central auditory system. It is worth noting that despite the availability of multichannel EEG systems in many studies, the majority base their results on data derived from the CZ to the mastoid channel.
Another limitation is that it does not include analyses of data obtained from stimuli of different intensities or structures. The advanced age of the participants led us to minimize the duration of the measurements. Therefore, a basic design suitable for our objectives was employed in this study.
Summary
The results of the current study emphasize the persistence of age-related increases in CAEP latencies throughout the advanced aging period. However, crucial evidence has been obtained, particularly indicating the attenuation of the observed relationship between N1 latencies and advanced aging. This attenuation was associated with the increase in hearing thresholds responsible for the perception of the CAEP test signal. A similar trend was also noted for P2 latencies. Consequently, the increase in high-frequency hearing thresholds diminishes the positive association between prolonged P2 latencies and advanced aging. Another significant finding of this study suggests that the relationship between SNHL, as evidenced in prior research, and increased CAEP amplitudes may be linked to variations resulting from the sensation level of the CAEP stimuli. These findings underscore the confounding effects of aging and SNHL in individuals with ARLH, highlighting the imperative need to control for these variables in future research employing CAEPs.
Footnotes
Declaration of Conflicting Interests
The authors declared no potential conflicts of interest with respect to the research, authorship, and/or publication of this article.
Funding
The authors received no financial support for the research, authorship, and/or publication of this article.
Ethical Approval
This research was approved by Dokuz Eylul University, Ethical Committee (protocol number: 2020/16-02).