
Abstract
The development of new technologies (e.g., three-axial accelerometers) and their implementation to the armed forces made it possible to rather easily obtain data on transportation with regard to cargo securing. It is, however, crucial to evaluate the data, and identify the factors important for the selection of an appropriate cargo securing system. Particular attention should be paid to the transportation on low-quality roads, or possibly in the terrain as it can be expected that the cargo (as well as the vehicle and the driver) is subjected to greater shocks. Data obtained from the military transport experiment have been processed using advanced statistical methods (a contaminated probability distribution, methods of statistical comparison, and an analysis of variance). The transportation data from the use of two military trucks on three different road surfaces has been compared. The results show, in which axes there are statistically significant differences in terms of the frequency of exceeding normatively determined acceleration coefficient values in relation to the road surface type and the vehicle type. Further results are based on the modeling of acceleration coefficients using a contaminated log-normal distribution, where the distribution of acceleration coefficient values is contaminated by outliers resulting from sudden changes in the transport conditions.
1. Introduction
In the European Union, more than three-fourth of all cargo is transported by road.1,2 In 2021, 13,651,391,000 tons of cargo were transported this way within the EU-27. 3 This lays enormous demands on the road infrastructure—its maintenance and repairs, a negative externality can be an effect on the accident rate. 4 In particular, in consequence of the lower quality of road surfaces shocks5,6 greater than those with regard to which a cargo securing system had been selected are often generated. The situation is compounded by substandard technical maintenance of certain vehicles or violation of regulations, such as exceeding the maximum weight of a road vehicle combination or speed restrictions. 7
According to the estimation of the European Commission’s Directorate-General for Mobility and Transport (DG MOVE), as many as one-fourth of truck accidents in the European Union is caused by inappropriate or insufficient cargo securing. 8 For the sake of illustration, according to the statistics of the Police of the Czech Republic (Directorate of Traffic Police Service), there were a total of 10,278 accidents caused by trucks 9 in the Czech Republic in 2021. The total number of accidents that year was 99,332 (18,156 of them with injuries or death). It follows from the above-stated estimation that inappropriate or insufficient cargo securing was the cause of approximately 2570 accidents and about 10% of them are with injuries or death.
The situation is even worse in case of specific transports, where further risks may also be involved: emergency supplying, transportation of hazardous materials, transportation of oversized cargo, or military transportation. Out of these, the focus of the paper is the transportation on low-quality roads, 10 which is typical primarily of the military transportation or the emergency supplying system.
The issue in question has become the subject of several monographies and a number of papers, most of which, however, do not deal with the specifics mentioned above.
Monography 11 is concerned with cargo transportation, handling and securing in road transportation, and it also mentions negative experience from practice. The monography also discusses the methods of cargo securing as defined by international and European standards. Another publication 12 deals with the general principles of cargo securing in road transportation by means of textile leashing, including the analysis of the efficiency of selected securing systems. The paper follows on the previous publication, 13 which is similarly focused on cargo securing in road transportation, including the functions of packaging and the creation of handling units, and it also discusses the physical properties of selected securing systems.
Expert papers in periodicals are concerned with both the standards of cargo securing at the national, European, as well as international levels. The expert papers are that of Jagelcak 14 , Linins and Berjoza, 15 Zong et al., 16 and Ciesla and Hat-Garncarz, 17 European (national as well) standards are especially EN 12640, 18 EN 17321, 19 EN 12195-2, 20 or international regulations EC-DG MOVE. 21 Complementary issues solve and the modeling of vehicle dynamics by means of simulating SW, e.g., CTU Code, 22 Neumann, 23 Cheng-qiang et al., 24 García et al., 25 Wenhai et al. 26
The basic motivation for this paper is that publications do not provide an analysis of situations where a driver (or possibly a person responsible for loading) has followed effective standards and regulations in cargo securing, and yet the lashing has loosened, or possibly an accident has been caused as a result of higher than assumed inertia forces. They concentrate mainly on the deliberate violation of regulations that are a matter of management rather than logistics and transportation.
The general outcome of the paper is to consider the possibility of using modern sensor technology to improve road safety and support the commander’s decision-making process. The paper will specifically focus on the deviations from key standards, and to analyze differences between the vehicles tested on three defined road surfaces. For that purpose, a number of statistical methods was employed that are not commonly used in the field under consideration (a contaminated distribution, outliers detection, an analysis of variance). These statistical methods are used by authors dealing with transport issues, but they are applied to other areas. For example, analysis of variance is used in Kummar et al. 27 to find significant difference in roadway capacity and critical speed at difference compliance levels or in Choi and Kim 28 to analyze critical aggressive acceleration values and models for fuel consumption. The log-normal distribution is used as a potential model for the frequency of the primary delay duration in the article. 29 The authors Ponnu et al. 30 found that the combination of Weibull and Extreme Value mixture distribution gives the best fit for modeling time gaps at observed flow levels. The authors have faced the problem of outliers, for example, when modeling travel demand 31 or measuring cycling accessibility in metropolitan areas. 32 In the field of defense modeling and simulation, the above methods and models can be found, for example, in the articles.33–35 The application of a contaminated log-normal distribution, which is based on publication, 36 represents a new approach to the evaluation of transportation data (acceleration coefficients according to EN 12191-1). 5 It allows assessing the magnitude of inertia forces in the stationary mode. Subsequently, the effect of the factors (the road type and the vehicle type) on the magnitude of acceleration coefficients can be expressed numerically by means of a two-way analysis of variance, the employment of which, for the evaluation of transportation data, the authors of the paper have not found in any of the available literature. At the same time, the paper points out that increased attention needs to be paid to cargo securing under non-stationary conditions.
The secondary goal is to present the potential of up-to-date sensorics for the road transportation evaluation. The paper is a follow-up to the previous publications, in particular.36–38
2. Materials and methods
2.1. Materials
The data for processing was obtained from transport experiments conducted at a military training polygon (refer to Figure 1) in Podivice (Brezina military training area, district of Vyskov, South Moravian Region, Czech Republic) using two off-road military trucks Tatra (T810 and T815) on three types of surfaces (refer to Figures 2–4):
granite cobbles (green surface—1700 m), size 15/17 cm foamed by concrete,
an unpaved road (blue surface—1550 m),
concrete blocks (red surface—170 + 130 m), size 3 × 2.5 m. 38
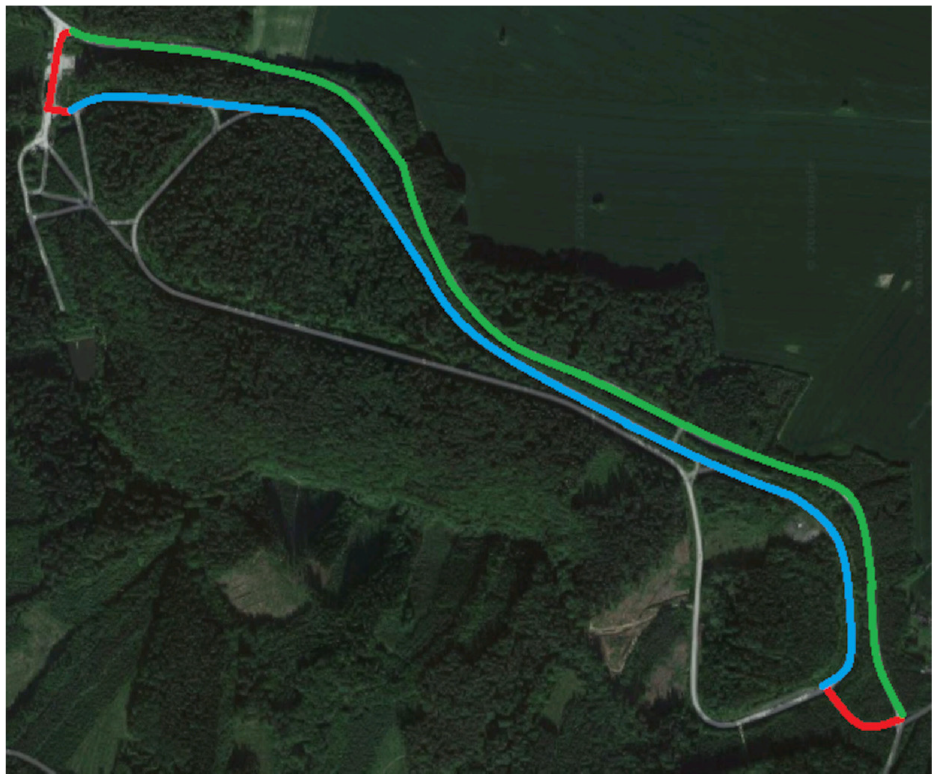
Military training polygon in Podivice—sections of the road. 38

Green surface—granite cobbles.
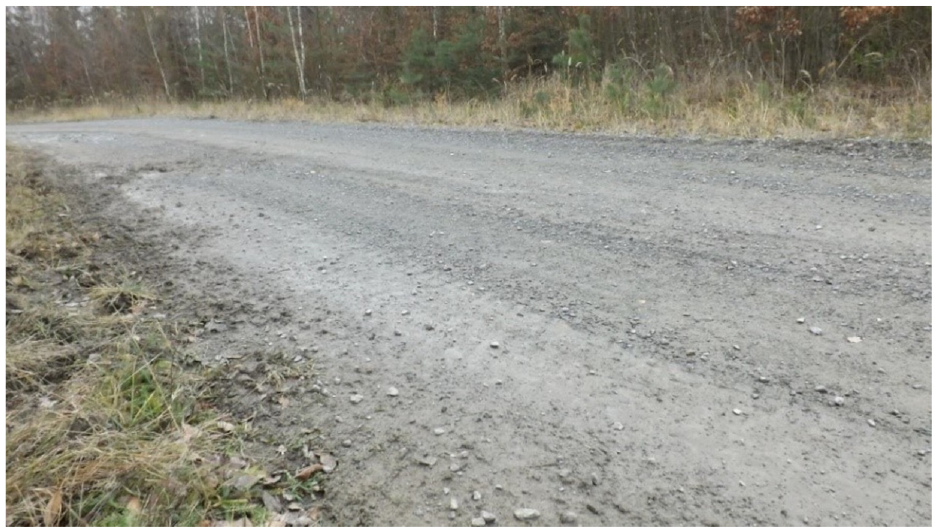
Blue surface—unpaved road.
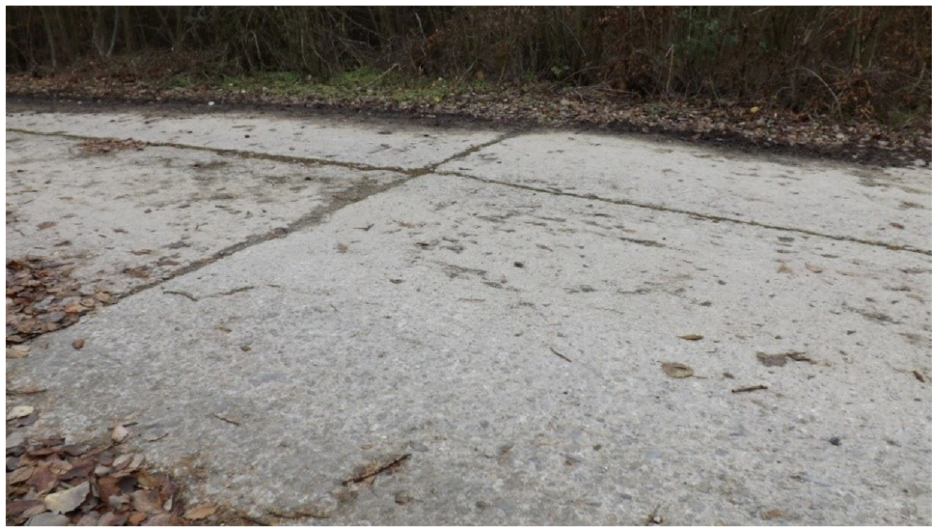
Red surface—concrete blocks.
The surfaces are typical for the military freight transports. In total, 10 measurements were taken (10 rounds) on each vehicle with comparable average speed (ranging between 9.7 and 10.0 m/s). Hence, relatively identical data sets were obtained for the T810—the total of 10,827 values in all three axes—and the T815—the total of 10,731 values in all three axes.
The transport experiment was conducted without the cargo in order to provide comparable outcomes that can be considered as the least favorable if compared to a fully loaded vehicle. 39 The polygon surface was dry, there was very good visibility and no rainfall during the transport experiment. The outdoor temperature ranged between 5°C and 10°C. For the purpose of recording the shocks—multiples of normal acceleration of gravity g, or possibly the values of the acceleration coefficients—the following measuring device was used: three-axial accelerometer with calibration certificate OMEGA-CP-ULTRASHOCK-5 with the measuring range of ±5g. 38
2.2. Methods
The analysis of the statistical data obtained from the transport experiment was based on descriptive statistics and a graphical representation of the data.
In order to compare the frequencies of exceeding normatively determined acceleration coefficient values for the individual vehicles and individual surfaces, a test of equal proportions (a test of equality of the parameters of two samples from a Bernoulli distribution) was employed. 40
As the values of the acceleration coefficients obtained on a specific surface are sometimes (with lower frequency) affected (contaminated) by sudden changes (shocks) due to the surface specifics (an uneven surface, pot-holes, chuckholes, etc.), and also inevitable driver’s responses (hard braking, diverting from the driving direction, etc.), a contaminated probability distribution 36 was employed in further analysis for the modeling of the statistical distribution of acceleration coefficients, with the density as follows:

where
For the verification of the density type
For the assessment of the effect of the surface type and the vehicle type on the magnitude of acceleration coefficients in the stationary mode, a model of the analysis of variance (two-way classification with interactions), was used. 42
In the stationary mode and for the respective axis,

for
2.3. Research questions
Research question 1: What are the basic statistical characteristics of the acceleration coefficients with regard to the vehicle type and the road surface type? Does one vehicle generate on average greater shocks than the other?
Research question 2: Do the frequencies of exceeding normative values depend on the vehicle type and road surface type?
Research question 3: What contaminated probability distribution can be employed for the acceleration coefficients modeling? When a contaminated probability distribution is used, does the proportion of contaminated measurements depend on the road surface type and the vehicle type?
Research question 4: What is the effect of individual factors (surface type, vehicle type) on the acceleration coefficient values in the stationary mode?
3. Analysis and results
All statistical analyses were performed in R (version 4.0.3).
3.1. The descriptive statistical analysis of the data measured
The statistical data obtained was divided into statistical files based on the vehicle type (T810 and T815), the surface type (concrete blocks, granite cobbles, an unpaved road), and the respective axis (x, y, or z). The values from repeated drives (10 rounds) were always included in one statistical file. Hence, the total of 2 × 3 × 3 = 18 statistical files were formed containing the absolute values of the acceleration coefficients measured. For each file, their range n and basic characteristics (mean, median, standard deviation, minimum value, maximum value, lower quartile
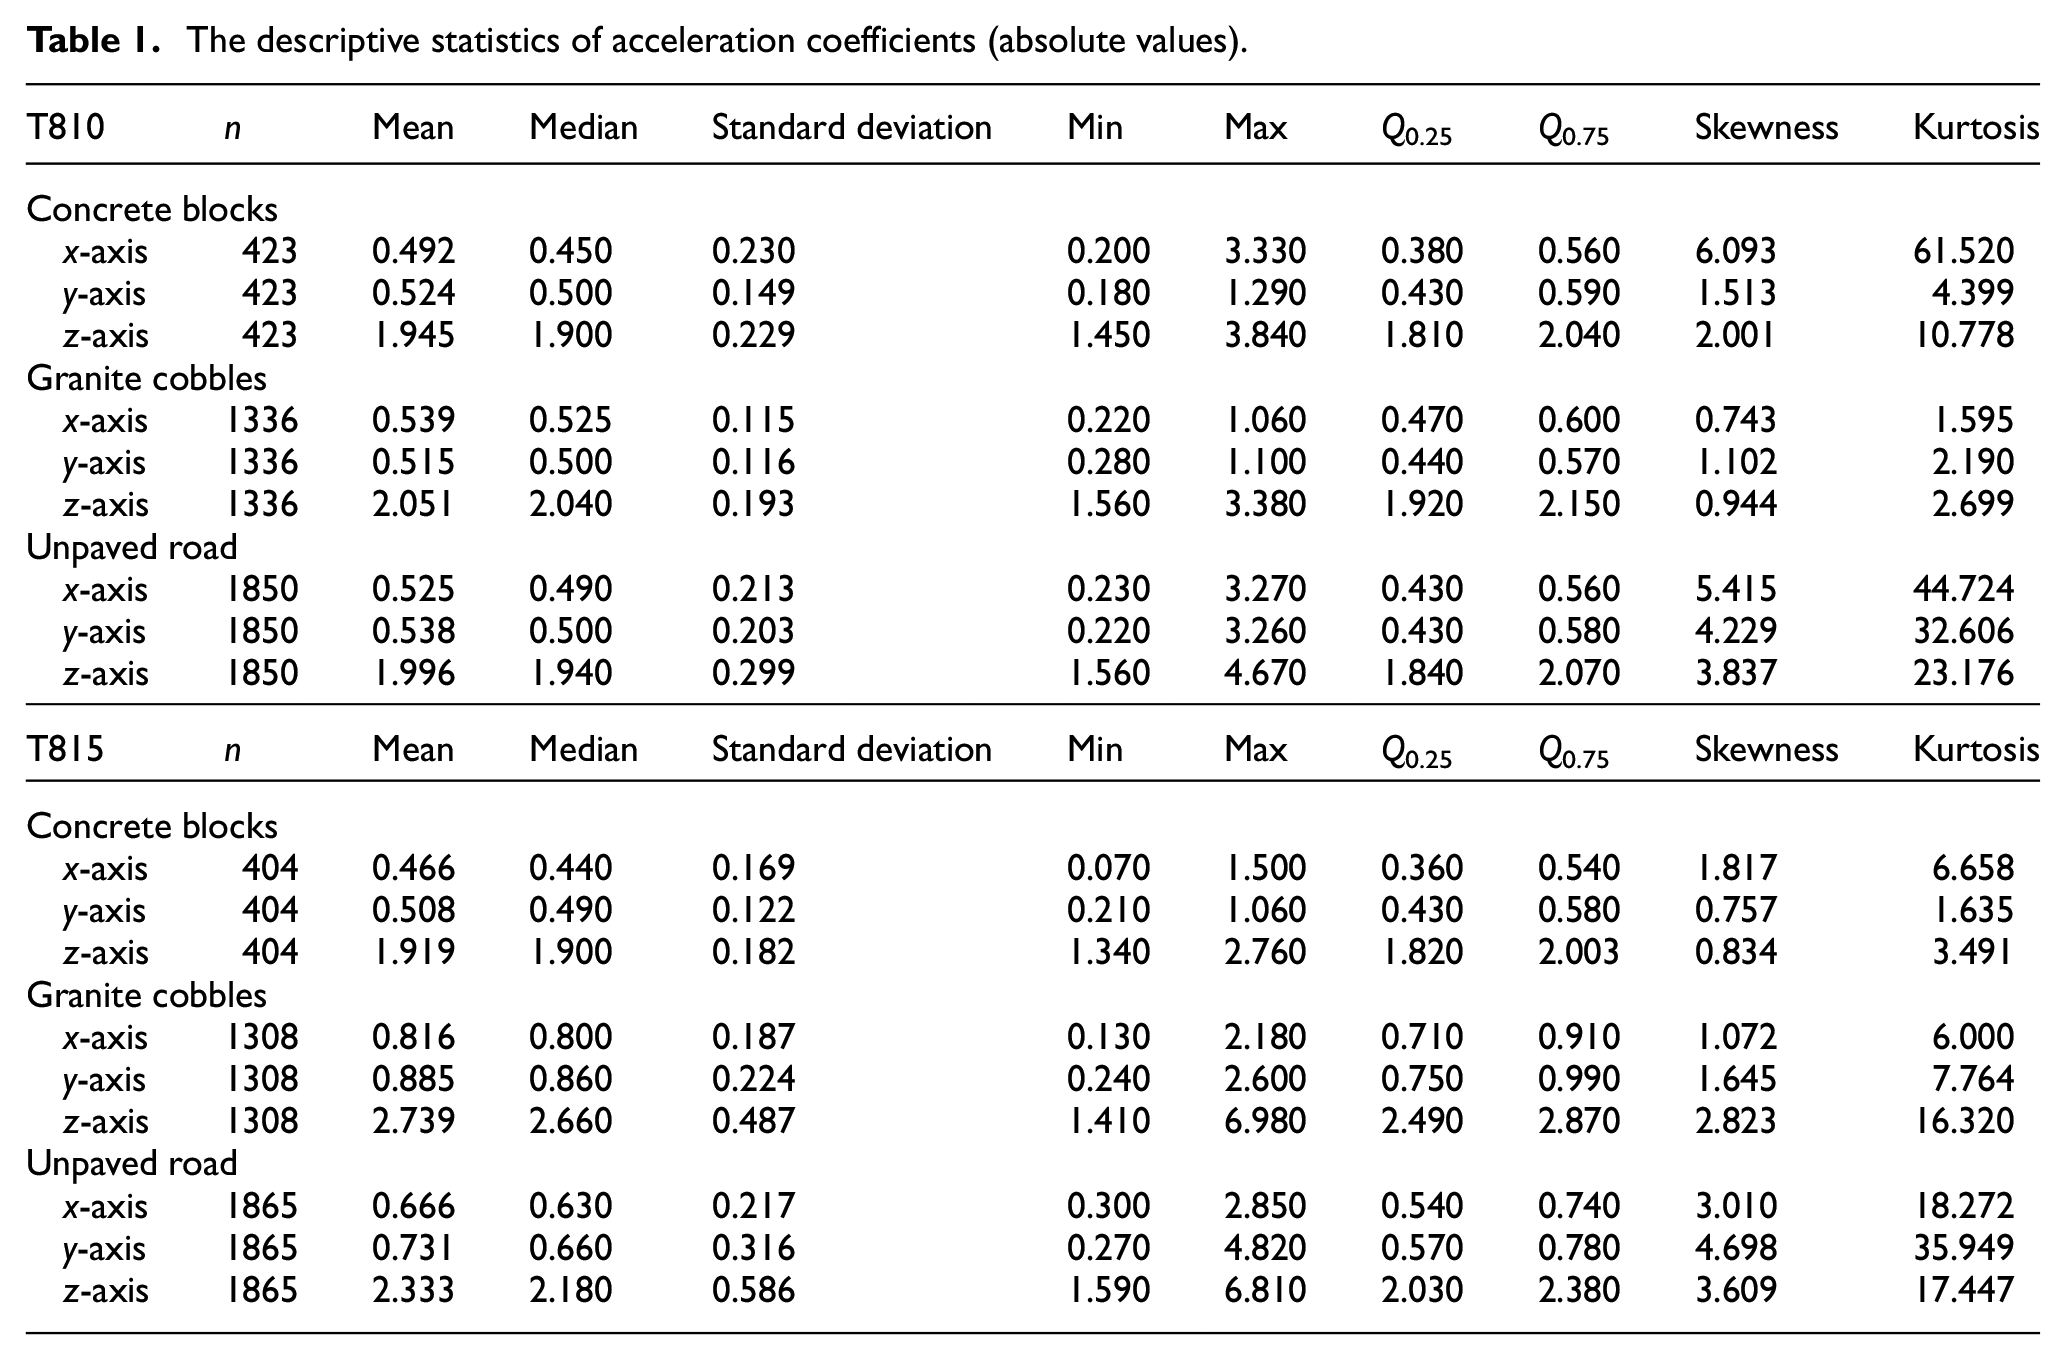
The descriptive statistics of acceleration coefficients (absolute values).
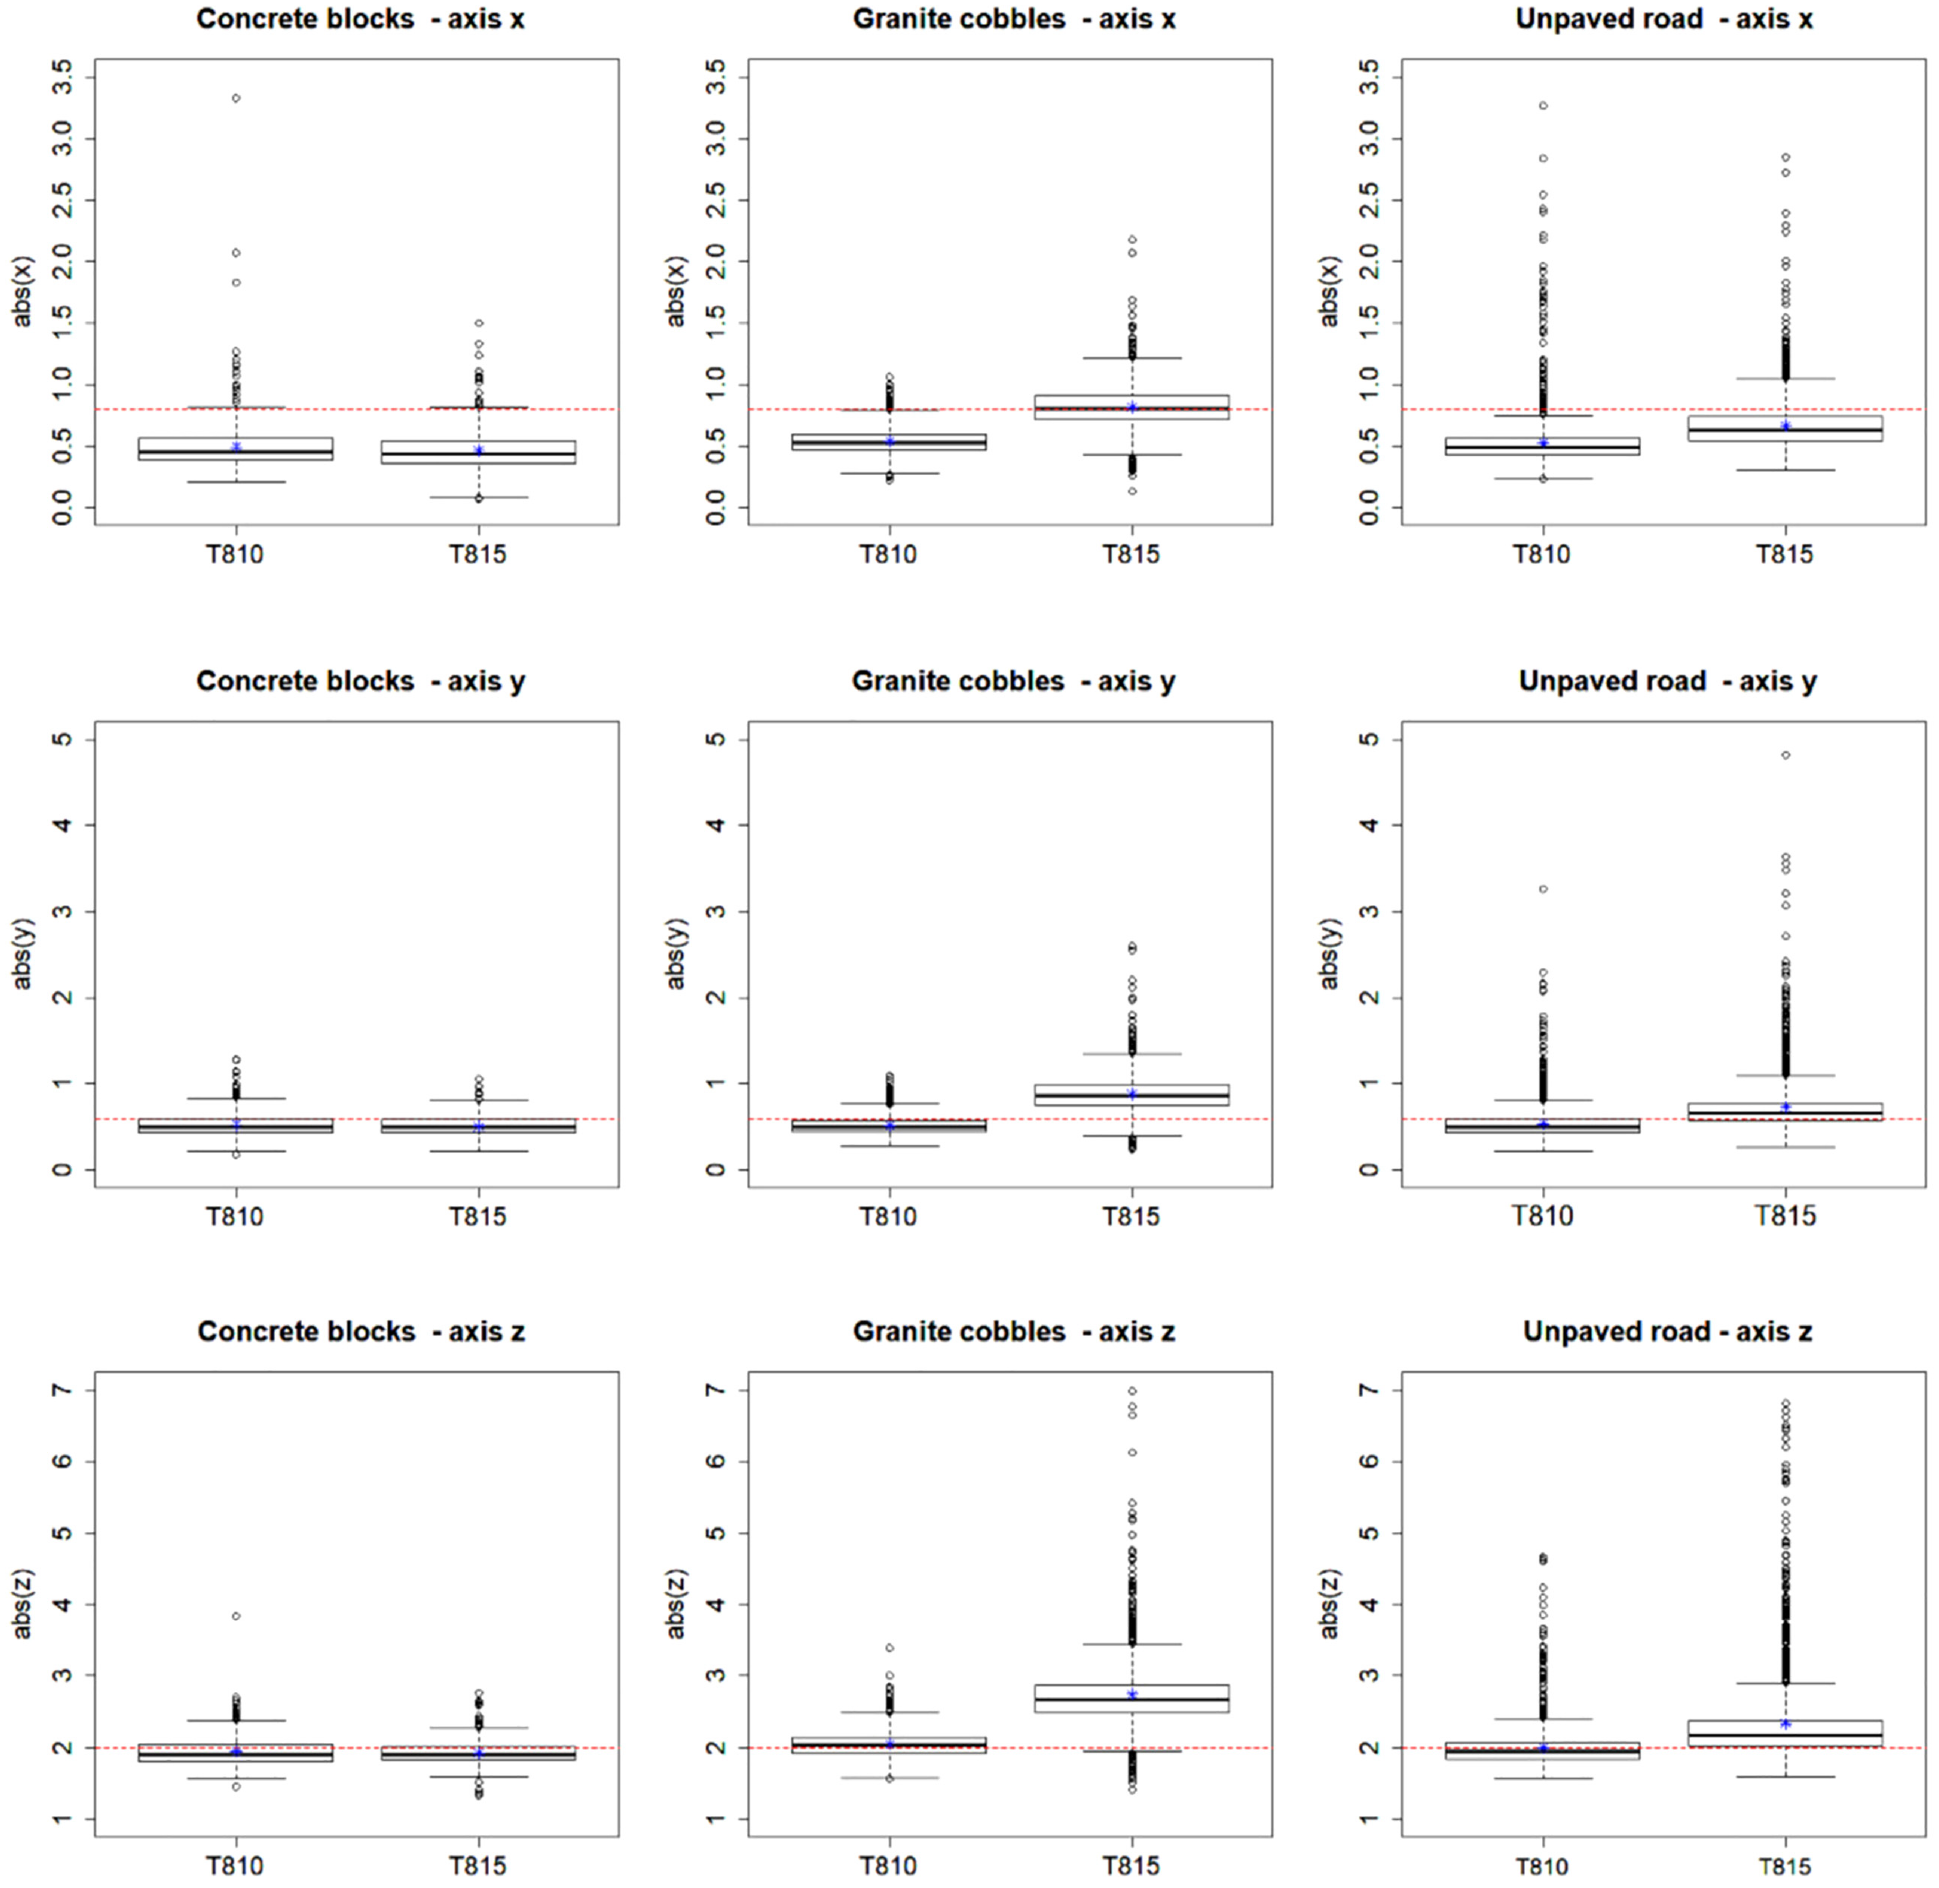
Boxplots of acceleration coefficients (absolute values).
3.2. The comparison of the frequencies of exceeding normative values in regard to the vehicles and individual road surfaces
Based on the descriptive analysis of the data and with regard to Question 2, the frequencies of exceeding normative values were determined for individual files. By means of a χ2 homogeneity test, the probabilities of normative value exceedance were compared for the T810 and T815 vehicles, individual road surfaces, and individual axes. (The assumptions of the test have been satisfied, as the expected frequencies are sufficiently large.) The results provided in Table 2 show that at the level of significance 5%, there is a statistically significant difference in terms of these probabilities between the T810 and T815 vehicles both in the individual axes and on the individual surfaces. The only exception is the probability of normative value exceedance in the x-axis and in the z-axis, where no statistically significant difference between these probabilities was identified for the two vehicles on the concrete blocks.
Exceeding the standard (m—number of exceedances, n—number of measurements, p-value—test of the equal proportions).
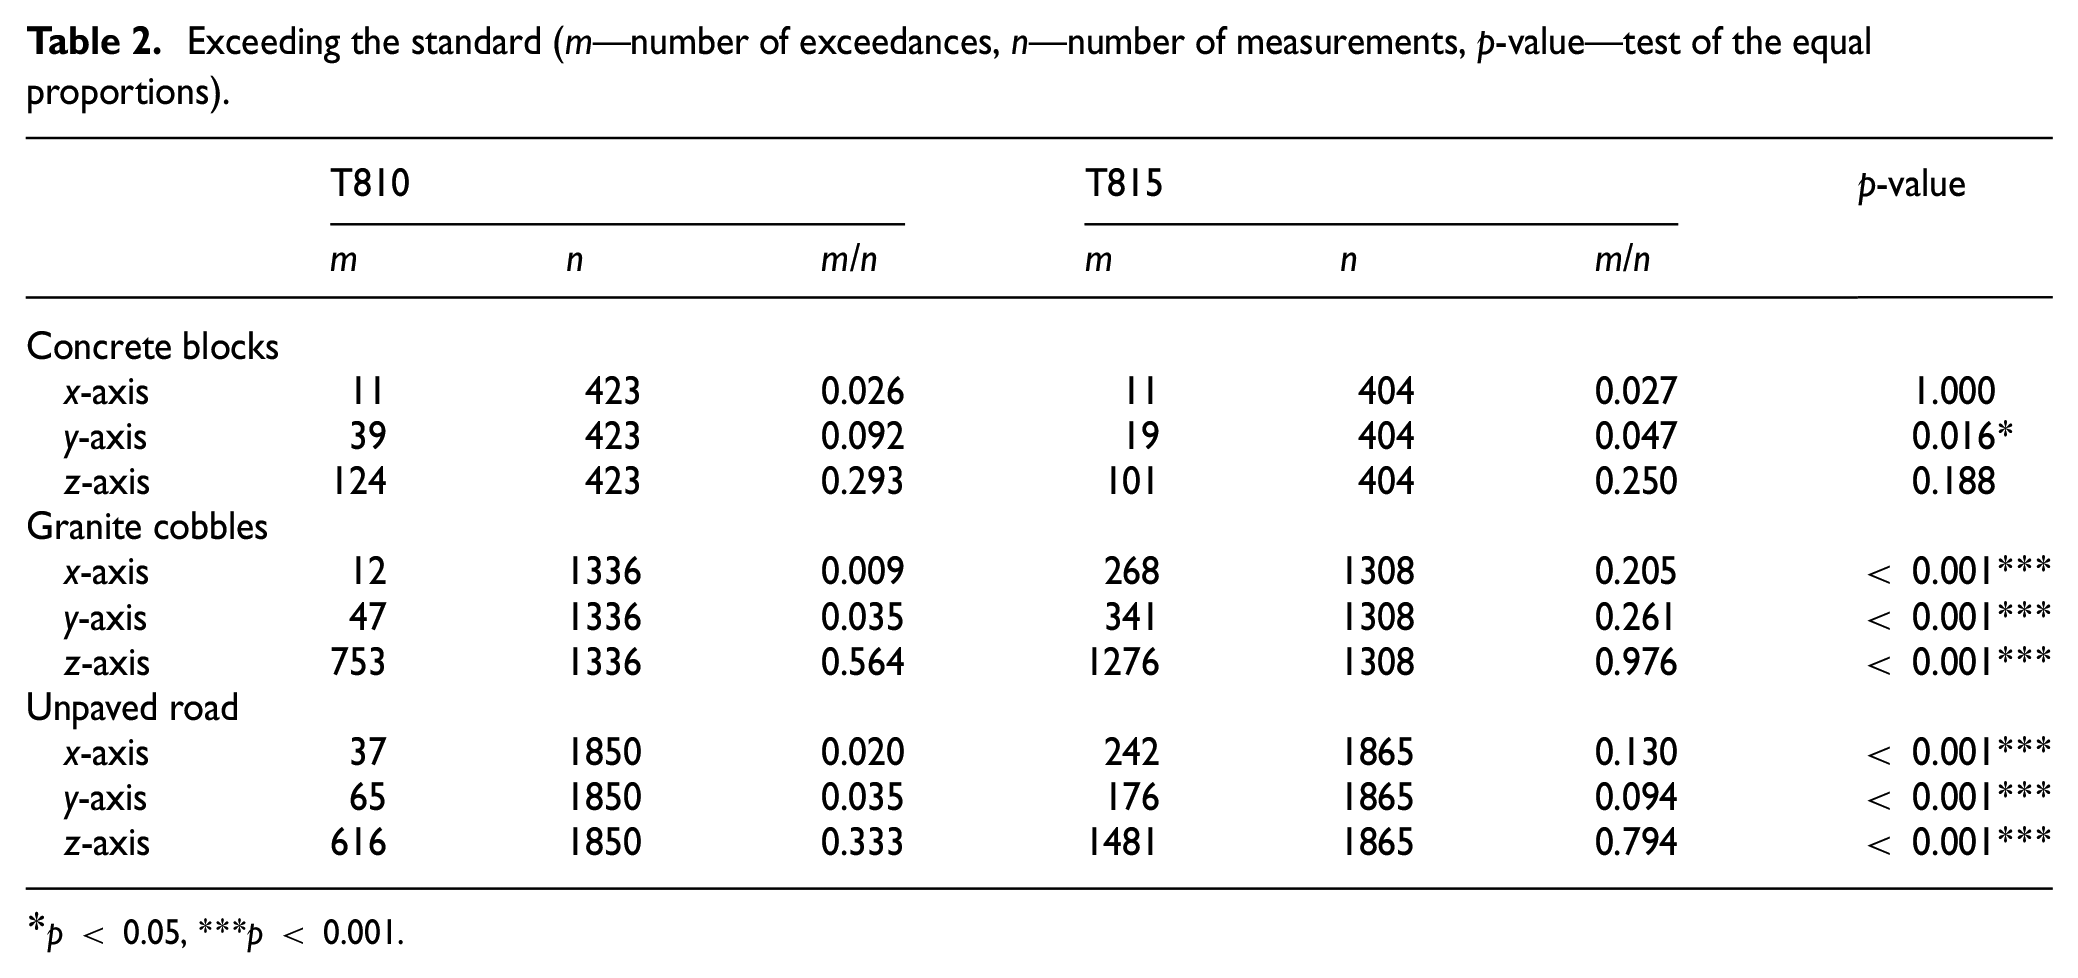
p < 0.05, ***p < 0.001.
3.3. The selection of model density for the acceleration coefficients measured
It also follows from the boxplots in Figure 5, and the skewness coefficient values mostly prove that the empirical distributions of the files analyzed are strongly asymmetrical with heavy tails. Particularly, it is evident that in some situations these empirical distributions are considerably affected—contaminated by measurements taken under non-stationary conditions. Thus, and with regard to publication,
36
a contaminated log-normal distribution of type (1) was selected for the modeling of the acceleration coefficient measurements, where density
The assumption of a log-normal distribution of individual files was statistically verified by means of a Cramer–von Mises goodness of fit test. For the T810 vehicle, deviations from the log-normal distribution were identified in two cases (the file for the z-axis during stationary driving on unpaved roads as well as for the y-axis during non-stationary driving on unpaved roads). In all the other cases, the Cramer–von Mises test did not identify any statistically significant deviations from the model distribution at the level of significance 5%. For the T815 vehicle, significant deviations from the log-normal distribution were identified at the level of significance 5% in the same cases as for the T810 vehicle, and also for the stationary driving on the granite cobbles in all axes and for the non-stationary driving on the unpaved road in all axes and on the granite cobbles in the z-axis (yet, with the level of significance decreased to 1%, the results for the non-stationary driving of the T815 vehicle were statistically insignificant). The results are stated in Table 3.
Cramer–von Mises goodness of fit tests, n1 is the number of drives in the stationary mode, n2 is the number of outliers (no. of drives in the non-stationary mode), n1 + n2 = n (file size).
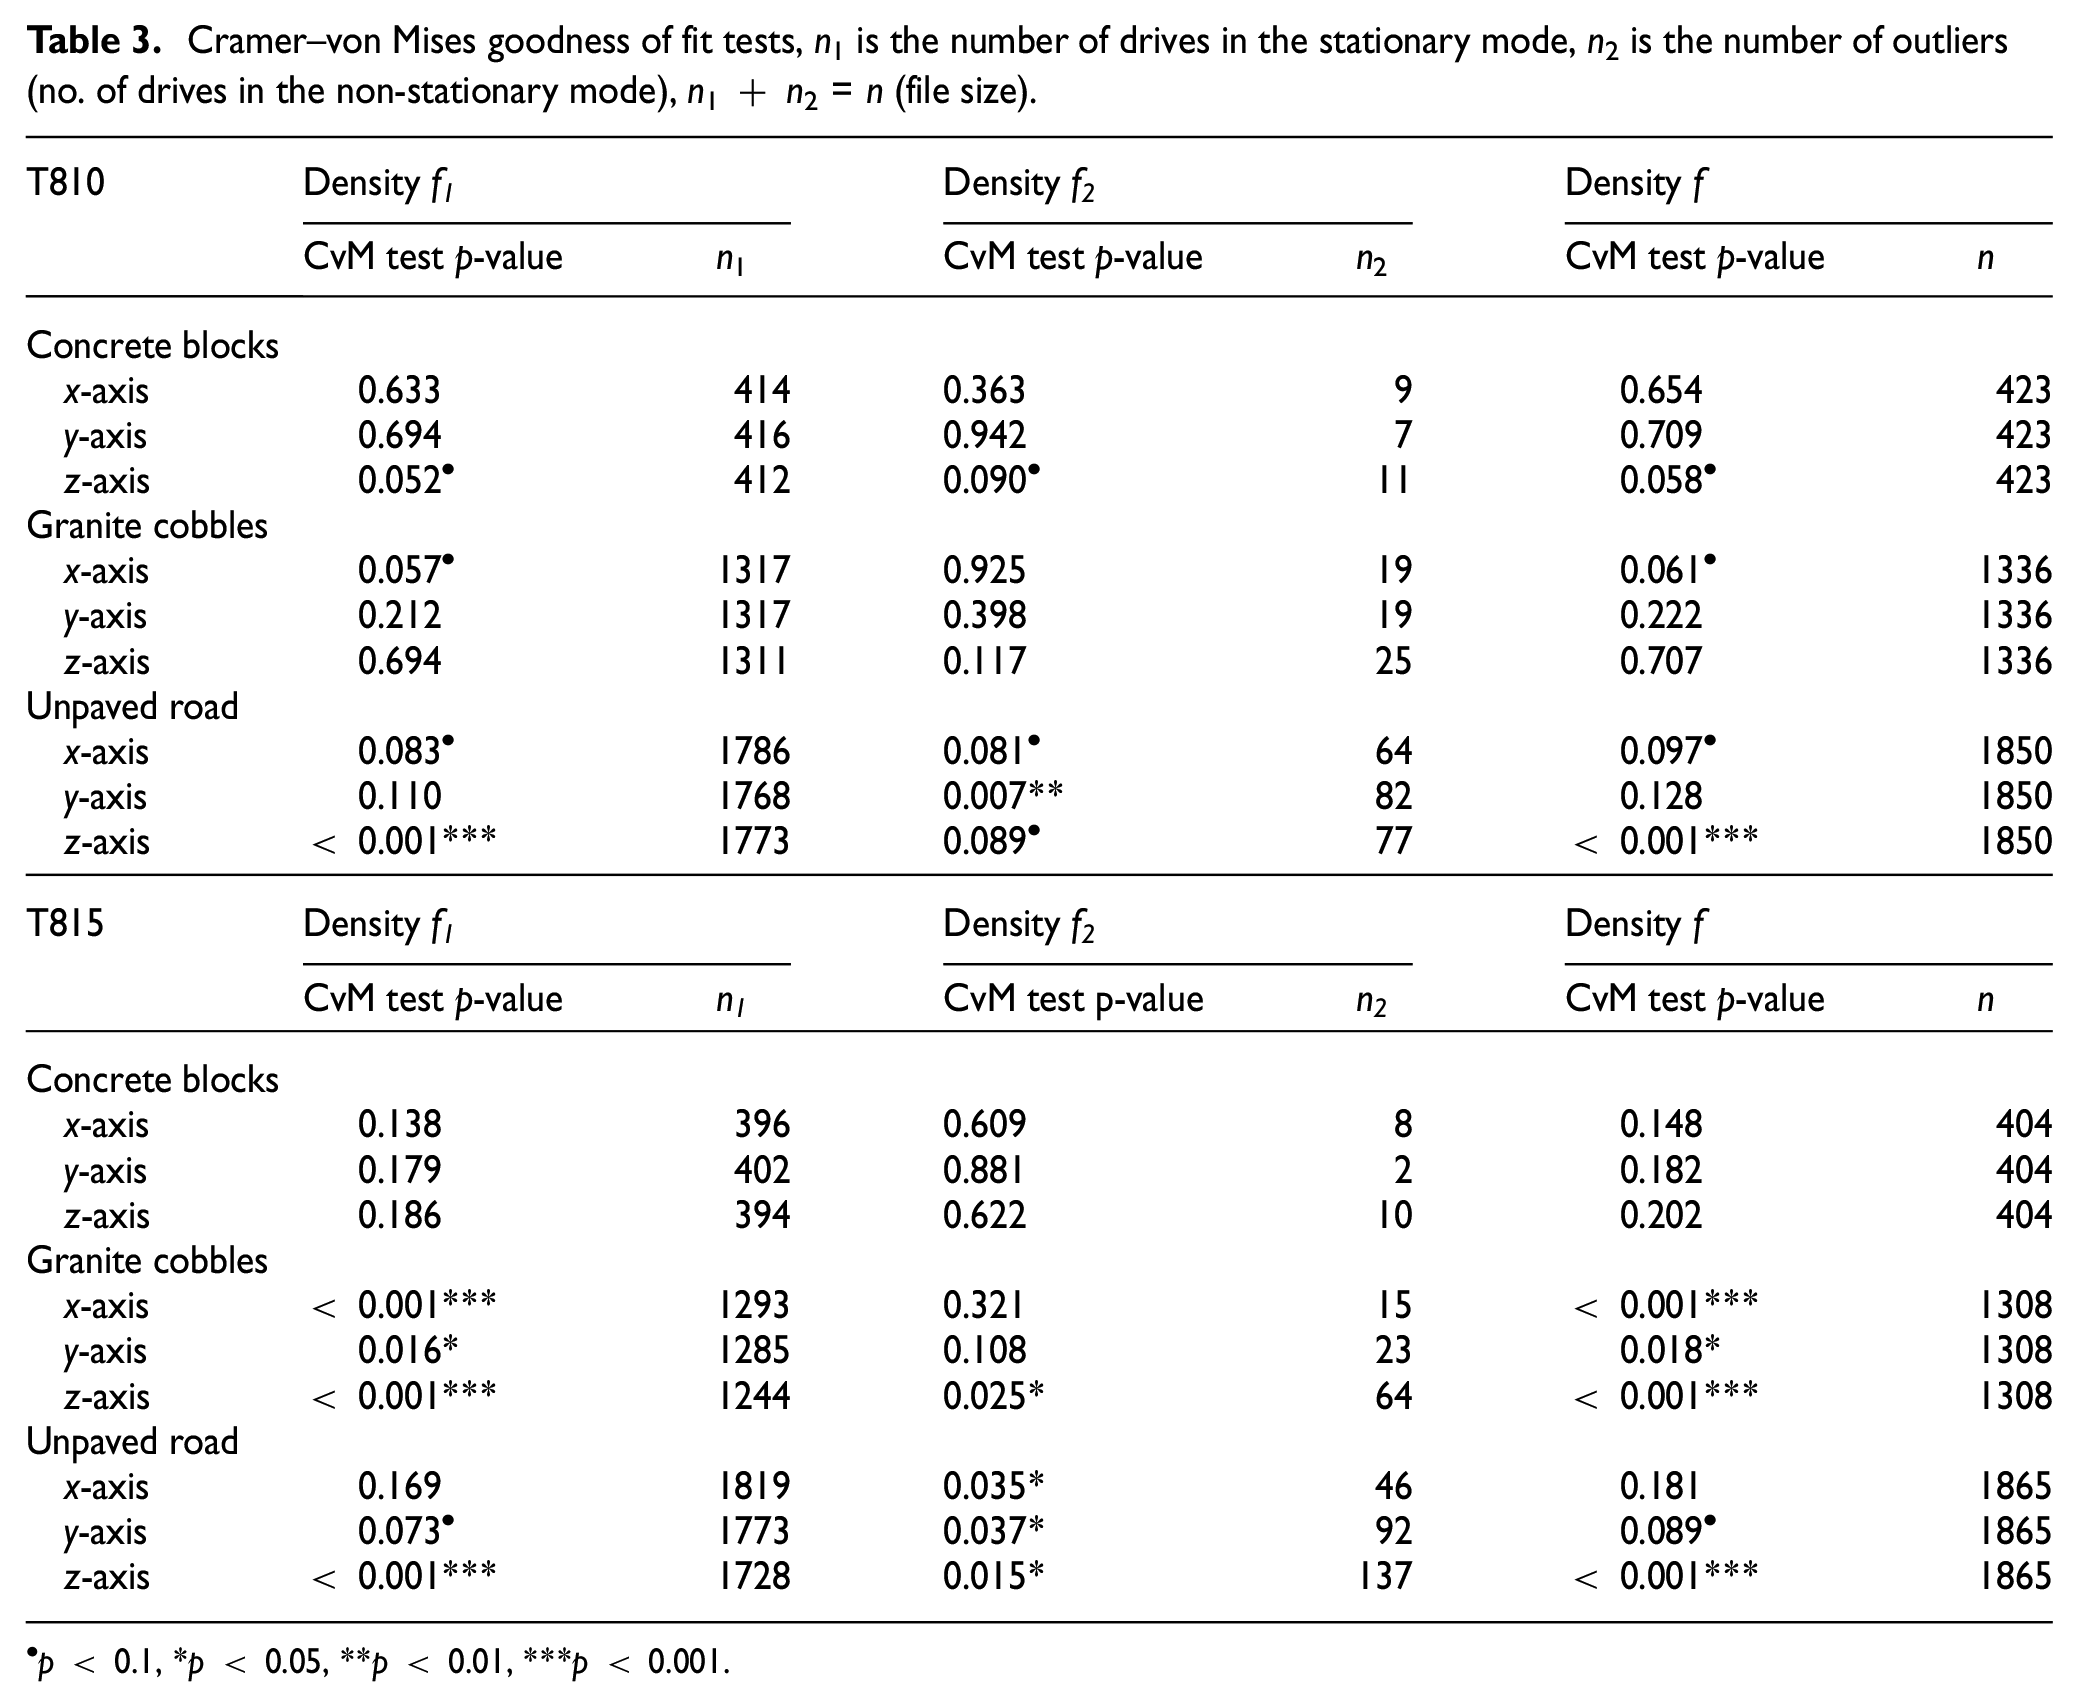
p < 0.1, *p < 0.05, **p < 0.01, ***p < 0.001.
The log-normal model with contaminated density (1) was not confirmed for the T810 only for the z-axis on the unpaved road. In case of the T815 vehicle, this model was not confirmed on the granite cobbles for all axes, and on the unpaved road for the z-axis. Given that sizes of the files, where the tested distribution at the level of significance 5% was not confirmed, are larger than 30, an asymptotic normal distribution of the mean values of the logarithms of the data studied can be assumed. Hence, further analyses based on Model (1) with log-normal densities can be conducted (refer to Question 3).
3.4. The comparison of the proportions of contaminated measurements with regard to the road surface and the T810 and T815 vehicles
For each of the 18 statistical files analyzed, a frequency was determined, i.e.,
Contingency tables, n1—number of “standard” measurements, n2—number of outliers (non-stationary measurements).
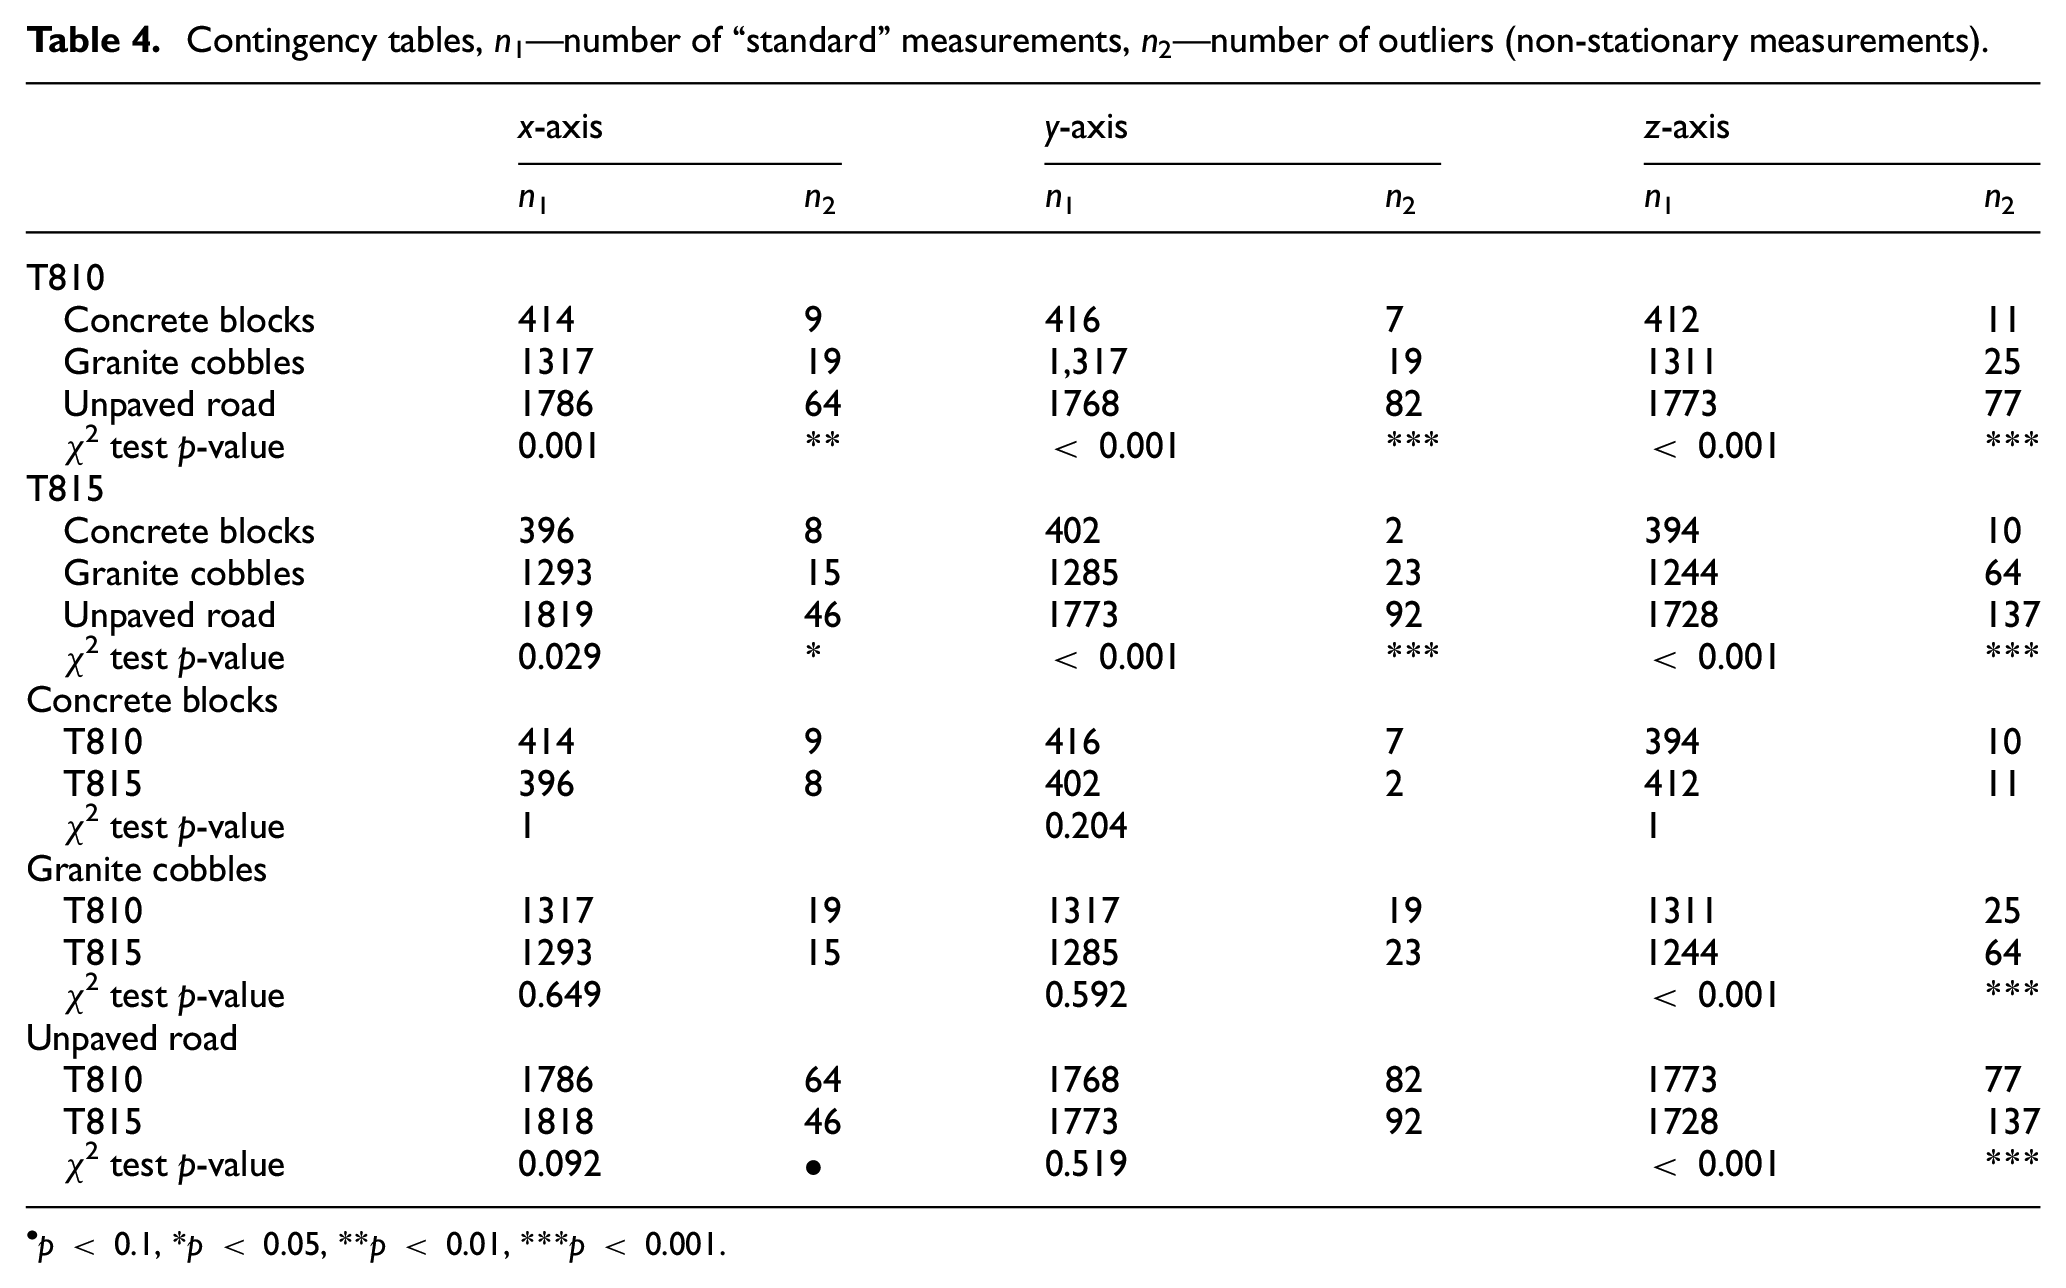
p < 0.1, *p < 0.05, **p < 0.01, ***p < 0.001.
The test results show that, at the level of significance 5%, there are statistically significant differences between the probabilities of exceeding limit value
3.5. The evaluation of the road type effect and the vehicle type effect on the magnitude of shocks (acceleration coefficients) in the stationary mode
In this paragraph, the effect of a respective vehicle and a road surface on the magnitude of shocks (acceleration coefficients) in the stationary mode will be evaluated numerically by means of a two-way analysis of variance with interactions, see Equation (2). The analysis will be conducted for each axis (direction of the shock) separately. The assumptions of the model were tested for normality (respective log-normality) using goodness-of-fit tests, as shown in Table 3. The assumption of equal variances was confirmed through graphical representation and the approximate Dean and Voss 43 test. No evidence of inhomogeneity of variances was found in any tested file. Test statistics for the x-axis, y-axis, and z-axis were 2.69, 1.49, and 2.10, respectively. These values are less than the Dean–Vose test recommended value of 3, indicating that homogeneity of variances can be assumed.
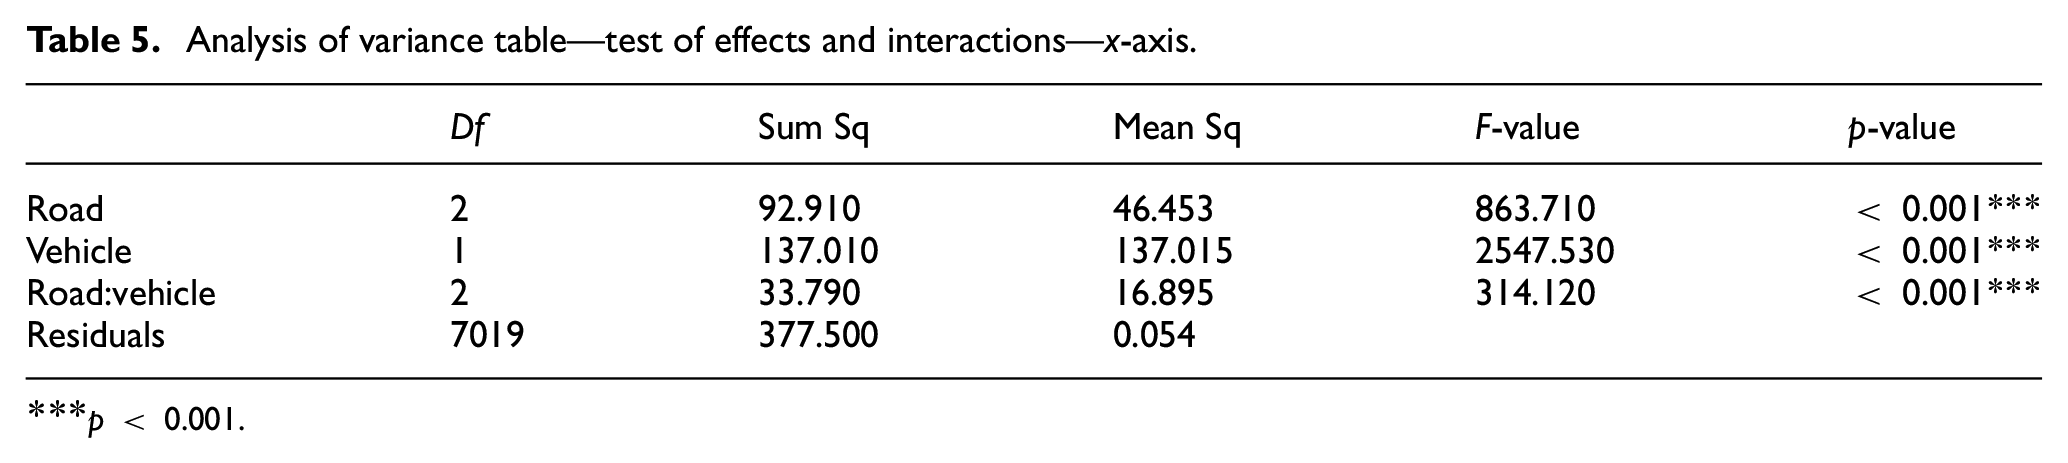
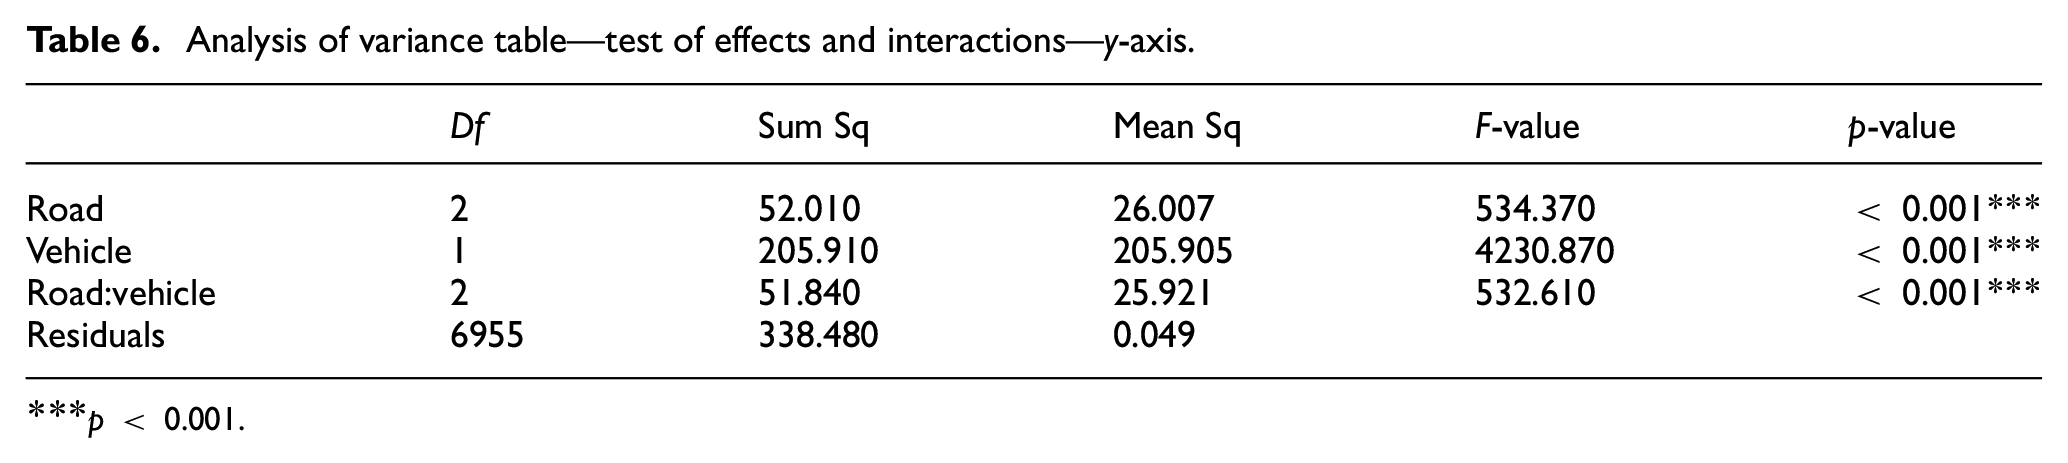
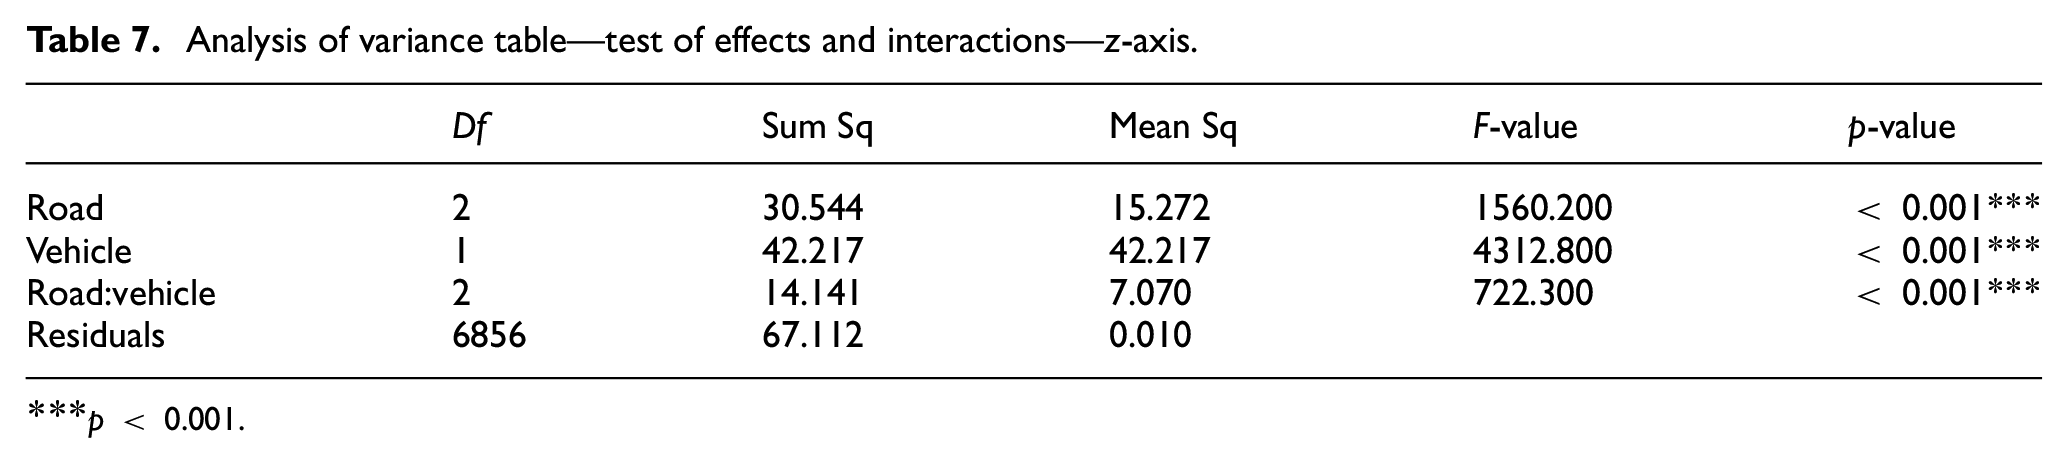
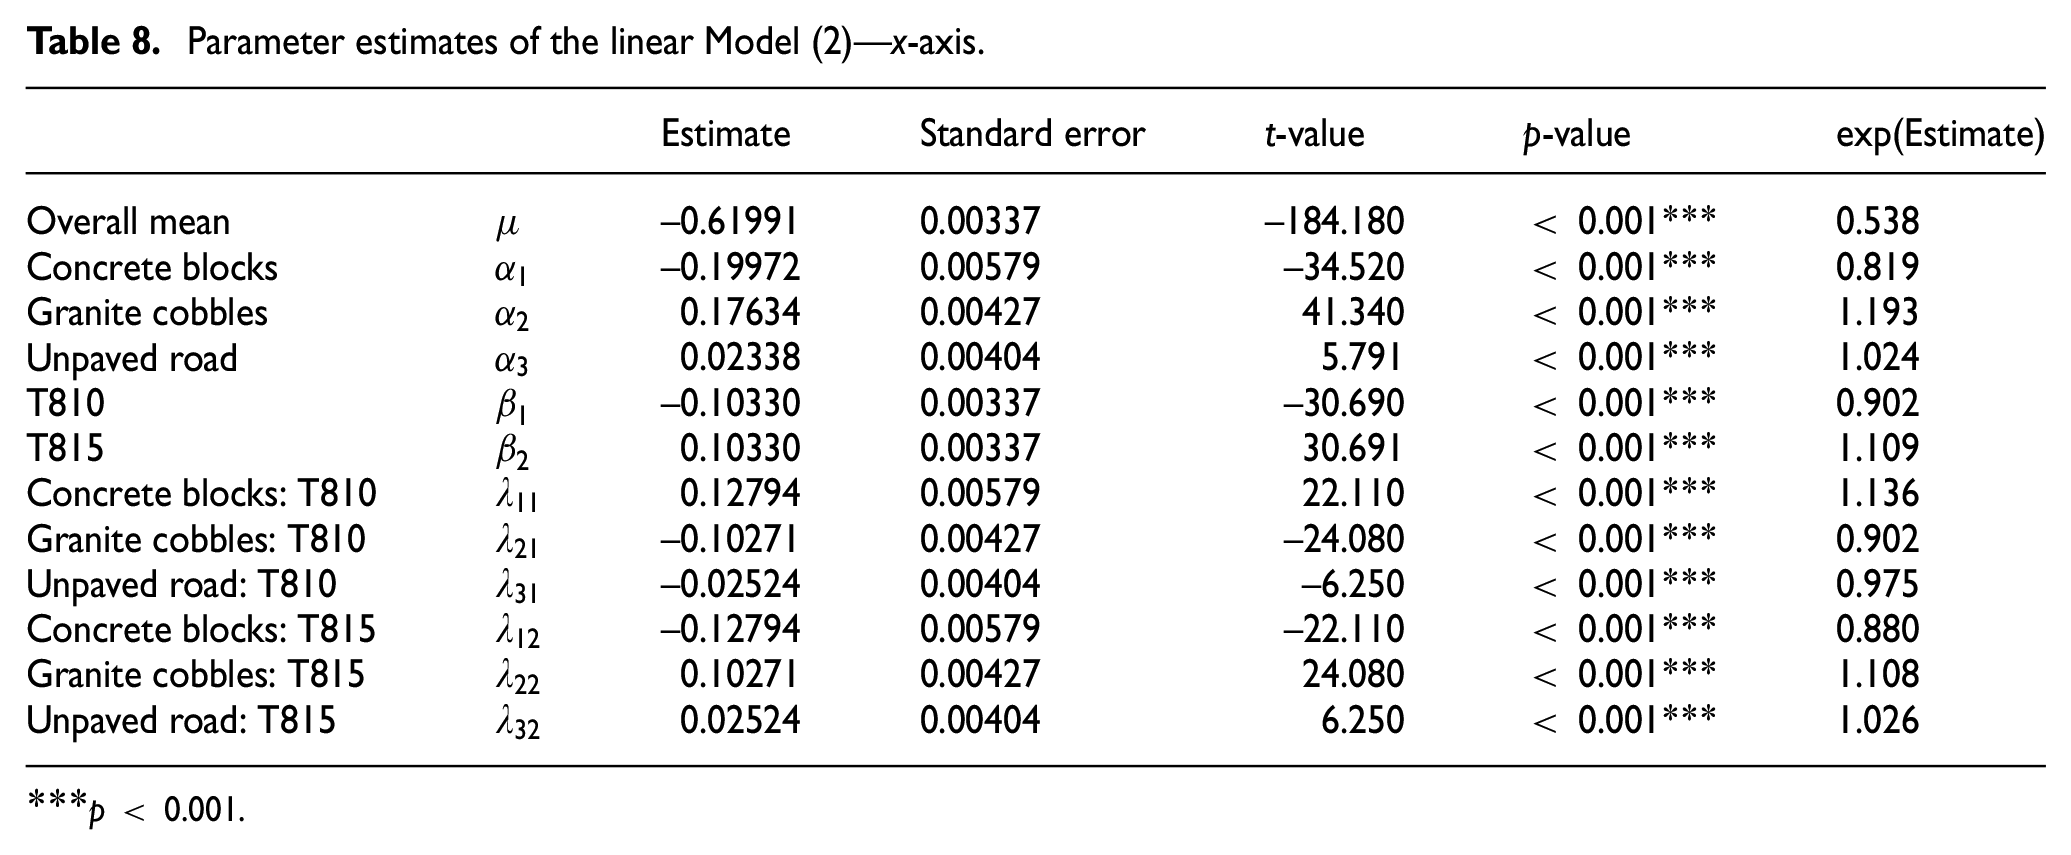
The overall results of the logarithmic data analysis are stated in the analysis of variance tables, i.e., Table 5 (for the x-axis), Table 6 (for the y-axis), and Table 7 (for the z-axis). In each table, the source of variability (road, vehicle, road:vehicle interaction and residuals) is stated, as well as statistical computing characteristics (degrees of freedom df, corresponding sums of squares Sum Sq, Mean Sq, test statistics F and p-value of the test of the null hypothesis that the effect of the respective type is statistically insignificant). It follows from the tables that the effects (effect of the road, effect of the vehicle and the interaction) are statistically significant for all three axes. The estimations of these effects, a standard error of estimation, test statistics t (t-value) and the respective p-value of the test that the respective effect is null (the statistical significance of the effect is analogically expressed using the asterisks again) are stated in Table 8 (for the x-axis), Table 9 (for the y-axis), and Table 10 (for the z-axis). The values of the above-mentioned effects are, due to the analysis carried out using logarithmic values
Analysis of variance table—test of effects and interactions—x-axis.
p < 0.001.
Analysis of variance table—test of effects and interactions—y-axis.
p < 0.001.
Analysis of variance table—test of effects and interactions—z-axis.
p < 0.001.
Parameter estimates of the linear Model (2)—x-axis.
p < 0.001.
Parameter estimates of the linear Model (2)—y-axis.
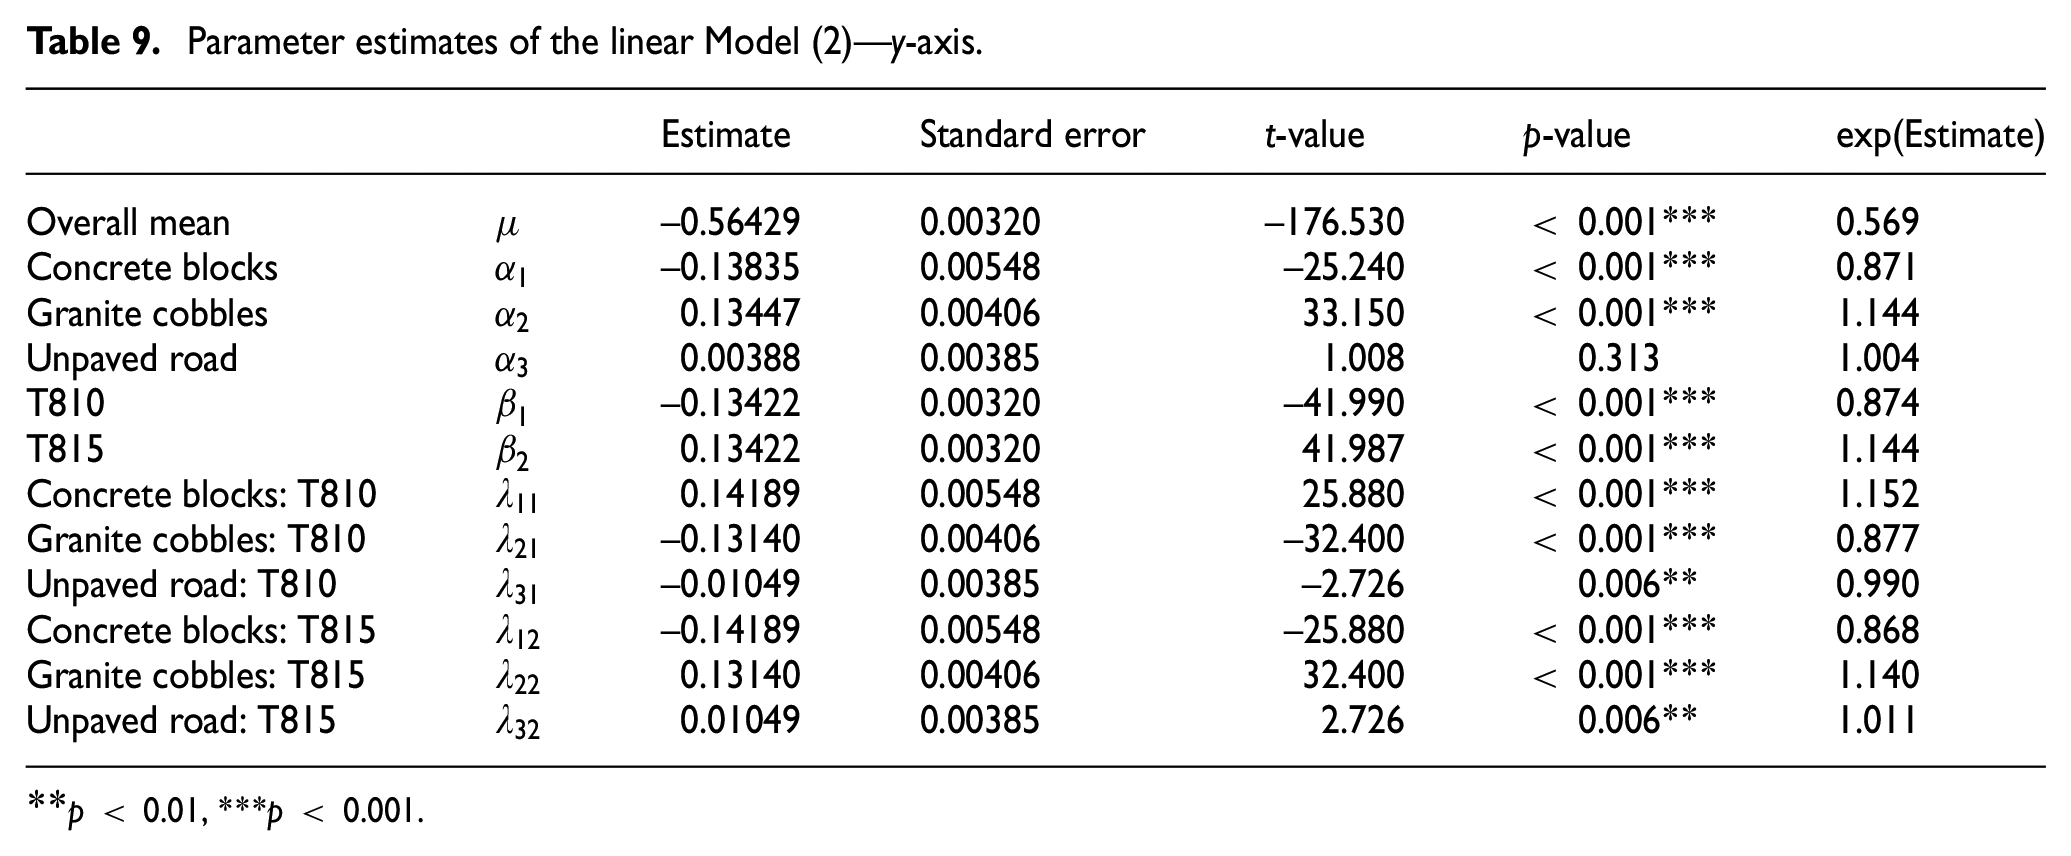
p < 0.01, ***p < 0.001.
Parameter estimates of the linear Model (2)—z-axis.
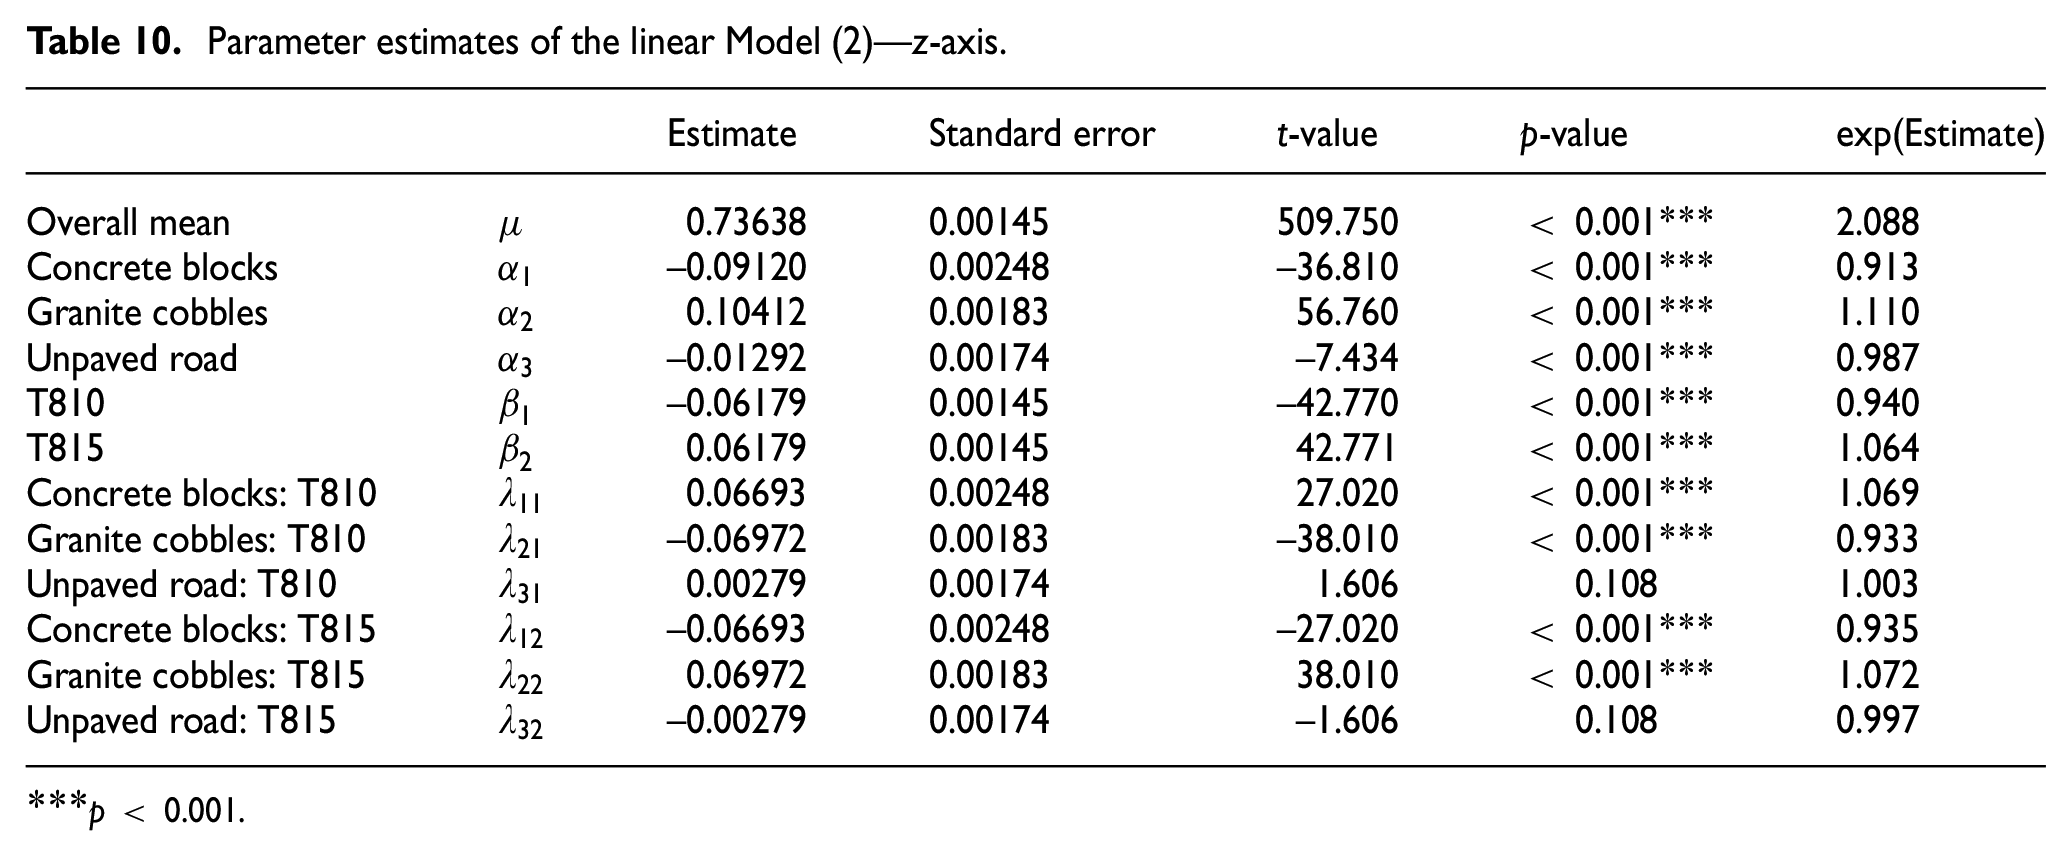
p < 0.001.
It follows from Table 8 that driving a vehicle on granite cobbles results in 1.193 times higher median of the acceleration coefficient values, while the effect of driving a vehicle on concrete blocks decreases the median of acceleration coefficient values 0.819 times in the x-axis. In case of an unpaved road, the acceleration coefficient values correspond to the median (they are only 1.024 times higher). The effect of the T815 vehicle increases the median 1.109 times, while the effect of the T810 vehicle decreases the median of the acceleration coefficient values 0.902 times. Furthermore, the interaction term of the T810 vehicle driving on concrete blocks has the biggest effect on the acceleration coefficients, increasing the median 1.136 times, while the interaction term of the T815 vehicle driving on concrete blocks has the smallest effect decreasing the median of acceleration coefficient values 0.880 times. In conclusion, it can be said (with regard to Question 4) that the values of all the effects, including the values of the interactions, differ statistically significantly from 1 (the value of 1 means that the particular effect has no influence on the median of the acceleration coefficient values) in the x-axis.
When assessing the effects in the y-axis and with regard to Question 4, the results obtained correspond to the results for the x-axis with the only difference that the value of the effect of a vehicle driving on an unpaved road does not differ statistically significantly from 1, and the effect thus neither decreases nor increases the median of the acceleration coefficient values. Similarly, the magnitude of estimated effects in the z-axis also corresponds to the conclusions obtained for the x-axis with the only difference that the interaction values of the T810 vehicle driving on the unpaved road and the interaction values of the T815 vehicle driving on the unpaved road do not differ statistically significantly from 1.
4. Discussion
4.1. Research question 1
For the statistical evaluation of the transport experiment data based on the acceleration coefficient values measured, methods of descriptive statistics and the theory of contaminated distribution was employed. It follows from the results that the highest mean value of the absolute acceleration coefficient values measured was identified in the x-axis for the T810 vehicle and the granite cobbles, i.e., the value of 0.539 with a standard deviation of 0.115. In the y-axis, the highest mean value equalled 0.538 with a standard deviation of 0.203, and it was identified for the unpaved road. In the z-axis, the highest mean value of 2.051 with a standard deviation of 0.193 was identified for the granite cobbles. For the T815 vehicle and for the x-axis, the highest mean value equalled 0.816 with a standard deviation of 0.187, and it also corresponded to the granite cobbles. For the y-axis, the highest mean value was 0.885 with a standard deviation of 0.224 and it was identified for the granite cobbles. For the z-axis, the highest mean value was 2.739 with a standard deviation of 0.487 for the granite cobbles. In this respect, the occurrence of the maximum mean values of the acceleration coefficients for the two vehicles is almost identical; in the x-axis and in the z-axis they always correspond to the road of granite cobbles.
4.2. Research question 2
Further analyses showed that the relative frequencies of exceeding normative values always differ statistically significantly between the vehicles for each surface with the exception of concrete blocks, where the relative frequencies of 0.026 for the T810 and 0.027 for the T815 are statistically insignificantly different in the x-axis, and the relative frequencies of 0.293 for the T810 and 0.250 for the T815 are also statistically insignificantly different in the z-axis. The highest relative frequencies of exceeding the normative values are always found on the z-axis for both vehicles. Thus, it can be concluded, based on the comparison of outliers using the relative frequencies, that in the non-stationary mode the frequencies of exceedance for both the vehicles are always highest in the z-axis and for the surface of granite cobbles. The values of exceedance measured correspond to the condition (wear) of the specific road surface and the individual driving style. When designing cargo securing, these individual factors shall always be taken into consideration.
4.3. Research question 3
For the modeling of the probability distribution of acceleration coefficients values, a log-normal model with contaminated density was employed. Based on the model, it can be claimed that the proportions of contaminated measurements depend both on the vehicle type and on the road surface type.
4.4. Research question 4
Due to the fact that the two-way analysis of variance could be based on logarithmic data, and thus on a contaminated normal distribution, each data file was divided into two subfiles. In the first subfile, there were the values below the determined limit b =
Predictions of acceleration coefficients.
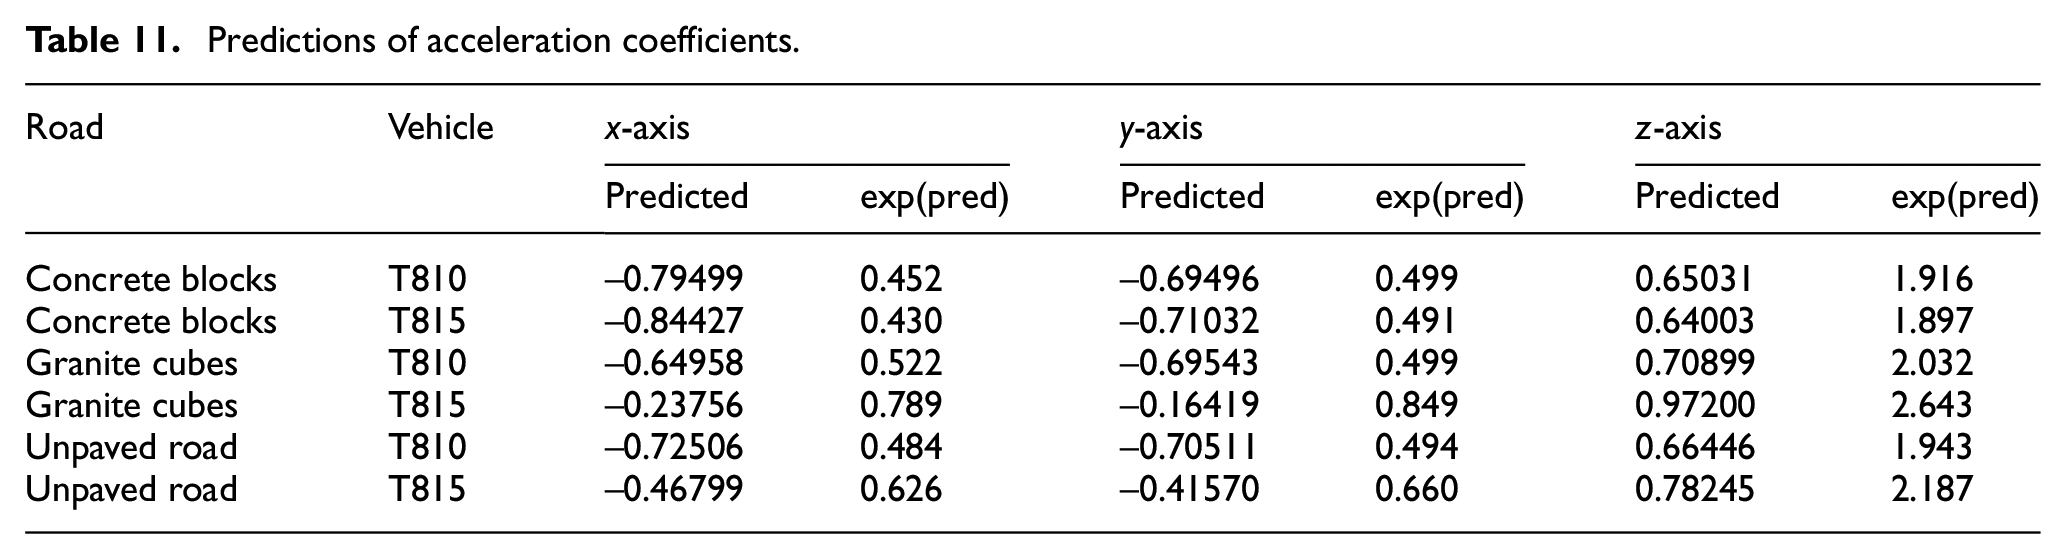
The results and the methodological procedure show that the approach is promising and can reveal potential and real problems in the cargo securing system used. The evaluations presented can thus serve as support to the commander in the implementation of transportation tasks in order to ensure the safe transportation of the required supplies. Following the literature research, it is clear that little attention has been paid to the area under study. In general, it can be concluded that the approaches from the relevant standards are sufficient for “normal transport,” i.e., by trucks of civil carriers on the standard road network. The novelty of the approach lies in taking into account the specificities of transport in military conditions. In addition, a similar approach would be applicable to the Integrated Rescue System, especially in the context of emergency supply in cases where the transport infrastructure is disrupted or damaged. 44
5. Conclusion
The paper was concerned with the issue of cargo securing and the evaluation of the extreme acceleration coefficient values measured in the course of a military transport experiment. A detailed statistical analysis of the acceleration coefficient values measured was carried out for two types of military vehicles and three types of road surfaces of lower quality. The assumption that higher values of shocks (acceleration coefficient values) can be expected on these surfaces was confirmed by comparing their values to normatively determined values EN 12195-1. 5 A probability distribution of the acceleration coefficient values itself was modeled as a contaminated log-normal distribution, where the stationary mode corresponds to a normal course of a drive and the non-stationary mode to sudden changes possibly caused by hard braking, driving on an uneven surface, sudden changes in the driving direction, etc. In the stationary mode, the authors have proved a statistically significant effect of the vehicle type and road surface and their mutual interaction on the values of the acceleration coefficients measured. The conclusions are practically applicable to the rationalization of a securing system on the vehicles used as well as other vehicles of a similar type. This racialization can be seen on the following levels:
Use of modern sensors and accurate data acquisition. The prerequisite is to include this as part of the public procurement system of military equipment in the conditions of the Czech Army. These systems can be independent of the vehicle (cheaper option) as in the transport experiment, or they can be an integral part of the vehicle (more expensive option). Separate sensors (independent of the vehicle) would allow for multiple vehicles to be used to collect data for evaluation. Sensorics as part of the vehicle would in turn allow for regular evaluation of each trip and ideally inform the driver immediately during the trip that a driving parameter is exceeded (not necessarily only shocks).
Data analysis by appropriate methods. The use of appropriate mathematical and statistical methods, including the possibility of automation within future military information systems.
Support the commander’s decision-making process on the choice of cargo securing system using the above-mentioned analyses. Given that, especially in combat conditions, “normal operating conditions” (transport on good quality roads) cannot be relied upon, the other side of the equation, i.e., cargo securing, needs to be adjusted to take account of normal, but potentially extreme, conditions.
In further research, other mathematical methods, including applications from other modes of transport 45 or other scientific fields,46,47 can be used. As a rule, when selecting a securing system and designing the entire cargo securing, normatively determined limits of acceleration coefficients are taken into consideration with the presupposition of driving on common roads. In the transport experiment conducted, as well as in the previous publications mentioned above, values of acceleration coefficients appeared that did not meet the assumptions posing a risk in terms of cargo securing. By taking the vehicle type, road type (surface), and their mutual interactions into account, a cargo securing system can be modified adequately, i.e., with regard to higher values of acceleration coefficients (shocks) that can be expected during similar transportations.
Footnotes
Funding
The author(s) disclosed receipt of the following financial support for the research, authorship, and/or publication of this article: This research was supported by grant No. CK03000182: Research of Construction-Technical Requirements for the Use of TEN-T Ground Infrastructure to Solve Large-scale Crisis Situations funded by Technology Agency of the Czech Republic.