
Abstract
Background
After a central nervous system lesion, the ability to control muscle activation and relaxation in specific joint ranges may be impaired. The underlying mechanism of this sensorimotor impairment is related to a decreased ability to regulate the tonic stretch reflex threshold (TSRT) through descending and peripheral control processes. In dynamics, the reflex threshold and its velocity-sensitivity (μ) describe how movement in specific upper limb (UL) joint ranges is impaired after stroke.
Objective
To examine the relationships between measures of elbow flexor impairment using TSRT and μ, and clinical scores of spasticity and motor function. We hypothesized that TSRT and μ would be related to clinical spasticity and motor impairment scores in patients with acute and chronic stroke.
Methods
TSRT, μ, and clinical data of the resistance to passive movement (Modified Ashworth Scale) and UL motor function (Fugl-Meyer Assessment [FMA]) were collected from 120 patients. Relationships between variables were determined using simple correlations and multiple regression analysis.
Results
TSRT and μ explained 72.0% of the variance in the FMA of the Upper Extremity [FMA-UE] describing only in-synergy and out-of-synergy movements and reflex function. TSRT explained 68.7% of the variance in the total score of the FMA-UE.
Conclusions
This study shows for the first time, a significant relationship between deficits in TSRT regulation and μ with UL motor impairment after stroke. TSRT and μ may be valuable clinical biomarkers of sensorimotor impairment for monitoring spontaneous or treatment-induced motor recovery.
Introduction
Stroke is a major cause of disability affecting sensorimotor function and impacting quality of life in up to ~70% of adults.1,2 Rehabilitation interventions developed to enhance sensorimotor recovery have had little impact on decreasing impairment, 3 especially in the upper limb (UL) for individuals with chronic stroke (eg, Wolf et al 4 and Lo et al 5 ). Part of the problem lies in the determination of the best timing and intensity of different interventions. 6 Other key reasons why rehabilitation may appear to have limited effectiveness are that the treatment approaches insufficiently target the underlying sensorimotor impairment and changes in impairment are not always captured by standard clinical outcome measures. Use of more objective measures based on the understanding of motor control mechanisms may provide more precise clinical evaluation to detect the onset and progression of sensorimotor impairments, which can guide the choice of interventions and assess treatment effectiveness.7,8 The determination of the motor impairment and its measurement first requires an understanding of the underlying stroke-related motor control deficit. “Motor control” refers to how the brain organizes the interaction between body segments and their relationship with the environment to produce purposeful, coordinated motor actions. 9
Two competing theoretical frameworks provide explanations of how motor actions are controlled. 10 The majority of stroke recovery studies include biomarkers of impairment such as changes in motor output measured with kinematics (eg, joint motion and interjoint coordination) and kinetics (eg, muscle force) based on the Computational Approach. This approach originates from robotics and posits that the brain directly computes and specifies motor outcome in terms of biomechanical variables (ie, kinematics, kinetics, electromyography [EMG], also called motor commands). This is done using hypothetical neural emulators (internal models) of equations of motion in which the interactions between body segments as well as the body with the environment for any given action are considered (eg, Hollerbach 11 and Shadmehr and Wise 12 ). Biomarkers of motor output based on this approach consist of mechanical and physiological properties of movement. This approach has been criticized as not representing how the body interacts with physical properties of the environment and other important limitations such as the irreversibility of input/output functions of motoneurons (MNs).13-15 Given that MNs are threshold elements, it is impossible to compute the exact input synaptic signals to MNs that will result in the desired EMG output in the computational model. As a result, inverse dynamic models do not exist for the set of motionless motor actions such as isometric force or torque production.15,16 The replacement of MNs with an artificial network of neurons having reversible, linear functions, makes the computational model theory physiologically unfeasible for the set of motor actions essential in everyday life.
The idea that motor impairment is directly reflected in changes in kinematic patterns and forces is challenged in the Referent Control Theory (RCT) of motor control based on the Equilibrium-Point Hypothesis17-19 and developed in dynamical systems20-22 and ecological theoretical frameworks. 23 In this approach, motor actions are not directly represented in the brain and played out in every detail like a computer program (ie, preprogrammed), but rather, they emerge indirectly due to changes in parameters of physical and physiological laws as the body interacts with the environment. In other words, instead of controlling motor output by directly sending signals to create EMG patterns and muscle forces, the central nervous system (CNS) controls the parameters of muscle activation (ie, the threshold muscle length, λ). Parameter λ is the MN threshold expressed as a muscle length (or joint position) at which MN recruitment begins and sets the conditions under which voluntary action is possible. The advantage of the RCT is that it is the only motor control theory that expresses how the CNS controls motor actions with respect to body biomechanics and how they interact with the physical world. Setting the value of λ depends on the confluence of descending, segmental, and inter-segmental input on MNs. These include the corticospinal tract,24,25 peripheral influences from proprioceptors and other afferents transmitted mono- and poly-synaptically to MNs as has been established in animal26,27 and human studies.17,19
While λ describes activation of a single MN, evaluation of whole muscle activity includes λs of the multiple α-MNs of which it is comprised. This whole muscle activation threshold is expressed as the tonic stretch reflex threshold (TSRT). The term “tonic” implies that it denotes the threshold at rest or when there is no movement (ie, zero velocity). Thus, the TSRT cannot be measured directly in vivo, but it can be approximated by exploiting the velocity-dependent nature of the stretch reflex. By stretching the muscle at different velocities, it is possible to evoke dynamic stretch reflex thresholds (DSRTs) and use them to compute the TSRT at rest. Velocity-dependent (dynamic) DSRTs are presumably regulated by γ-dynamic MNs that innervate muscle spindles.18,19 The relationship between DSRT decreases with increased velocity of muscle stretch characterizes the velocity-sensitivity of the stretch reflex (μ). DSRT can be described as follows:

where TSRT is the tonic component of the stretch reflex, that is, at zero velocity, μ is a positive time-dimensional (seconds) coefficient, and V is the angular velocity.26,27
According to the RCT, the nervous system only pre-determines where, in the physical space of the joint range, MNs and reflexes are prescribed to work without prescribing the motor actions they should produce. If the emergent motor action misses the goal, it can be corrected by adjusting TSRT through sensory input until the goal is reached. In the healthy system, any combination of muscle length and torque can be achieved by setting the activation threshold of the muscle within the biomechanical joint range (Figure 1A, θ−, θ+). Here, muscle length is associated with the joint angle. Full muscle relaxation is achieved by setting TSRT beyond the upper biomechanical joint limit (Figure 1A, TSRT+). The CNS can activate a muscle at its minimal length, (Figure 1A, θ−), by moving the lower threshold of TSRT (TSRT−) below θ− (Figure 1A). Equally, an initially inactive muscle (TSRT−) can be activated transiently by a tendon tap or by shifting TSRT within the biomechanical joint range to produce a phasic stretch reflex. Thus, EMG/muscle torques emerge from CNS shifts in TSRTs. Much evidence supports this hypothesis since the initial studies in decerebrate cats.17-19,26,27
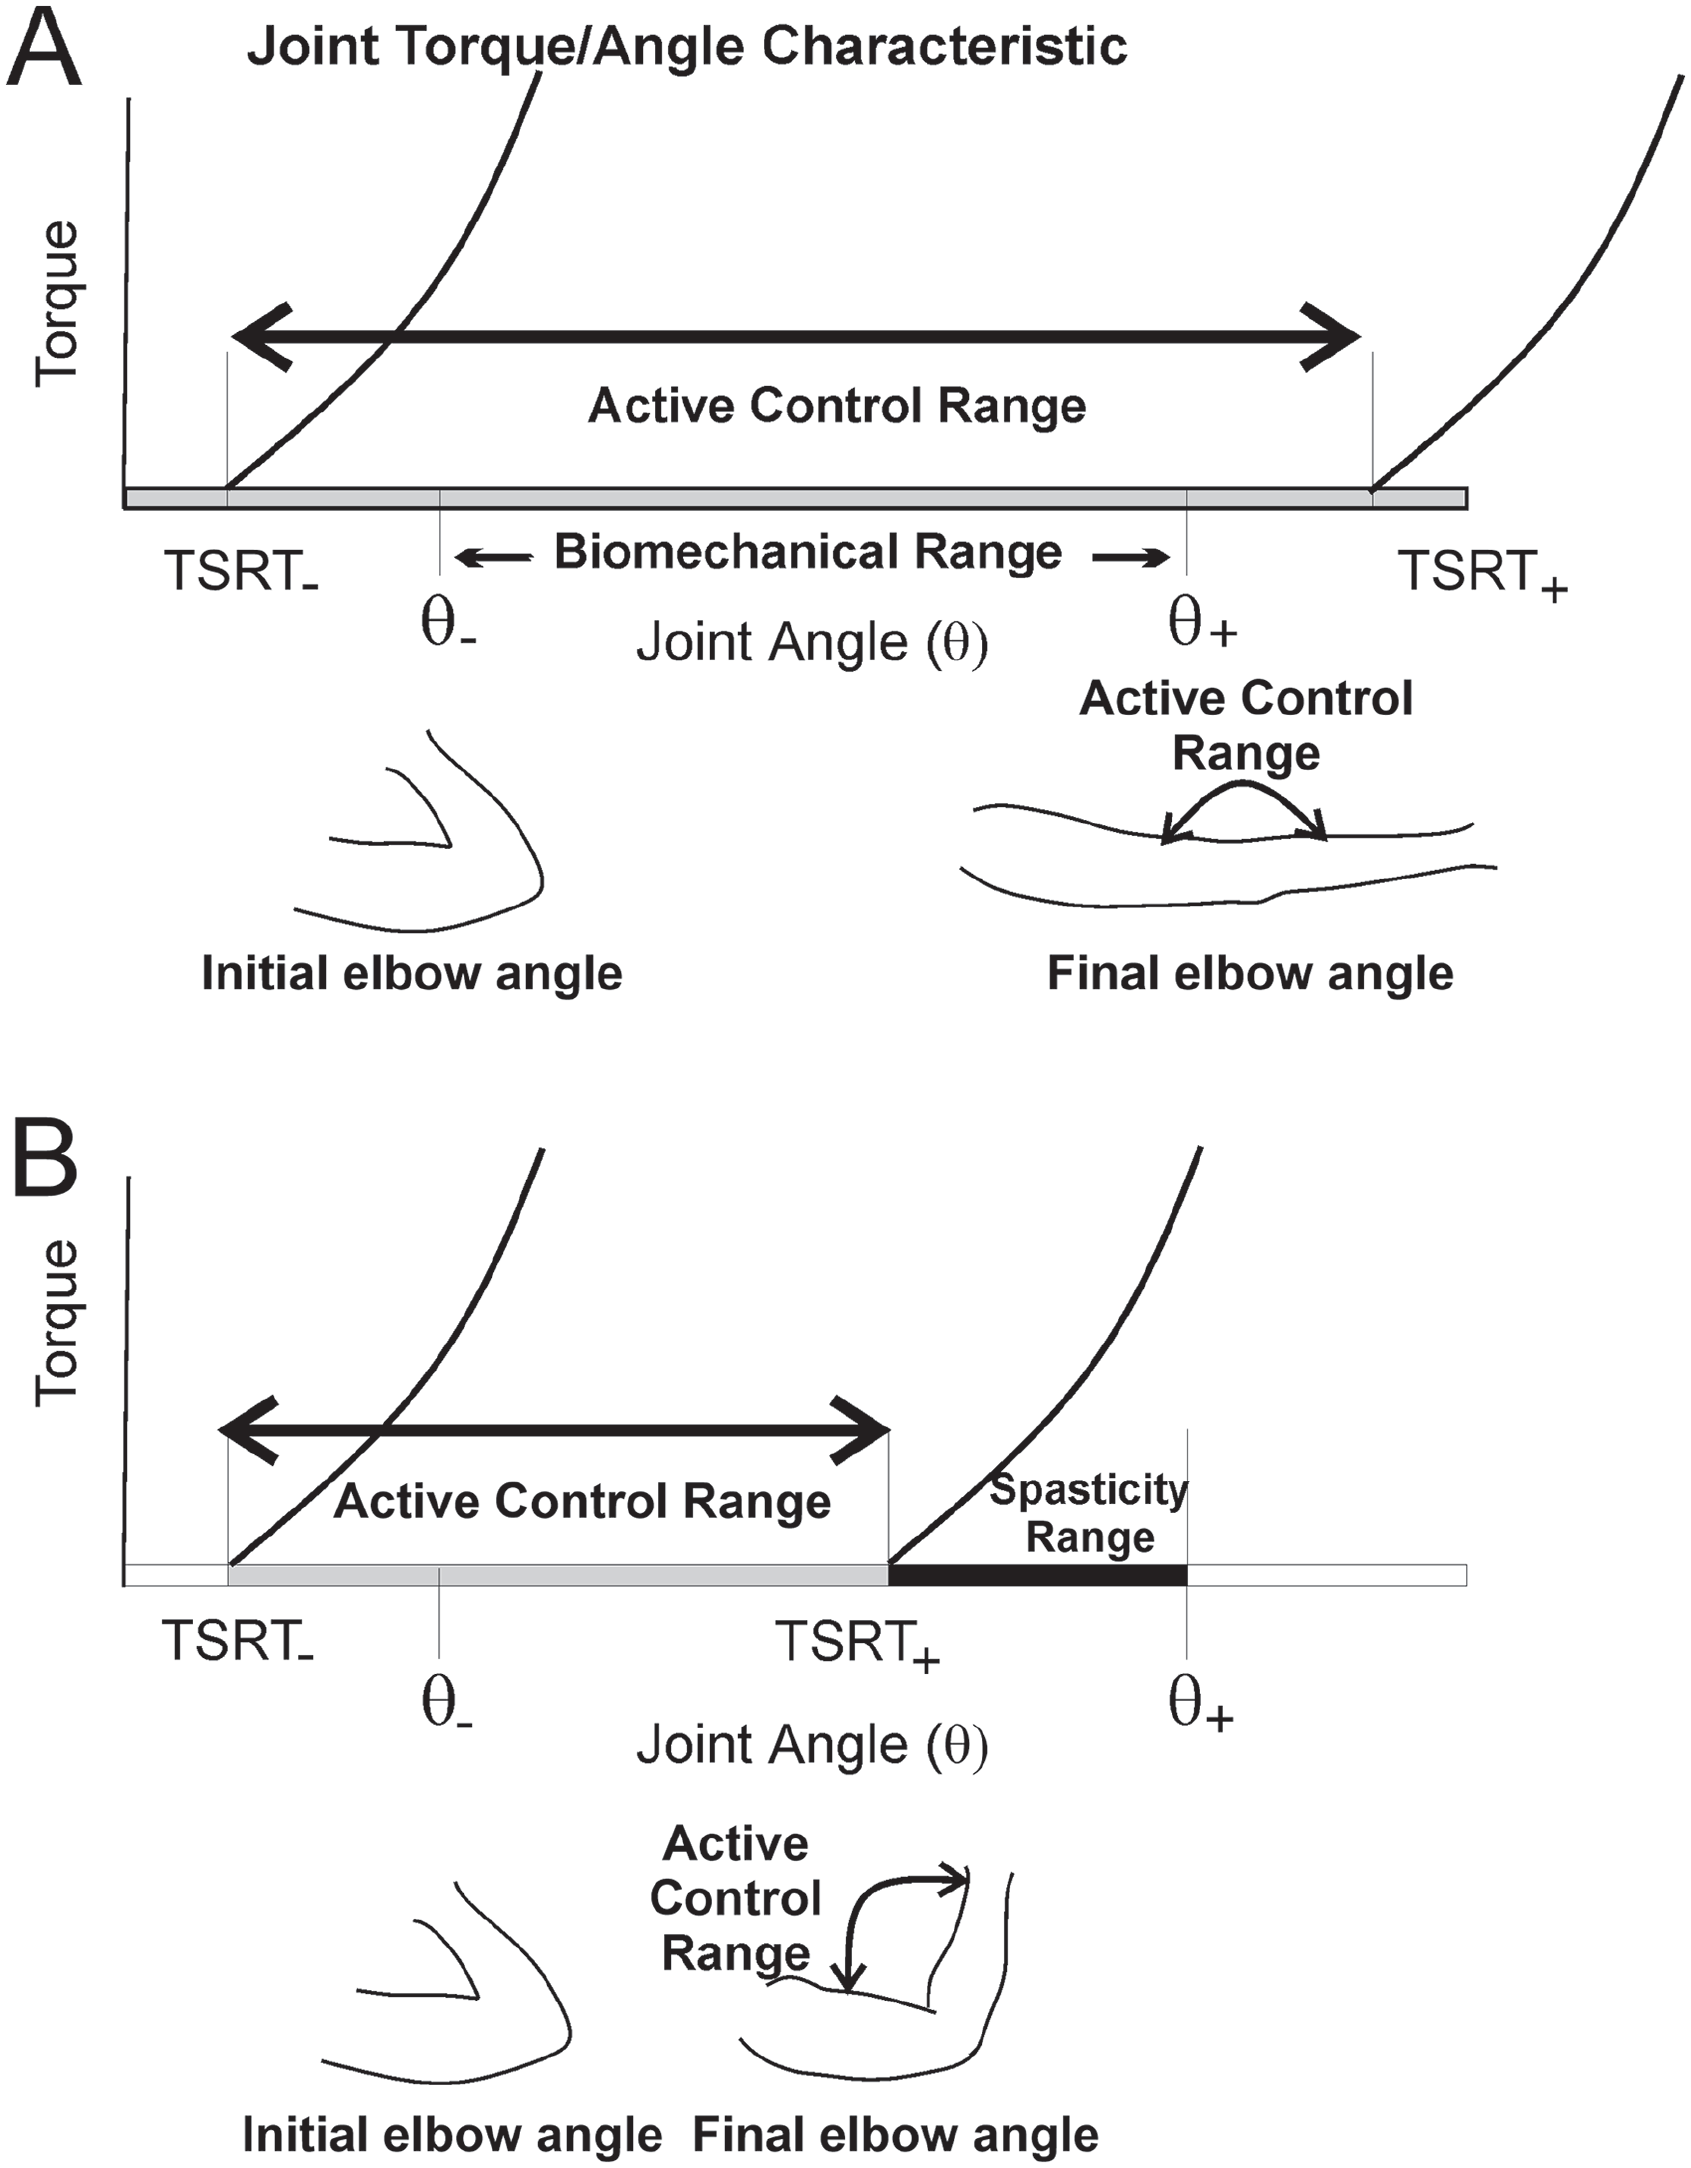
Mechanism of muscle activation by tonic stretch reflex threshold modulation. (A) Descending, intersegmental, and segmental inputs set the threshold (TSRT) at which muscle activation begins (ie, generation of active torque). The amount of torque generated by the muscle increases with increasing joint angle or muscle length (ie, the torque/angle characteristic of the muscle, curved black line). Normally, the range of TSRT regulation (TSRT−, TSRT+) exceeds the biomechanical range (θ−, θ+) of the joint. The muscle can be fully relaxed by shifting the TSRT+ outside of the biomechanical joint range and fully activated at shorter muscle lengths by shifting TSRT throughout the biomechanical range (Active Control Range). (B) After central nervous system lesions, the range of TSRT regulation may be reduced so that, at rest, the TSRT+ lies abnormally inside the biomechanical range. The joint range from the smallest angle (TSRT−) to the TSRT+ can be regulated normally by the nervous system (Active Control Range). However, the joint range between TSRT+ and the upper range limit (θ+) is marked by abnormal muscle activation (Spasticity Range). Actual elbow positions depicting the Active Control Range in healthy subjects (A) and in pathology (B) are shown below each panel.
After a CNS lesion, the ability to regulate TSRT may be restricted resulting in a limited range in which the patient can control muscle activation (Figure 1B; TSRT− to TSRT+), called the active control range. If the CNS is unable to shift the upper TSRT limit beyond the maximal joint angle (ie, 180°), the muscle is unable to relax at rest. A deficit in the ability to shift TSRT+ beyond the upper joint limit results in the appearance of spasticity at muscle lengths beyond this limit (ie, spasticity range, Figure 1B). If the lower limit of TSRT regulation is limited, the individual would not be able to activate the muscle at smaller joint angles, which may manifest as muscle weakness (ie, weakness range). This fine spatial structure of abnormal muscle activation is not considered in the traditional description of spasticity.
Problems in TSRT regulation result in the appearance of abnormal muscle activation patterns during voluntary movement. Features of range-dependent muscle activation abnormalities have been demonstrated in patients with chronic stroke making single and double-joint UL movements.28,29 Thus, in a patient with an elbow flexor TSRT at rest at 110°, attempts to make voluntary elbow extension movements beyond 110° were characterized by excessive agonist/antagonist coactivation and diminished active movement range. However, in the same patient, when elbow extension movements were limited to the active control range, normal movement, and reciprocal muscle activation patterns were observed. Recent studies show that limiting elbow movement during training to the active control range results in better reaching kinematics 30 and better movement adaptability in people with stroke. 31
TSRT measured with a portable device has robust psychometric properties (see Calota et al, 32 Frenkel-Toledo et al 33 ). The intra-rater and inter-rater reliability has been determined for elbow flexors (Intra-rater: intraclass correlation coefficient [ICC] = .46-.68; Inter-rater: ICC = .53-.68 32 ; MCD = 6.8° 33 ) in sub-acute and chronic stroke and in ankle plantar flexors (ICC = .851, confidence interval [CI] = 0.703-0.928, n = 28) 34 in chronic stroke. This suggests that the TSRT may be an important biomarker of sensorimotor impairment in people with CNS lesions. The question remains whether and to what extent alterations in TSRT and μ regulation may be related to functional movement deficits. Such measures may be more sensitive than clinical scales and kinematics usually used in stroke recovery trials to indicate changes in sensorimotor impairment.3,35 Before being adopted as biomarkers of change, the clinical validity of the measures needs to be established. The objective of the study was to examine the relationships between measures of elbow flexor impairment using TSRT and μ, and clinical scores of UL spasticity and motor function. We hypothesized that TSRT and μ would be related to clinical spasticity and motor impairment scores in patients with acute and chronic stroke.
Methods
Physiological TSRT angle and μ measures 36 and clinical measures of spasticity (Modified Ashworth Scale [MAS]) 37 and UL motor impairment (Fugl-Meyer Assessment of the Upper Extremity [FMA-UE]) 38 were collected from 8 studies conducted between 2010 and 2023 at the Sensorimotor Control and Rehabilitation Laboratory of the Centre for Interdisciplinary Research in Rehabilitation (CRIR).
In 3 studies (1 published 30 and 2 unpublished), multiple participant evaluations (≥3 pre/post evaluations) were performed. Two studies included unpublished data from 2 evaluations per participant (pre, post), while 3 studies (2 published32,39 and 1 unpublished) reported data from 1 evaluation (Table 1). All participants signed informed consent forms approved by the local Institutional Review Board (CRIR), according to the Declaration of Helsinki.
Demographic and Clinical Characteristics Based on the Number of Participants.

Values are listed according to the number of evaluations per participant and for the total sample. All values express numbers except for age.
Subjects
Included were individuals 18 to 80 years old, who could provide informed consent, had an ischemic/hemorrhagic stroke in either hemisphere leading to arm paresis (Chedoke-McMaster Arm Scale, 2-6/7 pt), 40 could voluntarily extend/flex the elbow at least 30°, and had increased resistance to passive stretch in elbow flexors (MAS > 1). In 6 studies, participants were in the chronic phase of stroke (>6 months 41 ). In 1 study focusing on enhancing arm mobility in stroke recovery, participants were in the early/late subacute phase (3 weeks-6 months post-stroke). In 1 study investigating the onset and progression of spasticity following stroke, inpatients were included in the acute/early subacute phase (3-28 days post-stroke) and followed for 12 weeks. In 3 studies, participants were excluded if they had contraindications to magnetic resonance imaging. In 2 studies involving arm training, patients were excluded if they exhibited significant neurological problems aside from stroke, neuromuscular/orthopedic problems, uncorrected vision, visuospatial neglect, and elbow proprioceptive impairments or pain that could interfere with outcome interpretation. Exclusion criteria also included marked cognitive/psychiatric disorders, alcohol/drug abuse and heightened skin sensitivity. Patients with a history of seizures or migraines, cranial metal fragments or implants such as cochlear or cardiac devices or under medication (eg, epileptic and psychoactive drugs) that might influence brain activity were excluded from studies that included brain imaging.
Procedure
In each study, demographic (ie, age, sex, stroke chronicity, type, and lesion location/side) and clinical data (ie, TSRT, μ, MAS, and FMA-UE) were collected for each participant.
Instrumented Measures
TSRT and μ were measured with the Montreal Spasticity Measure (MSM), 32 consisting of a 2-channel EMG system (Procomp5, Thought Technology, Montreal, QC, Canada), a high-precision servo-type electro-goniometer (P2200; Novotechnik U.S. Inc., Southborough, MA, USA) and dedicated software. The participant was placed in a comfortable position with the shoulder/elbow supported. After cleaning the skin with alcohol, silver–silver chloride self-referenced disposable surface electrodes (Thought Technology, EMG Myoscan sensors, Triode self-adhesive electrodes) were placed on motor points of Biceps Brachii (BB, agonist) and Triceps Brachii—lateral head (TB, antagonist) according to Surface ElectroMyoGraphy for the Non-Invasive Assessment of Muscles guidelines. 42 The electro-goniometer and elbow axes of rotation were aligned and goniometer arms were secured with Velcro straps to the arm and forearm. First, the maximal EMG was determined actively or passively and the initial angle of full elbow flexion was set in the MSM software. Then, the examiner stretched the arm from full elbow flexion to full extension using a bell-shaped velocity profile. The MSM guided the examiner to perform 20 stretches at randomized velocities by delivering auditory cues corresponding to slow, moderate, or fast velocities (~30-300°/s). At least 20 stretches were done with a minimum of 10 seconds rest between stretches to minimize fatigue and ensure muscle fiber recovery from the effects of the previous stretch. 43 Participants were instructed to relax completely and not assist or resist the passive angular displacements.
EMG signals were pre-amplified (×700) and band-pass filtered using a zero-lag Butterworth filter (30-500 Hz). EMG and electro-goniometer signals were sampled at 1000 Hz. Stretch reflex onset was determined when the EMG signal rose and remained above 2 to 3 times the mean baseline value depending on background activity level, and maintained for at least 15 ms. Stretch reflex onsets for each stretch velocity were termed DSRTs (DSRT; Figure 2A and B). Velocity and angles corresponding to each DSRT were plotted and the orthogonal linear regression was determined by MSM (Figure 2C). The DSRT represents the stretch reflex onset angle for a given stretch velocity and varies with stretch velocity. The behavior of DSRTs is defined by the centrally-determined command that sets the value of TSRT, presumably by altering γ-dynamic MN sensitivity in the spinal cord. The parameter μ reflects the velocity-sensitivity of the stretch reflex, measured as the slope of the regression through the DSRTs. 44 The resultant regression has a negative slope indicating that stretch reflex thresholds decrease as stretch velocity increases. The value μ is measured in seconds (s) and reflects the time to activate the muscle at a given speed of stretch. TSRT is computed as the intercept of the velocity/angle regression line with zero velocity (Figure 2C). TSRT and μ measure the relationship between stretch reflex excitability and velocity, indirectly reflecting the excitability of α-MNs in the spinal cord. A higher angular value of TSRT indicates a smaller joint range of disordered muscle activation and a lower value of μ indicates a decrease in excitability of the stretch reflex. Thus, higher TSRT angles and lower μ values indicate improvements in spasticity (ie, decreased spasticity), and presumably better muscle function.
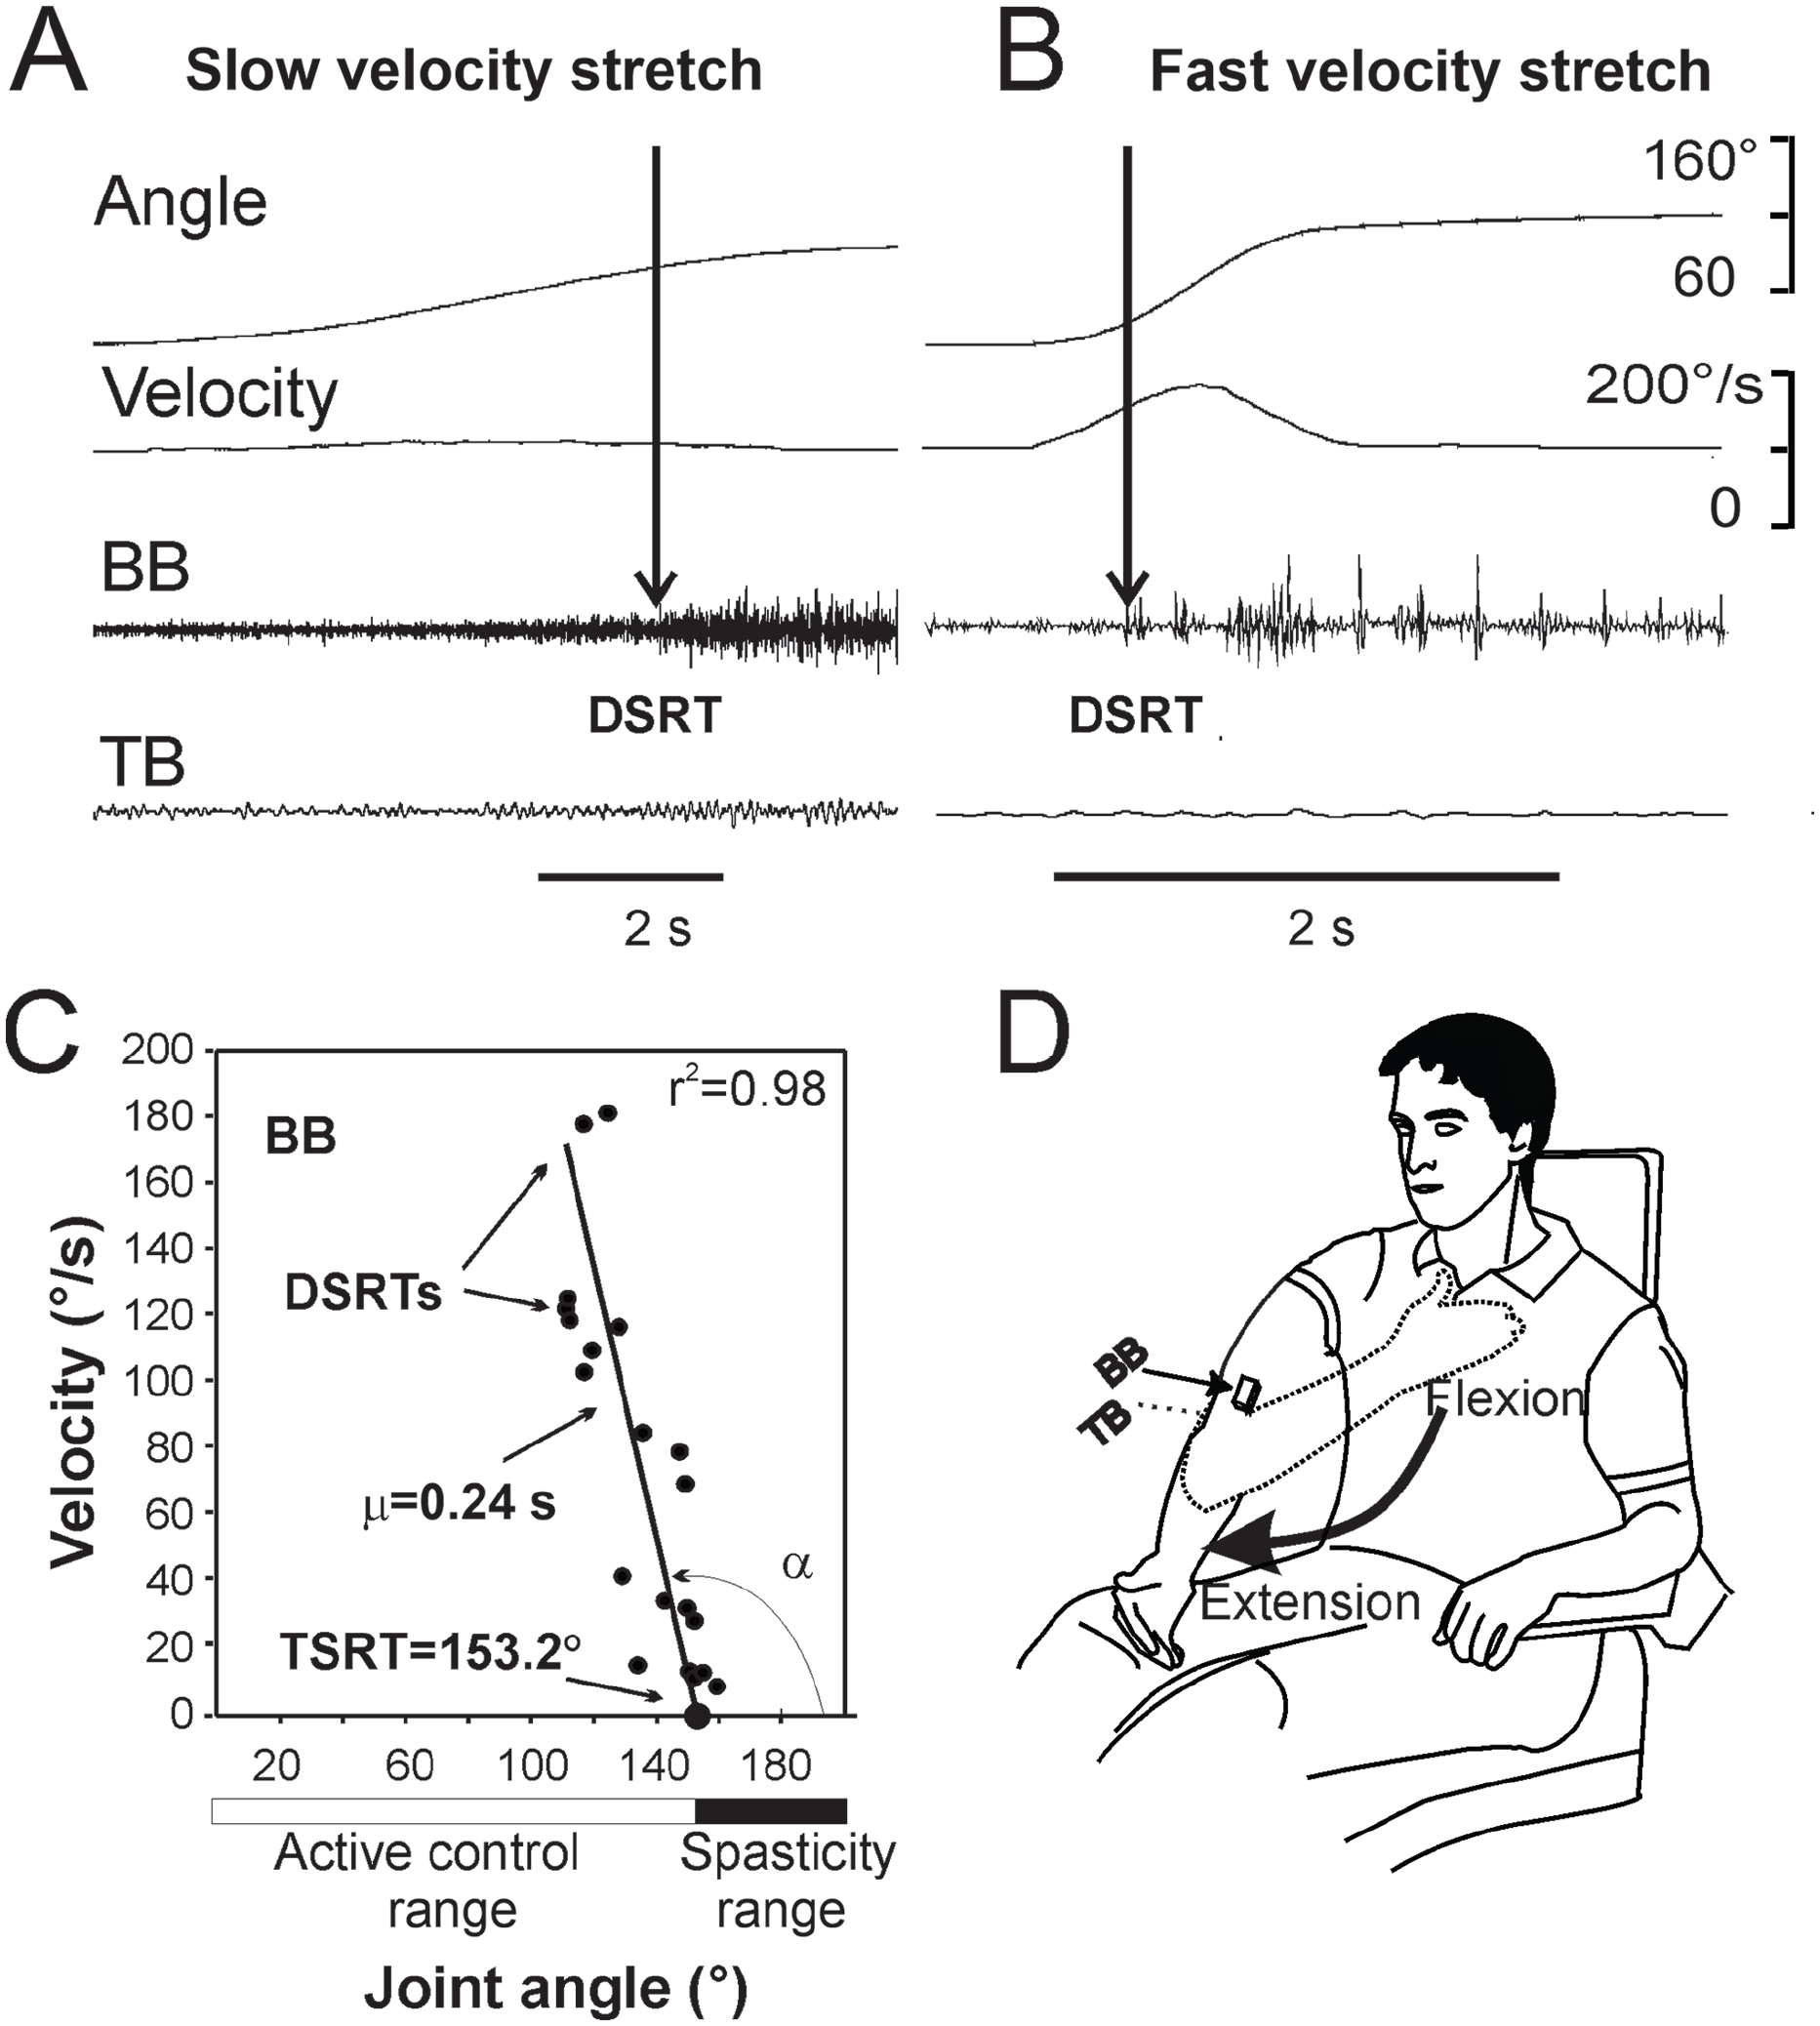
Determination of TSRT. (A and B) Examples of Dynamic Stretch Reflex Thresholds (DSRTs) evoked in 1 representative patient in elbow flexor muscles at a slow (A) and fast (B) velocity stretches. EMG onset in an elbow flexor muscle (Biceps Brachii [BB]; vertical arrows) were determined as the time when the stretch-evoked muscle activation rose and remained above 2 times the mean baseline value for a minimum of 15 ms. Values of angle and velocity at the point of EMG onset described the DSRT for that velocity of stretch. (C) Plot of the orthogonal regression through 20 DSRTs computed on-line by the algorithm. The slope of the regression represents the velocity-dependence of the stretch reflex threshold and is described by μ. The intercept of the regression line with the abscissa indicates the TSRT angle. Shown below the graph is the range between the smallest joint angle and the TSRT angle that is characterized by normal muscle activation patterns (active control range; white horizontal bar). The joint range between the TSRT to the end of the joint range is characterized by abnormal muscle activation (spasticity range; black horizontal bar). (D) Illustration of the how stretches were applied to the upper extremity from full flexion to full extension of the elbow when the patient was in a sitting position.
TSRTs in elbow flexors measured with MSM in sub-acute and chronic stroke showed moderately-good inter-rater reliability (Chronic: ICC = 60%, CI = 0.24-0.85; P = .001 32 ; Sub-Acute: 79%, CI = 0.26-0.94, P < .01) 33 and moderately-good test-retest reliability (ICC = 68%, CI = 0.19-90, P = .008) 32 with an external responsiveness of 6.8° to 11.2° to detect clinically meaningful differences.32,33 Similar statistics are not available for parameter μ.
Clinical Measures
Two widely recommended outcome measures were used to reflect clinical status. The MAS 37 is a 6-point scale measuring total accumulated muscle resistance to stretch, irrespective of stretch velocity. Scores range from 0 to 4, with higher scores representing increased resistance to stretch. The MAS has low reliability and questionable validity 45 as it only captures 1 aspect of spasticity. Its reliability varies depending on the muscle group, being most effective for UL muscles.46,47 Despite these limitations, MAS remains popular due to its ease of use in clinical settings. 48
The FMA-UE is considered the gold standard motor impairment measure. 49 It is a valid 50 and reliable 51 scale that evaluates arm movements within and out-of-synergy, hand movements, reflexes, and coordination. Scores range from 0 to 66 pt, where 66 pt reflects normal UL movement. 38 We collected the total score (out of 66 pt) as well as the score of Section A—Upper Extremity (FMA-UE_A) out of 36 pt describing shoulder-elbow movements made in- and out-of-synergy and reflex function.
Statistical Analysis
The total sample was divided according to stroke chronicity: acute-early subacute (1 day to 3 months, ie, 1-90 days), late subacute (3-6 months, ie, 91-180 days), and chronic (>6 months, ie, >180 days). 41 UL motor impairment severity was considered as follows: severe (FMA-UE 0-20 pt), moderate (FMA-UE 21-48 pt), and mild (FMA-UE ≥49 pt). 52
To comprehensively characterize the sample, descriptive statistics were used with mean ± standard deviation (SD), 95% CI, median with range (min−max), and interquartile range (IQR = Third Quartile [Q3] − First Quartile [Q1]), and frequency with percentage when appropriate. Demographic (ie, age and sex) and clinical differences between chronicity groups (ie, TSRT, μ, MAS, and FMA-UE) were studied with 1-way analysis of variance and Chi-square (χ2), with Bonferroni corrections for post hoc tests. To investigate the relationships between the TSRT and μ with UL clinical measures, Pearson correlation (r) analyses were performed. Separate multiple regression analyses were conducted to assess the proportion of the variance in the dependent variable (FMA-UE/FMA-UE_A) explained or predicted by the independent variables (TSRT and μ). Note that DSRTs were not considered as independent variables in the regression analysis because they were only used to calculate the TSRT, which reflects the centrally determined motor control impairment of the individual. Prior to running the regressions, the independent variables were tested for multicollinearity (ie, strong correlations among independent variables, correlation coefficient ≥.7), homoscedasticity, and outliers. Statistical analyses were done with Statistical Package for Social Sciences v29.0 (SPSS Inc., Chicago, IL, USA) and an α value of P < .05.
Results
Patients with stroke were 60.3 ± 13.7 years and had either an ischemic or hemorrhagic subcortical or cortical lesion leading to right or left hemiplegia/paresis. Each project’s inclusion criteria dictated the phase of stroke recovery placing participants within the acute/early subacute, late subacute, or chronic stage.
TSRT, μ, MAS, and FMA-UE data (ie, datasets) were derived from 120 patients. Following an initial screening in which incomplete datasets were excluded, 257 complete datasets remained, which were further reduced to 248 after removal of those with null TSRT values. A null TSRT value could indicate that a TSRT was not detectable.
Participant Characteristics
Clinical and demographic participant characteristics are shown in Table 2.There was a higher proportion of male participants in the chronic phase compared to a balanced distribution in other groups (χ2 (2, N = 248) = 11.52, P = .003; Table 2). UL impairment severity was not different among the 3 chronicity groups (χ2 (4, N = 222) = 6.83, P = .145). There was no significant difference among groups for age (F(2, 242) = 2.738, P = .067, η² = .022).
Demographic and Clinical Characteristics Based on the Number of Evaluations.

Abbreviations: CI, 95% Confidence Interval; FMA-UE_A, Fugl-Meyer assessment—upper extremity; FMA-UE_total, Fugl-Meyer assessment upper extremity—total; IQR, interquartile range; MAS, Modified Ashworth Scale; Max, maximum; Min, minimum; n, number of valid cases; SD, standard deviation; TSRT, tonic stretch reflex threshold; UL, upper limb; 95%Med, median.
Values are listed according to the level of chronicity and for the total sample.
χ2 P < .05.
One-way Anova P < .05.
TSRT was significantly different among the 3 groups (F(2,245) = 9.494, P < .001, η² = .072; Figure 3) with the TSRT for the acute/early subacute (ie, 1-90 days) group significantly higher than that of the chronic group (mean difference: 16.64, 95% CI [6.49, 26.79], P < .001). There were no significant differences among groups for μ (F(2, 245) = 1.079, P = .341, η² = .009, Figure 3), or FMA-UE_total (F(2, 219) = 0.216, P = .806, η² = .002). Acute/subacute stroke survivors (n = 35) had significantly lower FMA-UE_A scores (t(43) = 2.999, P = .004, mean difference: 10.99, 95% CI [3.60, 18.37]) compared to participants in the chronic stage (n = 10). Higher MAS scores were likely to be prevalent in the chronic phase, while lower MAS scores were more prevalent in the acute/subacute stage (χ2 (10, N = 247) = 77.57, P < .001).
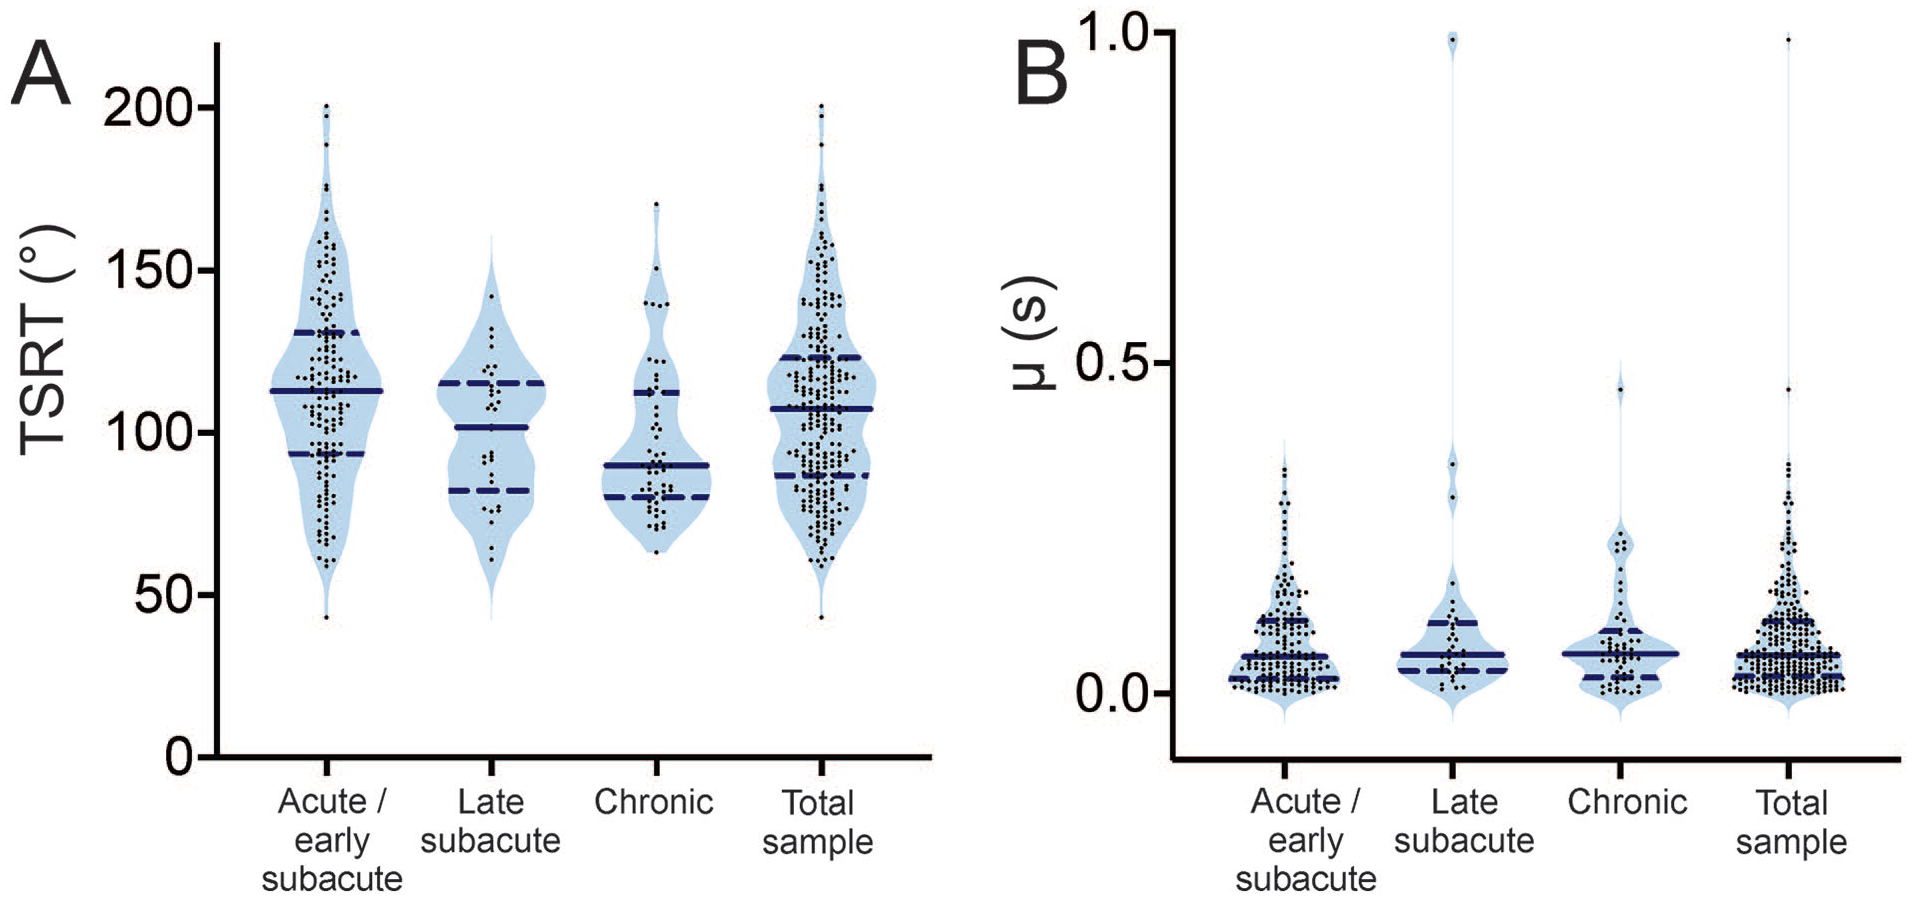
Violin plots showing the distribution of individual data points of tonic stretch reflex threshold (TSRT) (A) and μ (B) across chronicity phases. Chronicity phases are divided into acute/early subacute (n = 158), late subacute (n = 34), and chronic (n = 56) stages, as well as the total sample (n = 248). Each dot represents a single value. In each violin plot, the solid horizontal line represents the median, and the dashed lines represent the first (lower dashed line) and third (upper dashed line) quartiles. See Table 2 for the full descriptive statistics.
Relationship Between TSRT/μ and Clinical Measures
The heatmap shows all the correlations and significance levels (Figure 4). For all subjects, TSRT was positively correlated with μ (r = .386, P < .001) and was negatively correlated with both Chronicity_days (r = −.158, P = .013) and MAS (r = −.317, P < .001). Additionally, μ was positively correlated with FMA-UE_A (r = .483, P < .001). In the acute/early subacute group, TSRT was correlated with μ (r = .592, P < .001), Chronicity_days (r = −.330, P < .001), and MAS (r = −.469, P < .001). Mu was positively correlated with FMA-UE_A (r = .463, P = .005).
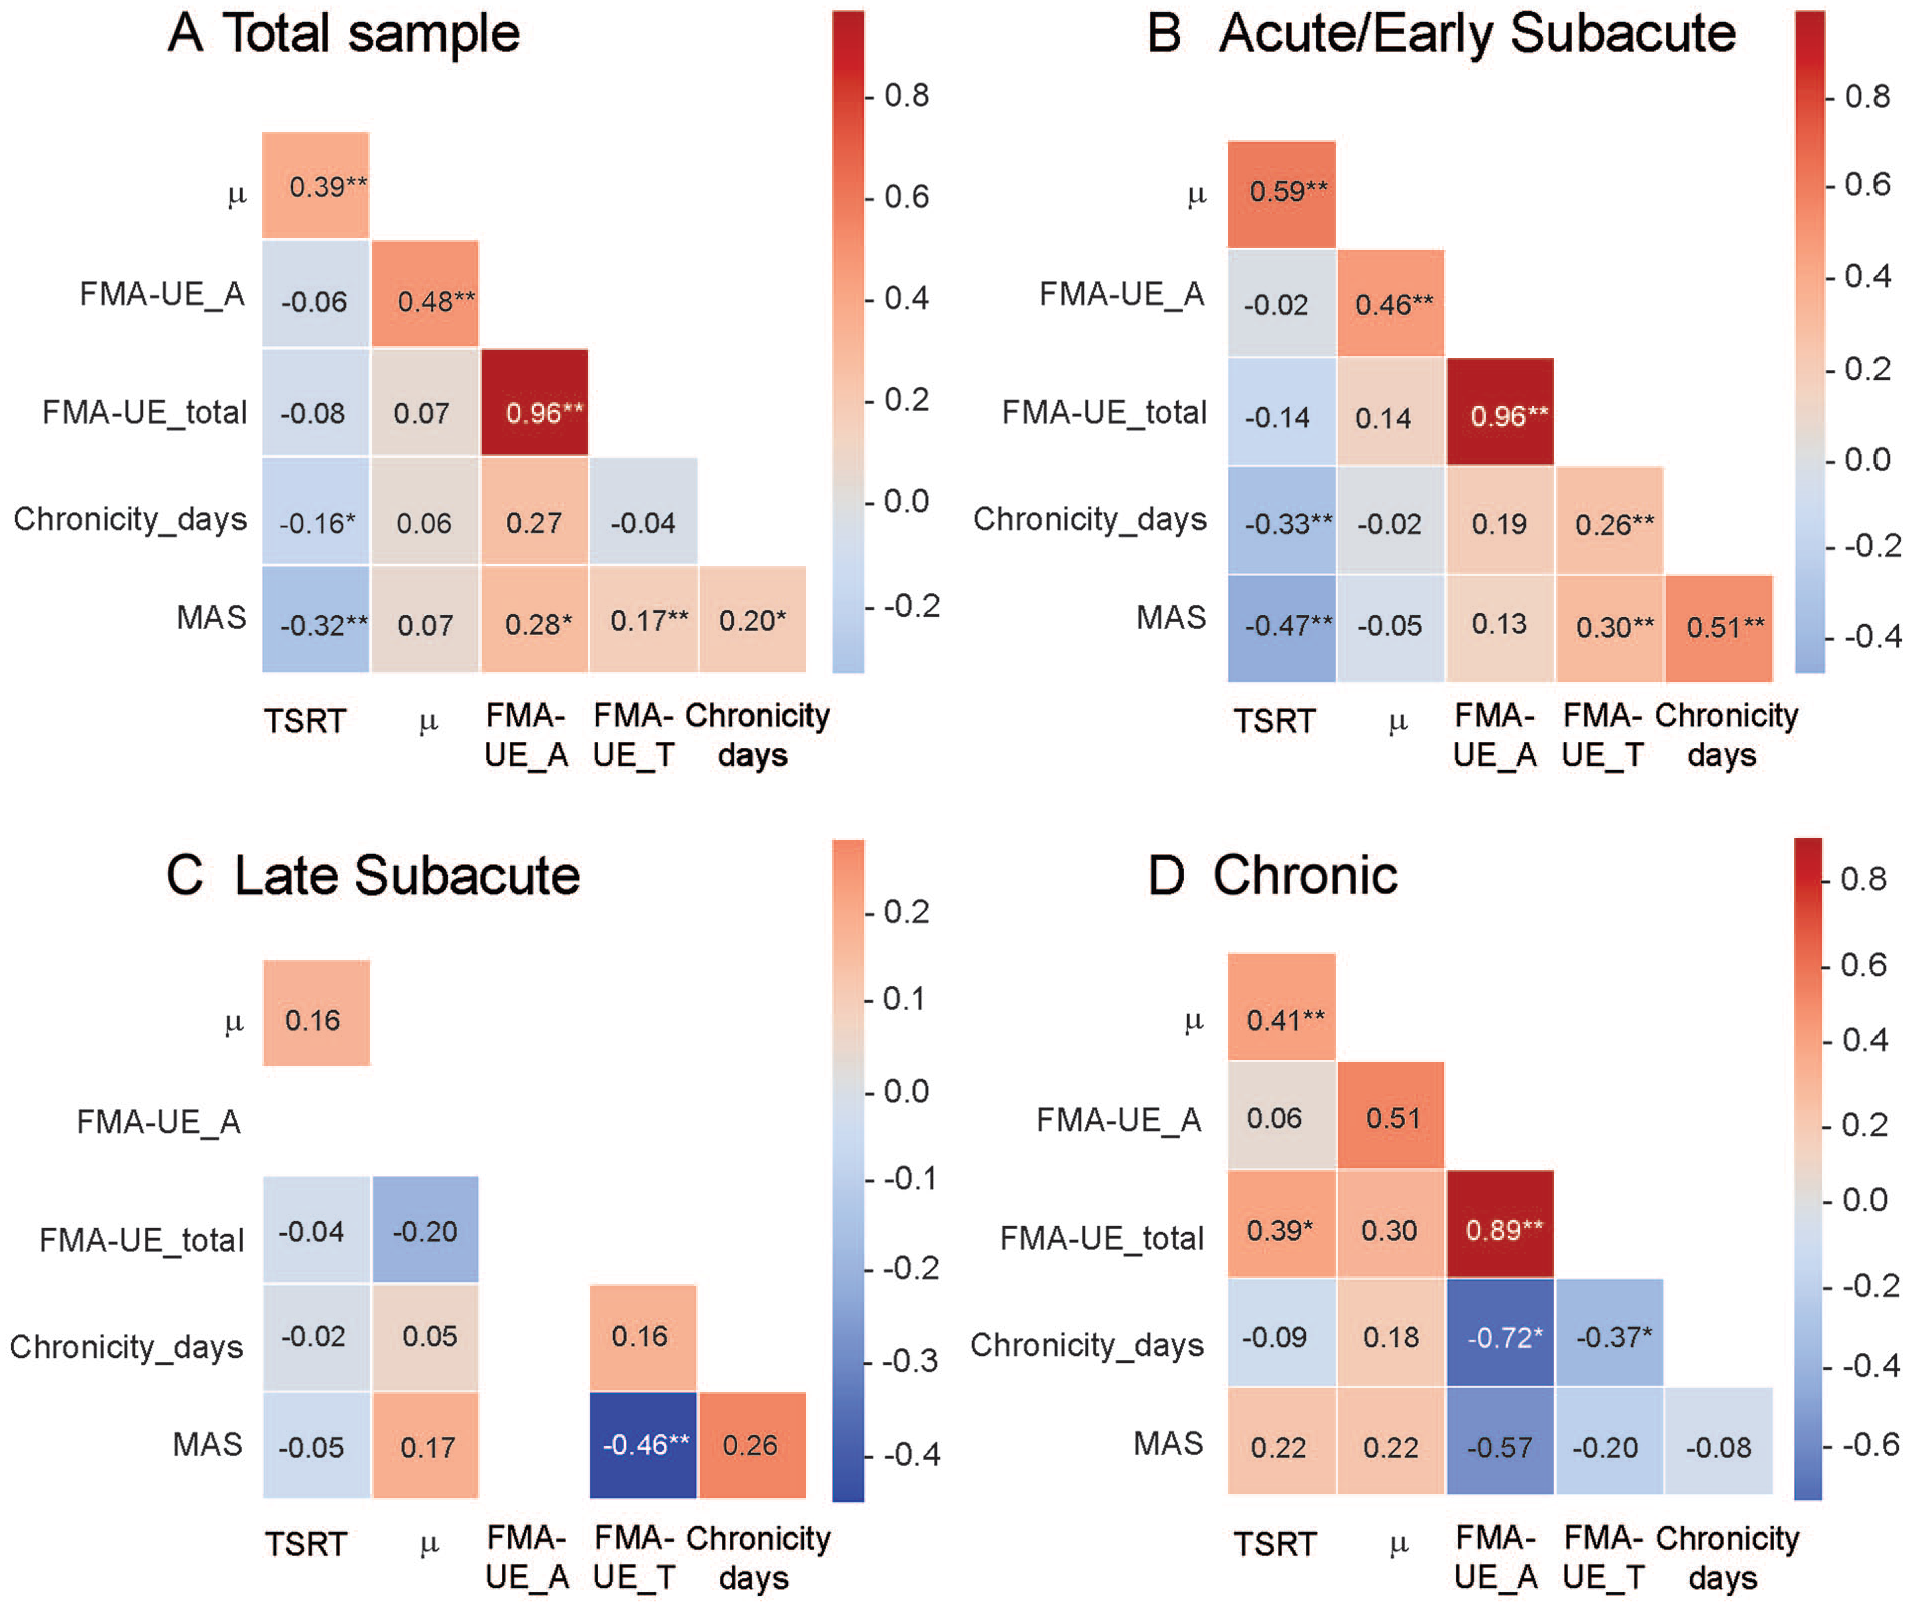
Heatmaps displaying the magnetized correlations for the total sample (A), Acute/Early Subacute (B), Late Subacute (C), and Chronic (D) stroke participants. Red shades show positive correlations, while blue shades show negative correlations. The intensity of the color indicates the strength of the correlation (ie, darker colors indicate stronger correlations). Note that in the Late Subacute phase (C) there were no data for FMA-UE_A.
In the late-subacute group, significant correlations were limited to FMA-UE_total showing a negative correlation with MAS (r = −.458, P = .007). For individuals in the chronic stage (>180 days), TSRT was positively correlated with μ (r = .410, P = .002) and FMA-UE_total (r = .390, P = .025). Mu showed a positive but non-significant correlation with FMA-UE_A (r = .509, P = .133).
Multiple Regression Analysis
Multiple regression analyses investigated the extent to which the variance in UL motor impairment, as assessed by the FMA-UE (FMA-UE_A and FMA-UE_total), could be explained by TSRT and μ across the entire sample. The first model showed a significant relationship of FMA-UE_A, explaining 72.0% of the variance (R² = .720, F(2,43) = 55.185, P < .001). TSRT (β = .519, t = 3.923, P < .001) and μ (β = .376, t = 2.840, P = .007) significantly contributed to the prediction of FMA-UE_A.
For FMA-UE_total, the analysis revealed a significant relationship, explaining 68.7% of the variance (R² = .687, F(2,252) = 276.036, P < .001). TSRT (β = .863, t = 16.798, P < .001) significantly contributed to the prediction of FMA-UE_total, while μ had no impact on the model (β = −.048, t = −.930, P = .353).
Discussion
This study is the first demonstration of the potential value of TSRT and μ as biomarkers of clinical impairment and clinically relevant change in post-stroke UL sensorimotor disorders. The statistical approach employed should be considered in results interpretation. The use of a range of descriptive statistics (eg, mean [SD], 95%CI, median, range, and IQR) allows clinicians and researchers to understand central tendencies and variability, which well-describe the stroke participants, enhancing results generalizability. The use of correlation and regression statistics within the context of a cross-sectional study (with data collected over multiple years) helps to understand interrelationships between variables. However, it does not examine the validity of whether TSRT and μ in the acute phase can predict final patient values, as this would require following the same cohort of individuals from the acute to the chronic phase. Post-hoc tests indicated that the acute/early subacute group had higher TSRT values and lower FMA-UE_A and MAS scores than the chronic group. These findings reflect the patient’s condition during this early post-stroke period, where muscle tone remains flaccid, spasticity has not fully developed, and motor function is still limited. Specifically, multiple regressions investigating the extent to which TSRT and μ explained 72% of the variance in impaired UL motor function (measured through FMA-UE-A), supported, for the first time, a significant relationship between deficits in threshold regulation and UL motor impairment in stroke survivors. Regression models were fitted with a 0-intercept, because FMA-UE and FMA-UE_A are expected to equal 0 if TSRT = 0 and μ = 0, 53 that is, meaning no voluntary movement is possible.
Role of Biomarkers of Impairment in Stroke Rehabilitation and Research
Biomarkers of change in sensorimotor function are important since they can provide an understanding of the neurobiology of spontaneous or treatment-induced recovery, leading to the development of more effective therapeutic interventions for people with stroke. The International Stroke Recovery and Rehabilitation Alliance (ISRRA) has published consensus statements on the importance of the development of biomarkers of sensorimotor impairment for both clinical decision-making and research studies.41,54 In addition to stroke recovery biomarkers (eg, corticospinal tract integrity), better biomarkers of sensorimotor impairment could be used to make more accurate predictions of the outcome of stroke rehabilitation and permit more accurate clinical goal setting and more appropriate selection of treatment interventions for individual patients. Both recovery and impairment biomarkers can also be used to classify and stratify participants in research studies to limit sample heterogeneity or to account for it in outcomes of clinical trials. 54 This may result in clinical trials of novel treatments having a higher chance of success by identifying the true effect of the intervention at the sensorimotor impairment level.
The most commonly used biomarkers of stroke recovery are characterizations of the structure and function of lesioned and non-lesioned brain areas through neuroimaging (eg, Burke Quinlan et al 55 and Laaksonen and Ward 56 ). Another important biomarker is corticospinal tract white matter integrity evaluated through neuroimaging and transcranial magnetic stimulation (eg, Stinear 57 ). While neuroimaging/ functional biomarkers are important to predict general motor recovery, they do not provide specific information about motor impairment at the level of the affected limb. In addition to biomarkers of stroke recovery, biomarkers of sensorimotor impairment at the behavioral level are essential to determine the impact of therapy. For the UL, one such marker of the quality of planar reaching was described using kinematic analysis. 58 Numerous other movement outcomes have been used to quantify improvement of UL kinematics in different interventions, 59 such as synergistic shoulder and elbow movements (eg, Ellis et al 60 ), muscle synergies (eg, Cheung et al 61 ), endpoint reaching velocity and accuracy (eg, Piscitelli et al 62 ) as well as composite indices of multiple joint kinematics (eg, Cortes et al 63 ).
Although such measures may be more objective than clinical measures in describing motor behavioral change at the movement output level, they remain descriptive and do not explain the underlying impairment at the motor control level that results in the disordered movement. Finally, other physiological measures have been used to characterize changes in MN excitability, such as the H-reflex. The H-reflex is not commonly used in clinical studies because of the need for instrumentation to record and measure responses. The H-reflex reflects MN excitability in the stretch reflex arc but does not provide any information about the spatial location of the stretch response, whereas the TSRT provides specific information about how spasticity affects the ranges of normally-organized and disordered movement.
Explanation of TSRT and μ as Biomarkers of UL Motor Function
Disruption of movement kinematics is a common characteristic of impaired UL reaching movements in people with stroke (eg, Levin, 64 Hammerbeck et al, 65 and Hussain et al 66 ). The novel finding in this study is that the TSRT angle and the value of μ were related to UL movements as measured by FMA-UE. The TSRT angle indicates the range in which normal joint movements can be produced (active joint range; ie, from the minimal joint angle to the TSRT angle) as well as where movements are disrupted (spasticity range; ie, the outer range of the joint from the TSRT angle to the range limit). The parameter μ indicates the reduction of the active joint range when movements or stretches are made at faster speeds. 27 A lower TSRT indicates a larger spasticity zone at rest. The range of μ was 0.001 to 0.347 seconds which is consistent with previous studies. 44 Within this range, a lower value reflects less velocity sensitivity while a higher value indicates an earlier (ie, greater damping) response to muscle lengthening. In other words, μ reflects how much the spasticity-free joint range decreases when the limb is stretched or voluntarily moves faster. As μ approaches 0, velocity-dependence is lost (ie, rigidity). Parameter μ has been shown to discriminate between different types of hypertonia (ie, spasticity vs rigidity 44 ) but since its psychometric properties have not been determined, interpretations of changes in μ in clinical populations should be made with caution. Voluntary movements made within the spasticity zone are marked by disrupted muscle activation patterns, such as abnormal coactivation. 28 This can explain the altered kinematics when the whole range of UL movements are made and is not limited to a specific motor action. Thus, the TSRT and potentially μ may be considered as biomarkers of motor impairment.
Limitations of the Study
This study suffers from the same limitation as much research in this area in that it is cross-sectional. The cross-sectional design was used as a first step in the understanding of the TSRT and μ as biomarkers of change in a large cohort of stroke survivors, further supporting their biological plausibility. However, it is acknowledged that responsiveness and causal inference of these measures should be further examined in future longitudinal studies, with a larger cohort balanced for the number of subjects with different levels of chronicity and stroke severity. The study focused on relationships between measures in different phases of stroke, but it did not address the heterogeneity of the sample such as differences in associations based on the type of stroke, lesion location, or age, which should be conducted in future studies. Finally, use of an instrumented test of TSRT and μ requiring material, software, and specialized training may limit clinical uptake of these measures.
Conclusions/Implications
Stroke results in several sensorimotor impairments, including spasticity, which pose significant challenges for treatment and patient care. 67 Clinicians aim to restore motor function and minimize impairment in the affected limb as effectively as possible. Therefore, it is crucial to understand the mechanisms underlying sensorimotor impairment at the motor control level and to detect early signs of changes in sensorimotor function, including defining the spasticity range in joint movement. While FMA_UE and MAS subjectively measure clinical impairment and spasticity respectively, this study explores objective biomarkers of impairment that broadly correlate with these 2 widely-used clinical scales. These biomarkers may facilitate early detection of changes in sensorimotor impairment, enabling timely intervention and potentially leading to better outcomes. Moreover, it may allow for an objective monitoring of patient progress. This study is 1 step in the process of validating the TSRT and μ as personalized biomarkers of stroke recovery. By tracking changes in the physical joint space that can be controlled by the patient, clinicians may be able to remediate motor impairment and evaluate the effectiveness of various therapeutic techniques on improving function.
Footnotes
Acknowledgements
We would like to thank all of the participants for volunteering their time for this study. We acknowledge the contributions of Andra Calota, Sijad Ghani, Alice Misana, Aditi Mullick, Nadine Musampa, Caroline Rajda, and Katharine Scarlat in acquiring the unpublished data used in this study.
Author Contributions
Daniele Piscitelli: Conceptualization; Data curation; Formal analysis; Methodology; Writing—original draft; and Writing—review & editing. Joy Khayat: Data curation; Formal analysis; Methodology; Writing—original draft; and Writing—review & editing. Anatol G. Feldman: Methodology; Writing—original draft; and Writing—review & editing. Mindy F. Levin: Conceptualization; Data curation; Methodology; Project administration; Resources; Validation; Writing—original draft; and Writing— review & editing.
Data Availability Statement
Data will be available on written request to the corresponding author.
Declaration of Conflicting Interests
The author(s) declared no potential conflicts of interest with respect to the research, authorship, and/or publication of this article.
Funding
The author(s) disclosed receipt of the following financial support for the research, authorship, and/or publication of this article: Some of the data included in the analysis was supported by the Canadian Institutes of Health Research and the Centre for Interdisciplinary Research in Rehabilitation.