
Abstract
Background
After a stroke, the use of the paretic arm is determined by its capacity (what it can or cannot do). When both arms have capacity to perform a task, the choice of which arm to use must be based on another criterion, probably by comparing the efficiency of each arm. Two numerical models account for this: the capacity model (the paretic arm is chosen in preference) and the efficiency model (the most efficient arm is chosen).
Objective
To numerically determine whether capacity or efficiency best predict the use of the paretic arm in activities of daily living.
Methods
We performed numerical simulations to predict paretic arm use with either the capacity model or the efficiency model. We used the Bayesian Information Criterion (BIC) to compare the adequacy of the 2 models in predicting clinical and accelerometric data collected from 30 patients with chronic stroke.
Results
The efficiency model predicted arm use in activities of daily living better than the capacity model (BIC = −66.95 vs −5.89; root mean square error = 0.26 vs 0.72).
Conclusions
The study highlights the importance of considering efficiency when assessing paretic arm non-use. Assessing individuals’ arm efficiency should help personalize rehabilitation strategies after stroke.
Introduction
Following a stroke, arm sensorimotor deficits affect 35% to 48% of individuals in the acute phase. 1 Strength, coordination, muscle tone, and sensitivity disorders significantly affect coordinated actions required for moving and manipulating objects in daily life (ie, arm use) using the paretic arm. 2 These impairments persist into the chronic phase for almost half of hemiparetic post-stroke survivors. 3 In response, individuals reduce the use of the paretic arm and often compensate with the non-paretic arm. 4 If this adaptation persists as the dominant behavior despite paretic arm capacity recovery, it is termed “non-use,” indicating that arm use falls below the potential arm capacity.5,6
Traditionally, non-use is assessed through an arm choice task, comparing spontaneous arm use (free choice between the paretic arm and the non-paretic arm) with maximal arm use as a measure of arm capacity.5,7 -10 Building on this method, recent research has revealed a high prevalence of non-use in chronic stroke, highlighting its potential to impede recovery and impact patients’ quality of life. 11
However, the choice of the arm for a given task may not depend solely on arm capacity. In individuals with stroke, the likelihood of using the paretic arm is diminished due to slower, less precise movements requiring greater effort.12 -14 This emphasizes the significance of arm efficiency in the context of post-stroke arm choice. While arm capacity simply measures the ability to perform the task (or not), 15 arm efficiency measures the ability to minimize resources consumption while performing the task.16,17
In healthy individuals, arm choice is determined by arm efficiency, in order to maximize the probability of success with minimal effort. 18 However, it remains unclear whether and how arm efficiency influences paretic arm use in activities of daily life.
The present study investigated whether in post stroke survivors, arms use in daily activities is best predicted by arm capacity or by arm efficiency. In a first step, we ran a numerical experiment in which we modeled arm use as a function of either arm capacity (ie, the paretic arm is chosen if it has the capacity) or arm efficiency (ie, the paretic arm is chosen if it has the highest efficiency). In a second step, the numerical results were compared with empirical data—clinical and accelerometric—from individuals with stroke.
Methods
Model Development
We developed 2 computational models to predict unilateral arm use in activities of daily living (ADLs) for stroke survivors. These models aim to enhance our understanding of the factors influencing arm choice, The full R code used for the simulations is available in the supplementary material. The key factors considered are:

where:
Both models consider any arm use below the expected level as non-use.
Arm Capacity Model
In this model, an arm is considered capable of performing a task when its available resources exceed the task requirements. We define the capacity of each arm as follows:
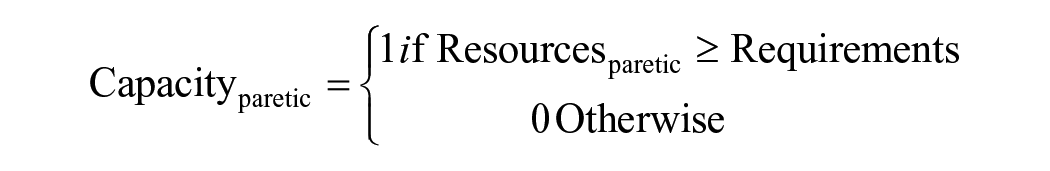
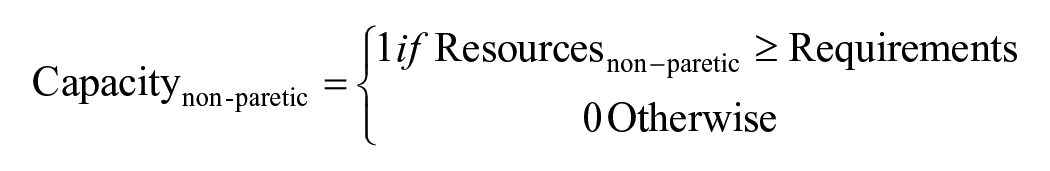
Arm Choice Criteria:
Arm Efficiency Model
In this model, we compute arm efficiency as the ratio between task requirements and available arm resources (this ratio represents the rate of resources consumption to perform the task). We define the efficiency of each arm as follows:


Arm Choice Criteria:
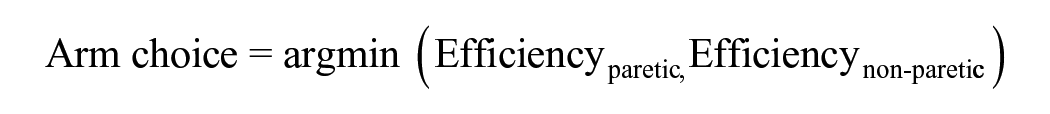
Following this logic, the arm with the highest efficiency is selected (ie, the chosen arm is systematically the one that minimizes resource consumption in the face of the requirements of the task).
In summary, both models compare the task requirements and the available resources, but the efficiency model extends the capacity model by providing a supplementary criterion based on efficiency for arm choice in situations where both arms demonstrate sufficient capacity for the task. Otherwise, the arm choice criteria remain the same as in the capacity model.
Simulation
A total of 10 000 individuals are simulated, each assigned a random resource score for both the paretic and non-paretic arms, ranging from 0 to 100 according to a uniform distribution. Each individual performed 1000 simulated tasks. Every task was randomly assigned a difficulty level between 1 and 100 following a uniform distribution. Additionally, for each of the 1000 simulated tasks, lateralization is randomly selected from normal distribution with a mean of 0 and a standard deviation of 0.3, and limited to the range from −1 (indicating the least effort required for the non-paretic arm side) to 1 (indicating the least effort required for the paretic arm side).
Clinical Setting
In the current study, we carried out a secondary empirical analysis of the ReArm clinical trial. 21 Participants with chronic stroke wore accelerometers at home for 7 days, and underwent clinical motor assessments. These clinical assessments were employed to assess arms resources (see “clinical assessment variables” part), while the accelerometric data were utilized to evaluate arms use in the context of ADLs. This study was approved by the French Research Ethics Committee (CPP SUD-EST II, No. ID-RCB 2019A00506-51) on September 30, 2019.
Participants
The sample size of 30 participants was determined based on convenience sampling, due to the availability of participants and limited resources. This method was deemed sufficient to provide preliminary insights despite its inherent limitations.
Adults (>18 years old), more than 3 months after stroke, with a Fugl-Meyer Upper Extremity (FM-UE) score equal to or greater than 15 over 66, and were included after obtaining informed consent. The individuals were excluded if they had cognitive disorder (Mini-Mental State Examination <24/30), neglect (omission of more than 15 bells on the Bell’s test), or comprehension dysfunction (Boston Diagnostic Aphasia Examination <4/5).
Clinical Assessment Variables
The independent variables were:
(i) Motor impairment: evaluated by the FM-UE;
(ii) Motor function: assessed by the Wolf Motor Function Test (WMFT) and the Box & Block Test (BBT).
The age, gender, handedness, and laterality of the hemiparesis were also recorded.
Accelerometer Measurement Outcome
The primary outcome was the use of the paretic and non-paretic arms in ADLs at home quantified by the FuncUseRatio.22,23
Measurements
Accelerometer Data Collection and Processing
To measure the use of the paretic and non-paretic arms in ADLs, participants wore an accelerometer (AX3, Axivity, Newcastle Helix, UK) at each wrist for 7 days at home. The accelerometers collected data in the 3 planes of space at a frequency of 50 Hz and a range of ±8 g. Raw data were extracted using the OmGui Software (v.43) and saved as comma-separated values.
Signal processing was performed in Scilab 6.1.1 to obtain the number of each arm’s functional movements (FuncUse) during ADLs. The calculation for FuncUse was based on the method by Leuenberger et al 22 which uses inertial movement units. This method was adapted for accelerometers by Dusfour et al 23 In their study, the authors proposed to compute the orientation of the forearm (y axis) with respect to the gravity vector (Euclidean Norm) following the trigonometric laws:


From forearm orientation, an algorithm identifies and counts 2-second (non-overlapping) epochs during which arm movements exceed 30° amplitude, in a spatial range between −30° and +30° from the horizontal. To discern between unilateral and bilateral movements, signals from both accelerometers were synchronized. A movement was considered bilateral if both accelerometers detected a functional movement within the same epoch. Unilateral movements were then derived by subtracting bilateral movements from the total FuncUse per arm. Finally, we computed the use rate for each arm (paretic and non-paretic) by dividing the functional movements of 1 arm by the total movements. The bilateral movement rate was calculated similarly, dividing bilateral movements by the total functional movements.
Clinical Assessment
After the measurement of paretic and non-paretic arms use in ADLs, a clinical evaluation session was conducted by an experienced assessor.
The FM-UE is a gold standard assessment of arm motor impairment after stroke. 24 The FM-UE scores the proximal movements (shoulder, elbow, and forearm) on 42 points and the distal (wrist and hand) movements on 24 points, for a total of 66 points.
The WMFT evaluates the arm motor function with 6 items testing functional tasks, 9 testing movement quality, and 2 tasks that tests strength. An ordinal scale, ranging from 0 to 5 is used to score each item, except for strength (2 items) measured in kg. 25
The BBT is a global grip test, consisting of a box divided into 2 compartments and 150 cubes (2.5 cm in size), with the participants having to move the maximum number of cubes, from 1 compartment to the other one, in 60 seconds. 26
Statistical Analysis
All analyses were conducted using Rstudio 2023.03.0+386 with a significance level set at 5%.
Analysis of Simulated Data
The expected arm use and the available resources of each arm from our simulations were normalized to a ratio between −1 and 1. This was achieved by dividing the difference between the paretic and non-paretic arm scores divided by their sum. We then employed a non-linear sigmoid model to elucidate the relationship between these normalized ratios. Model efficacy was assessed using both the root mean square error (RMSE) and R².
Analysis of Experimental Data
Continuous variables are reported as means with their standard deviations, while categorical data are presented as counts and proportions. The Shapiro–Wilk test was utilized to examine data normality. Models predicting unilateral arm use only, and unilateral FuncUseRatio only, were used for analysis.
The FuncUse and BBT were normalized to a ratio between −1 and 1 using the aforementioned ratio method. For the FM-UE and WMFT, maximum scores were attributed to the non-paretic arm.
The association between independent variables and the primary outcomes was ascertained by the Spearman correlation test. Variables demonstrated a significant correlation at P < .05 and were introduced into a univariate general linear model (employing the Gamma family with an inverse link). Model residuals were examined in the univariate and multivariate steps. Standardized parameters were obtained by fitting the model on a standardized version of the dataset. About 95% confidence intervals (CIs) and P-values were computed using a Wald t-distribution approximation.
Handling of Missing Data
In cases where we had less than 4 days of accelerometer recording, patients were asked to re-wear the accelerometers for an additional 7 days period.
Subgroup and Interaction Analyses
Due to the small sample size, we did not conduct any subgroup analyses or investigate potential confounding factors. This limitation should be considered when interpreting the findings of our study.
Comparison of Models With Experimental Data
The RMSE was computed, by taking the square root of the average of the squared differences between the simulated data and the real data, to evaluate the accuracy of model predictions. We employed the Bayesian Information Criteria (BIC), based on the sum of squared errors derived from the RMSE, the number of observations and the number of model parameters, to assess the model fit and quality.
Results
Simulation Results
The capacity and efficiency model simulation results highlighted a non-linear relationship between the expected use ratio and the resource ratio in both models (Figure 1). Notably, a ratio of 0 indicates that the paretic arm is used as much as the non-paretic arm.
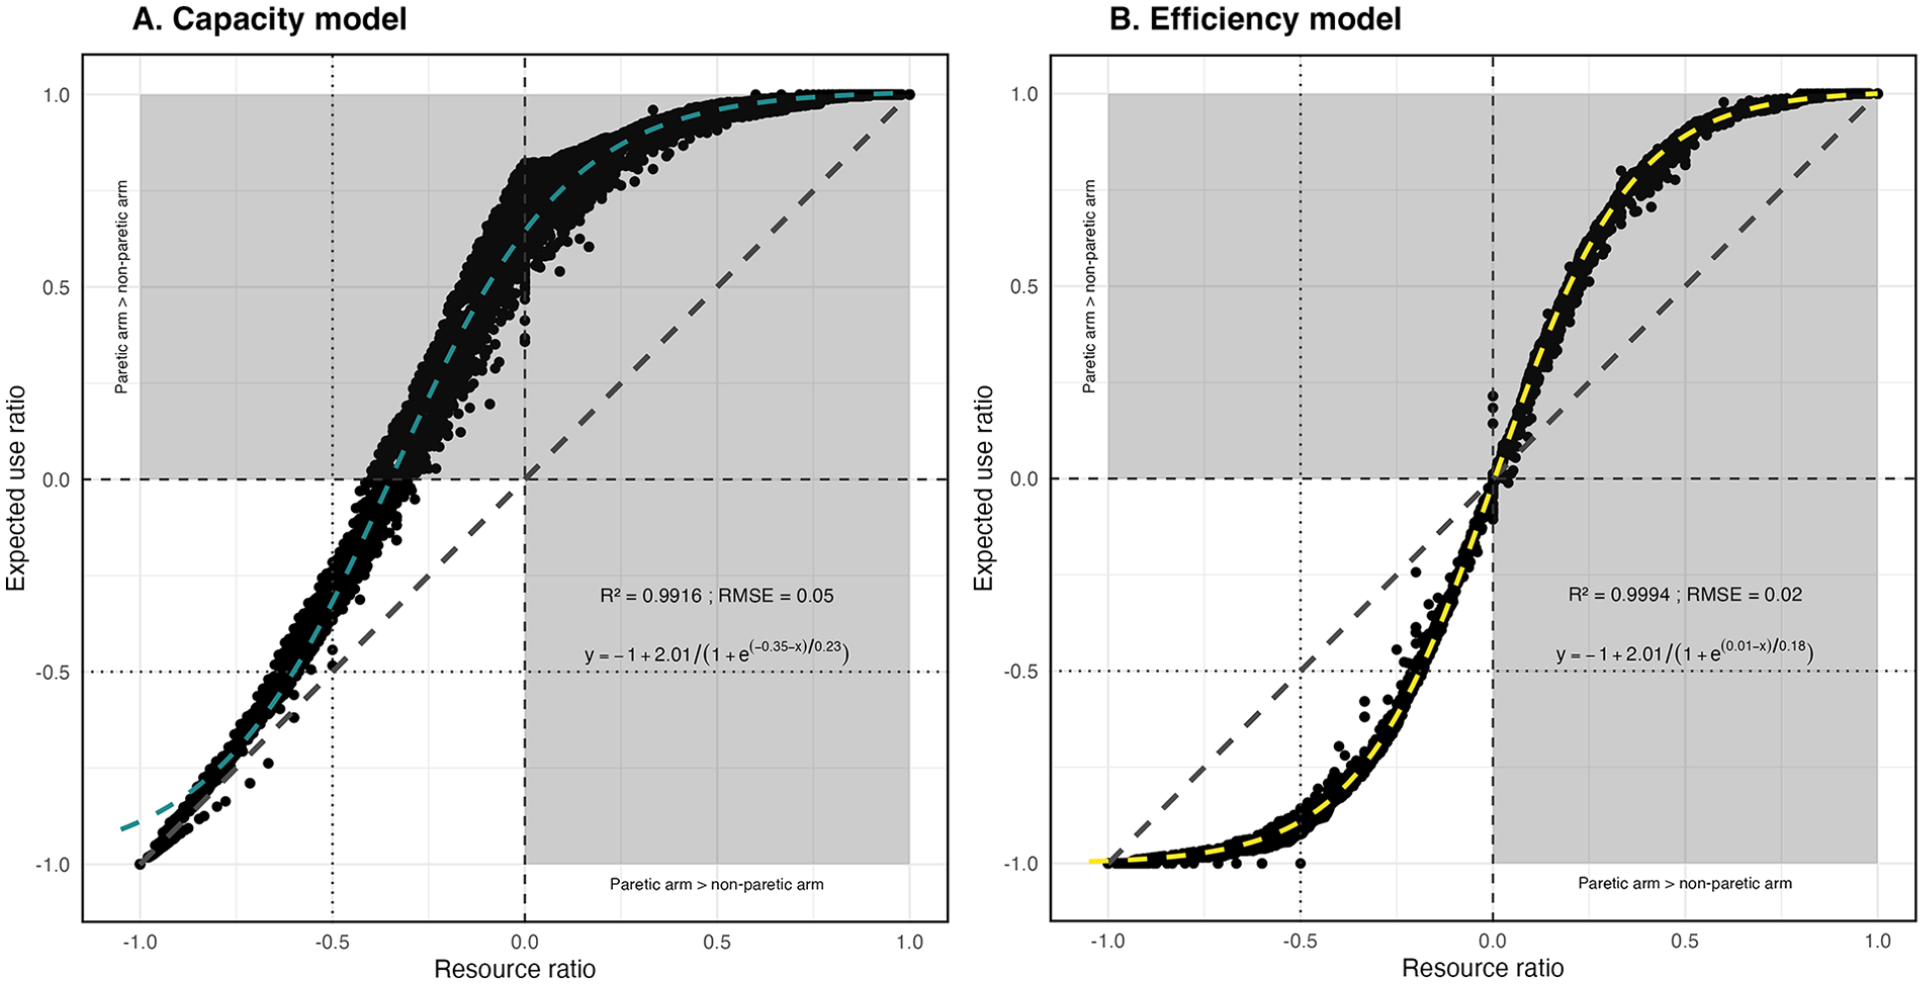
Scatterplot of the capacity (A) and efficiency (B) model simulations: The x-axis represents the resource ratio and the y-axis the expected use ratio. The ratios are normalized, so that a value of 0 indicates equality between the paretic arm and the non-paretic arm. Note that the figure represents all theoretical possibilities (from −1 to +1), but only the unshaded area at bottom left has any practical meaning, as the shaded area represents the region where the paretic arm performs better than the nonparetic arm.
The capacity model showed that an asymmetrical relationship. Here, priority is given to the paretic arm if it is able to perform the task. The associated equation for this relationship is:
Conversely, the efficiency model showed that a symmetrical relationship between the 2 variables was observed, meaning that the same behavior is used for both arms. The relationship mathematically captured by:
Clinical Results
Participant Description
Thirty participants aged 33 to 82 years, with mild arm motor impairment (FM-UE: 44.37 ± 15.42) after stroke were included. About 29 were right-handed before the stroke, 17 presented with left hemiparesis, and 13 with right hemiparesis. Detailed characteristics can be found in Table 1.
Demographics and Clinical Characteristics of 30 Chronic Stroke Participants.

Abbreviations: FM-UE, Fugl-Meyer Upper Extremity; WMFT, Wolf Motor Function Test; BBT, Box & Block Test.
The average FuncUseRatio (considering unilateral movements only) was −0.64 with a standard deviation of 0.23 (Figure 2). The FuncUseRatio of the individuals is available in the supplementary material (Supplemental Figure S1).
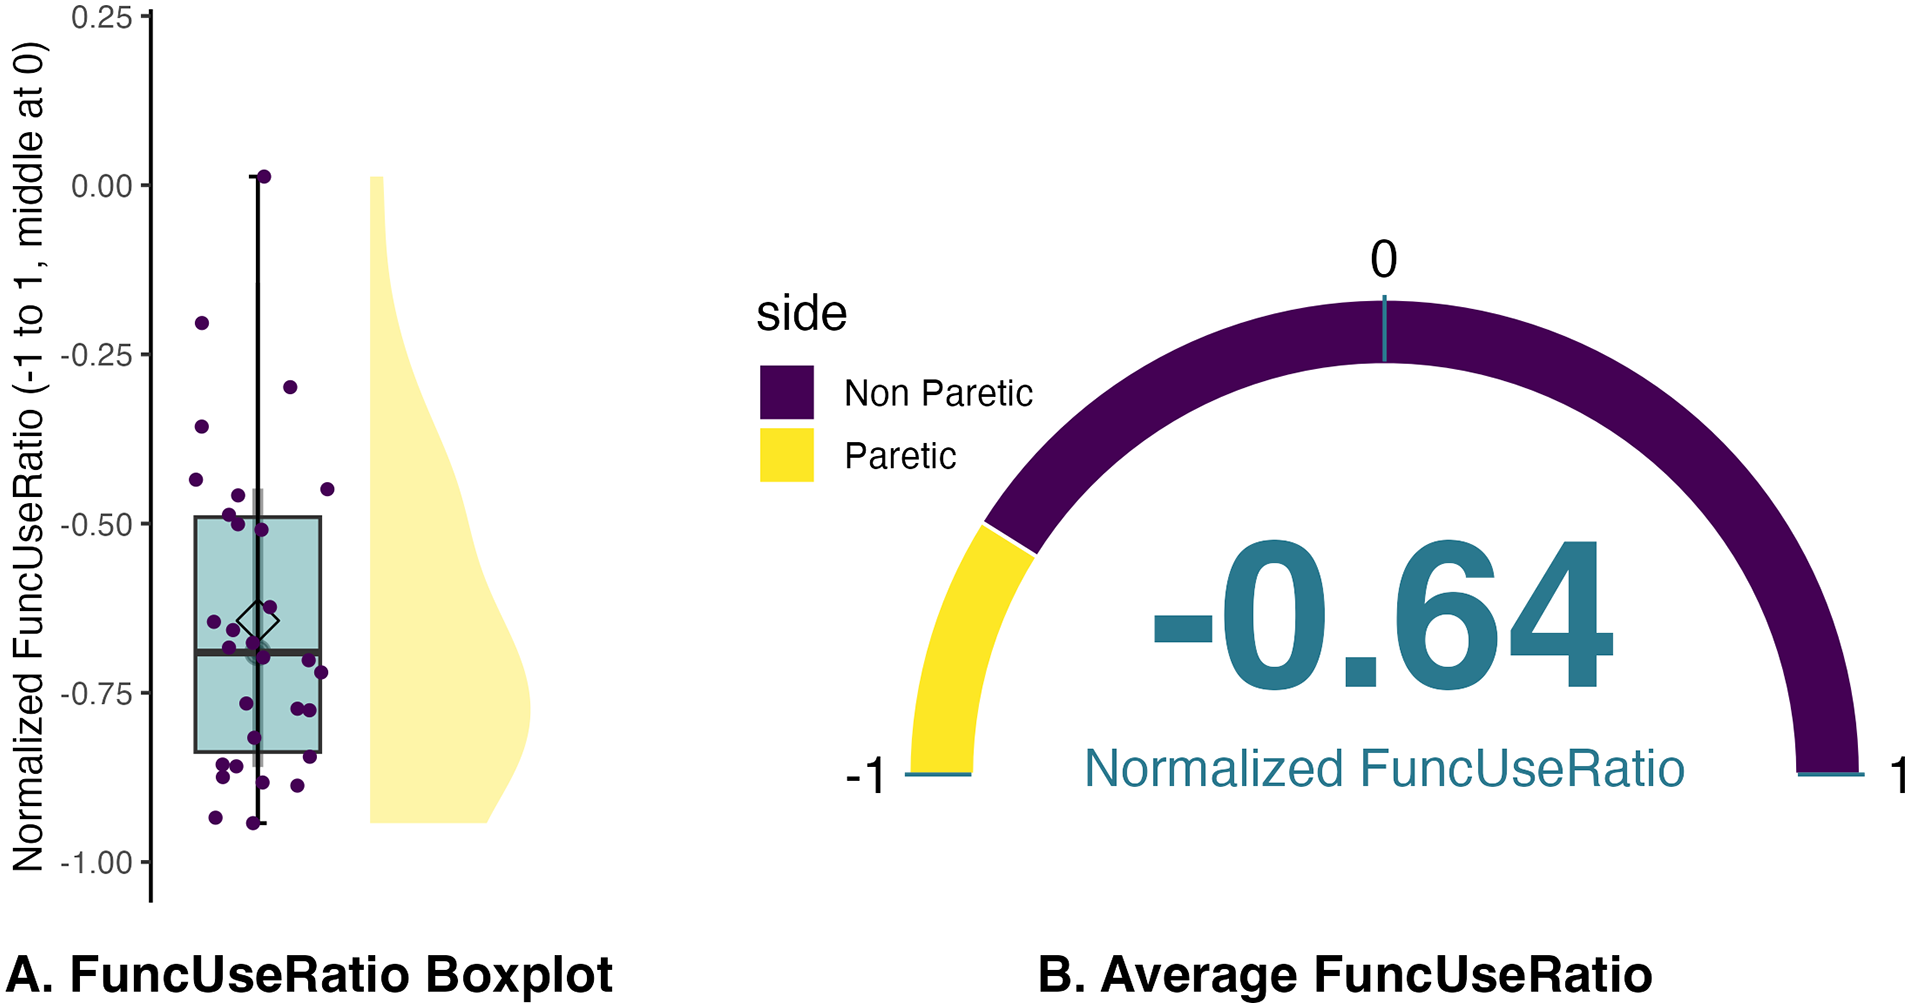
FuncUseRatio in 30 patients with chronic stroke. (A) illustrates the distribution of the values and (B) the average value only. A value of 0 signifies equal use of the paretic and non-paretic arms. Negative values correspond to the classical case of a reduced utilization of the paretic arm compared to the non-paretic arm.
Univariate Analysis
The independent variables correlated with the FuncUseRatio were the FM-UE ratio (ρ = .48, P < .01), the proximal FM-UE ratio (ρ = .53, P < .01), the distal FM-UE ratio (0.40, P < .05), the WMFT ratio (ρ = .60, P < .01), and the BBT ratio (ρ = .61, P < .01).
All coefficients in the univariate regression were significant except for the normalized Distal FM-UE ratio.
Multivariate Analysis
Employing multivariate stepwise regression with the Bayesian Information Criterion (BIC), only the BBT ratio was retained, Supplemental Table S1 outlines each step of the multivariate regression process. We fitted a general linear model (Gamma family with an inverse link) to explain normalized FuncUseRatio with normalized BBT ratio. The model’s explanatory power is substantial (Nagelkerke’s R2 = .39). The model’s intercept is at 1.61 (95% CI [0.98, 2.40], t(28) = 4.42, P < .001). Within this model, the effect of BBT is statistically significant and negative (β = −3.92, 95% CI [−6.22, −1.78], t(28) = −3.45, P < .001; standard β = −1.31, 95% CI [−2.08, −0.60])
Models and Clinical Data Comparison
We utilized the BBT ratio and the FuncUseRatio to characterize available resources and arm use based on empirical data. We then compared these ratios with the predicted unilateral arm use in ADLs, considering arm resource, as modeled in our study.
The BIC analysis revealed a pronounced superiority in model fit for the arm efficiency model over its arm capacity counterpart (BIC: −66.95 vs −5.89). Subsequently, the arm efficiency model exhibited a more precise alignment with empirical data within our sample, substantiated by a diminished RMSE (RMSE = 0.26 vs 0.72).
Finally, the arm efficiency model identified 13 participants exhibiting non-use, whereas the capacity model encompassed 26 participants within our study cohort. Further elucidation of these findings is available in Figure 3 for a graphical representation.
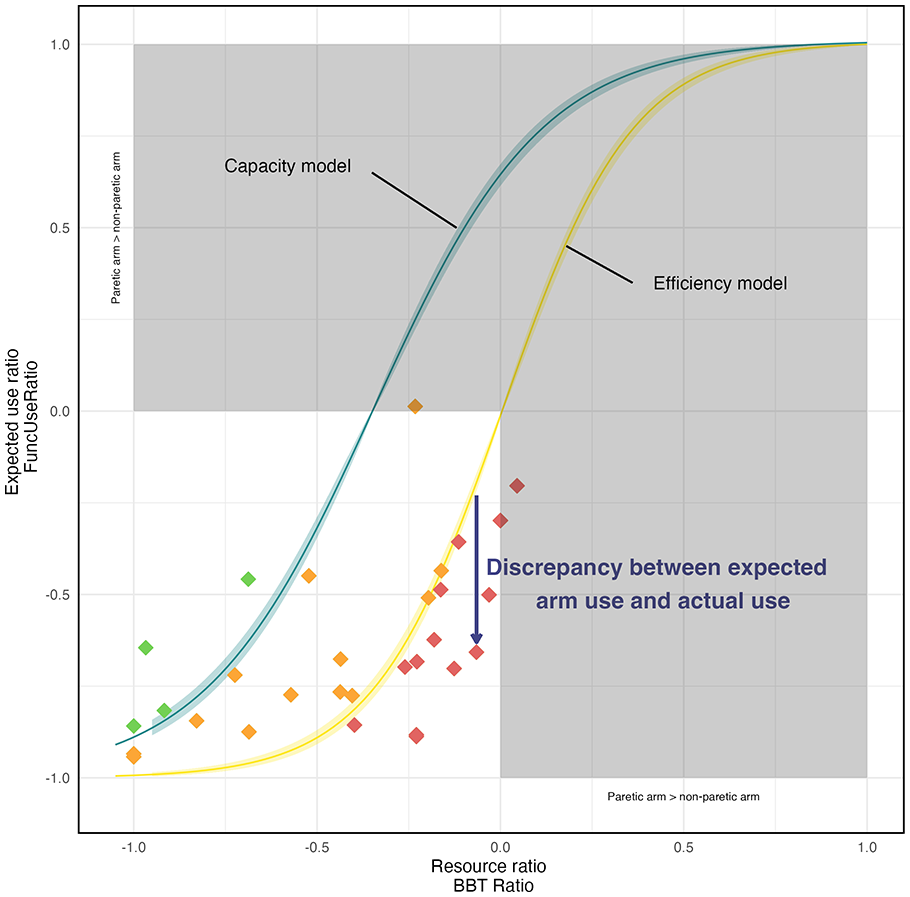
Models Predictions and Empirical Data. The x-axis represents the resource ratio (BBT ratio) and the y-axis the expected use ratio (FuncUse ratio) as in Figure 1. The predictions of the 2 models are represented by the continuous lines surrounded by 95% confidence intervals (capacity in blue, efficiency in yellow). The empirical data from 30 patients with chronic are represented by diamonds, which color highlights the categorization of patients: Red: patients with nonuse (they use their paretic arm less than predicted by the efficiency model) ; Orange: patients with expected nonuse (they use their paretic arm more than predicted by the efficiency model, but less than predicted by the capacity model) ; Green: patients with lower than expected non-use (they use their paretic arm more than predicted by the 2 models). This categorization can guide therapeutic decisions.
Discussion
This study aimed to compare the predictive performance of 2 numerical models based on arm capacity and arm efficiency for chronic stroke arm choice in individuals during ADLs, as measured by FuncUseRatio. Based on clinical and accelerometric data, the arm efficiency model demonstrated superior fit, as evidenced by a lower BIC (−66.95 vs −5.89) and reduced RMSE (0.26 vs 0.72) compared to the arm capacity model. These findings unequivocally support the superiority of arm efficiency model in accurately predicting arm use in ADLs. This raises an important question that may lead to reconsidering the definition of non-use, extending it beyond the simple discrepancy between arm capacity and spontaneous use in daily life. Indeed, our findings emphasize the need to evaluate not only the capacity of the paretic arm but also its efficiency relative to the non-paretic arm. This aligns with previous research demonstrating that arm choice is influenced by a comparison of “action values” associated with each arm, aiming to maximize success while minimizing costs such as effort.14,18,27
This issue impacts the prevalence of non-use derived from the 2 models. The prevalence of non-use derived from the arm capacity model (where non-use is considered as the discrepancy between capacity and use) was very high, with 26 participants, compared to the prevalence of non-use derived from the arm efficiency model (which considers the efficiency of the paretic arm), where only 13 participants were classified as non-users. This disparity in prevalence is tied to the expected arm use predicted by the 2 models. In the arm capacity model, the utilization of the paretic arm is deemed imperative whenever feasible, resulting in a significantly higher goal expectation for paretic arm use. Consequently, a considerable number of participants fall below this ambitious objective. In contrast, the arm efficiency model prescribes the engagement of the paretic arm only when its efficiency surpasses that of the non-paretic arm, leading to a more achievable goal expectation. If we consider that arm choice is optimal in healthy people18,28,29 as well as in people who have suffered a stroke,14,27 it is logical that arm efficiency should be the main driver of arm choice, if only because it underlines the importance of setting realistic goals. 30 For example, Cho et al 30 underscore that setting achievable objectives is crucial to maintaining patient motivation in the rehabilitation process.
As a result, we identified 3 distinct groups of patients (Figure 3). On the one hand, we have individuals who do better than predicted by the arm capacity model (green diamond) and who have a lower-than-expected rate of non-use. On the other hand, there are individuals who do better than predicted by the arm efficiency model (orange diamond) and who demonstrate a non-use rate lower than what is predicted by the arm efficiency model. Finally, there are those who do worse than predicted by arm efficiency (red diamond) and who have a higher-than-expected rate of non-use. We contend that this distinction is crucial for proposing personalized goals and rehabilitation methods for post-stroke patients. For the individuals who do better than predicted, rehabilitation intervention should be aimed at improving arm function, strength, coordination, velocity, and sensory-motor capacity. These interventions may include exercises based on repetitive and stimulating task-oriented activities, virtual reality, and targeted arm strengthening.31 -34 The goal is to enhance the efficiency of the paretic arm (compared with the non-paretic arm), so to increase the use of the paretic arm in ADLs. For the individuals who do worse than predicted, rehabilitation intervention should be aimed at increasing paretic arm use in ADLs. These interventions may include constraint-induced movement therapy,35 -37 sensory cueing,38,39 or bio-feedback therapy. 40 The goal is to increase the use of their paretic arm capacity.
A noteworthy finding of our study is the confirmation that the ratio of paretic to non-paretic arm performance on the BBT is a better predictor of the FuncUseRatio in ADLs 22 than commonly used clinical metrics such as FM-UE or WMFT.5,11 In fact, the BBT has an advantage in that it assesses the functional performance of the hand grasping function with the paretic and non-paretic arms, and probably better reflects the use of the arm in ADLs. Moreover, the BBT ratio provides a nuanced perspective on the efficiency of the paretic arm relative to the non-paretic arm. In our perspective, we consider it is essential to assess the capacity of the paretic arm compared with the non-paretic arm, as indicated by the BBT ratio. This is because, when both arms are capable of performing the same task, individuals are more inclined to use the arm that enables them to do so with minimal effort and sufficient precision (efficiency).
Finally, our empirical results of ADLs with the FuncUseRatio confirm that the paretic arm is objectively used less than the non-paretic arm, which is a well-known result.23,41 -43 A particularly important aspect here is the measure we used. First, the use of accelerometers in ADLs provides objective information about real-life arm use, 44 enriching clinical assessments, and is probably more consistent and accurate than the Motor Activity Log. 45 Second, the arm use measure chosen varies between −1 and 1, making it simpler and easier to understand. Crucially, it corresponds exactly to the possible range of use, that is, from “totally non-paretic” (−1) to “totally paretic” (+1), with “balanced” in the middle (0). Third, the arm use measure chosen gives similar results to other measures of arm choice.22,23
While our study yields valuable insights, it has some limitations.
First, the models lack consideration for bimanual arm movements, which means that we neglect at least 8% of ADLs according to our accelerometer data. Moreover, to enhance the predictive capacity of the models, it may be beneficial to incorporate additional parameters that interact with the non-use phenomenon. These parameters could include arm pain, self-efficacy,46,47 context, 48 attentional resources, 49 and potentially beliefs, fatigue, and mood. Additionally, we suggest exploring the concept of usability, 50 which combines effectiveness (linked to resources in our study), efficiency, and satisfaction (related to subjective factors mentioned above), would offer a more holistic perspective on post-stroke arm choice. The model presented in this paper should not be considered solely as an efficiency model, with its limitations. Instead, it aligns with the idea that humans likely adhere a model derived from a cost function. This function takes into account multiple factors such as efficiency and the other factors mentioned above, 51 even though there is still no consensus on the exact factors or the existence of a cost function. 52
Second, although the sensor-based approach used has shown that it can exclude non-functional arm swing movements during walking 22 and can effectively differentiate between healthy subjects and stroke patients based on 7-day home recordings, 23 no published study has yet validated this method against real-world conditions. While we currently have 2 studies underway, one of which is registered under NCT06509542, both showing promising preliminary results, we recommend interpreting our findings with caution.
Third, our participants exhibited mild arm motor impairment according to FM-UE scores. However, their performance during the BBT revealed that, on average, they could move only half of the cubes with the paretic arm compared to the non-paretic arm. Future investigations with individuals having higher capacity ratios could offer valuable comparative insights.
Fourth, we used the BBT ratio as our results demonstrated it to be the most reliable predictor of FuncUseRatio among the clinical tests examined. However, we observed cases where patients, despite not having moved any cubes during the BBT, still used their paretic arm to some extent in daily activities. This suggests that some daily activities are achievable even without a functional grasping, such as stabilizing an object while the other hand performs the action, an aspect not emphasized by the BBT. Additional assessments may be needed to complement and capture this aspect more comprehensively.
Fifth, we observed instances where patients, despite having a normalized BBT ratio close to 0 (indicating that both arms have the same resources), did not use their paretic arm as much as the non-paretic arm in ADLs, as highlighted by a FuncUseRatio below the arm efficiency model. It is essential to note that the BBT does not assess fine manual dexterity. Enhancements to arm capacity measurement could involve supplementary assessments, such as the 9 Hole Peg Test for fine dexterity. 53
Finally, we conducted our study on a limited sample, without knowing their non-use status regarding arm choice, as assessed by a validated tool like the Bilateral Arm Reaching Test. We are considering this approach for a future validation study.
Conclusion
The present study aimed to determine if paretic arm use after stroke is best predicted by its capacity or its efficiency. The study found that a model based on comparing the efficiency of each arm is better than one based on the capacity of the paretic arm. We also suggested that the arm efficiency model could help therapists propose more personalized rehabilitation goals and therapy either for improved paretic arm efficiency or to decrease paretic non-use in ADLs. Further studies are needed to better understand the relationship between paretic arm use and efficiency, and to better model the phenomenon of non-use using a more holistic approach to the individual.
Supplemental Material
sj-docx-1-nnr-10.1177_15459683241303691 – Supplemental material for Beyond Arm Capacity in Chronic Stroke: Evaluating Paretic Arm Non-Use Through Arm Efficiency—A Cross-Sectional Study
Supplemental material, sj-docx-1-nnr-10.1177_15459683241303691 for Beyond Arm Capacity in Chronic Stroke: Evaluating Paretic Arm Non-Use Through Arm Efficiency—A Cross-Sectional Study by Gaël Le Perf, Germain Faity, Denis Mottet, Makii Muthalib, Isabelle Laffont and Karima Bakhti in Neurorehabilitation and Neural Repair
Footnotes
Acknowledgements
The authors would like to thank Guillaume Thébault for his advice and proofreading, and Valérie Driss from the Clinical Research and Epidemiology department for the management of the accelerometers. When preparing this manuscript, the authors used “DeepL” and “GPT3.5” to minimize errors in English wording. The authors have reviewed and corrected all suggested wording. The authors assume full responsibility for the content of the publication.
Author Contributions
Gaël Le Perf: Conceptualization; Formal analysis; Methodology; Visualization; Writing—original draft; Writing—review & editing. Germain Faity: Conceptualization; Formal analysis; Methodology; Resources; Validation; Visualization; Writing—review & editing. Denis Mottet: Conceptualization; Supervision; Validation; Writing—review & editing. Makii Muthalib: Investigation; Writing—review & editing. Isabelle Laffont: Conceptualization; Supervision; Validation. Karima Bakhti: Conceptualization; Data collection; Data curation; Funding acquisition; Investigation; Project administration; Resources; Supervision; Validation; Writing—review & editing.
Declaration of Conflicting Interests
The author(s) declared no potential conflicts of interest with respect to the research, authorship, and/or publication of this article.
Funding
The author(s) disclosed receipt of the following financial support for the research, authorship, and/or publication of this article: The clinical trial was funded by the Direction générale de l’offre de soins (DGOS) of the French Ministère des Affaires Sociales et de la Santé (Programme hospitalier de recherche infirmière et paramédicale-PHRIP-2018-0731), with additional support from LabEx NUMEV (ANR-10-LABX-0020) within the I-Site MUSE (ANR-16-IDEX-0006).
Trial Registration
This study was conducted as part of the ReArm clinical trial (ID-RCB 2019-A00506-51) following ethical approval by the French Committee for the Protection of Individuals (CPP SUD-EST II). The ReArm project is registered on ClinicalTrials.gov (NCT04291573).
Supplementary material for this article is available on the Neurorehabilitation & Neural Repair website along with the online version of this article.
References
Supplementary Material
Please find the following supplemental material available below.
For Open Access articles published under a Creative Commons License, all supplemental material carries the same license as the article it is associated with.
For non-Open Access articles published, all supplemental material carries a non-exclusive license, and permission requests for re-use of supplemental material or any part of supplemental material shall be sent directly to the copyright owner as specified in the copyright notice associated with the article.