
Abstract
Background. Robot-aided neurorehabilitation can provide intensive, repetitious training to improve upper-limb function after stroke. To be more effective, motor therapy ought to be progressive and continuously challenge the patient’s ability. Current robotic systems have limited customization capability and require a physiotherapist to assess progress and adapt therapy accordingly. Objective. The authors aimed to track motor improvement during robot-assistive training and test a tool to more automatically adjust training. Methods. A total of 18 participants with chronic stroke were trained using a multicomponent reaching task assisted by a shoulder–elbow robotic assist. The time course of motor gains was assessed for each subtask of the practiced exercise. A statistical algorithm was then tested on simulated data to validate its ability to track improvement and subsequently applied to the recorded data to determine its performance compared with a therapist. Results. Patients’ recovery of motor function exhibited a time course dependent on the particular component of the executed task, suggesting that differential training on a subtask level is needed to continuously challenge the neuromuscular system and boost recovery. The proposed algorithm was tested on simulated data and was proven to track overall patient’s progress during rehabilitation. Conclusions. Tuning of the training program at the subtask level may accelerate the process of motor relearning. The algorithm proposed to adjust task difficulty opens new possibilities to automatically customize robotic-assistive training.
Introduction
Functional impairment of the upper extremity is one of the major challenges that those who have had a stroke face in relearning everyday activities.1,2 The rehabilitation of poststroke patients usually relies on task-oriented repetitive movements that help improve motor function, train new motor strategies, and prevent secondary complications. 3
Motor control and learning studies are improving our understanding of the basic mechanisms underlying poststroke recovery,4-7 and researchers have identified rehabilitation strategies that might facilitate these mechanisms, such as constraint-induced movement therapy, 8 bilateral arm training,9,10 and robot-aided motor rehabilitation.11-13
Robot-aided motor training exploits the fact that performance improvement depends on the amount of practice. 14 It can provide an intensive and highly repeatable administration of therapy and may be effective in improving upper-limb function, although success to date in randomized trials that compare the intervention with an equal amount of training have revealed equivalency.15,16 These improvements likely result from use-dependent reorganization of the cortical circuitry triggered by the increased use of body parts in behaviorally relevant tasks. 17
To be effective, however, motor therapy needs to be varied to continuously challenge the patient’s neuromuscular system throughout the rehabilitation program. Training may consist of different “components” (ie, tasks or subtasks), and to design optimized programs, they must be identified and their influence on treatment effects known, so that they can be profitably used by therapists. 18 Motor function should also be continuously tracked. Currently, scores of clinical measures, such as Fugl-Meyer, are merely evaluated pretreatment and posttreatment because they are time-consuming to apply. In contrast, robotic measures can provide patients and therapists with immediate feedback about progress on the practiced task. 19 A number of robotic measures have been proposed, such as movement smoothness, percentage of activity achieved without robotic assistance, amount of applied force, and error values between actual and desired trajectories.20-24 One major issue that remains to be addressed, however, is how to integrate all these measurements into a single meaningful tool to monitor the patient’s progress during rehabilitation.
Algorithms for fast and automatic outcome evaluation are highly desirable because they are important for tracking improvement of the patient’s motor function at every session and for (semi-) automatic adaptation of therapy based on patient progress.25-29 In spite of these considerations, current robotic solutions suffer from limited customization capability, or when it is supplied, a dedicated physiotherapist is needed to track the patient’s progress and to adapt therapy accordingly.
The aims of this study were to learn whether the time course of motor gains with the robotic device was dependent on the practiced subtasks and to develop an algorithm able to track improvement at the task and subtask levels. Our goal is to open new ways to customize training.
Methods
Participants
A total of 18 patients with chronic stroke (6 women) were included. Average time since onset was 22 months. Inclusion criteria were the presence of a single unilateral stroke and of at least 10° of motion in the treated joints (shoulder and elbow). Those with severe sensory and visual field impairment and aphasia were excluded. Of the participants, 10 had left- and 8 had right-arm paresis. All patients gave their informed consent to the study, which had been previously approved by the local scientific and ethics committees.
Procedures
The elbow–shoulder manipulator system MEMOS was used in this study.21,30 Patients were seated on a chair with their trunk fastened to limit compensation phenomena. “Beginning” and “end” points were presented on a monitor situated above the workspace. Patients had to make a sequence of point-to-point reaching movements in the horizontal plane; they were instructed to move the handle from the starting point to the target. The path to follow was a square path (SP; 4 reaching subtasks). In case of significant motor improvement, the physiotherapist could decide to train a patient on a more complex diamond-shaped path (DP; see Figure 1). Visual feedback of the current handle position was provided by means of a different colored target. When the patient completed the movement by means of only voluntary activity, the trial was evaluated as a success. If during the task the patient was unable to move the handle for a time period longer than 3 s (failure), the robot guided the patient’s arm to the target position along the minimum path trajectory. Patients were trained twice a day, 5 days a week for at least 3 weeks. On the same days, all patients underwent physical therapy performed by professionals for 45 minutes.
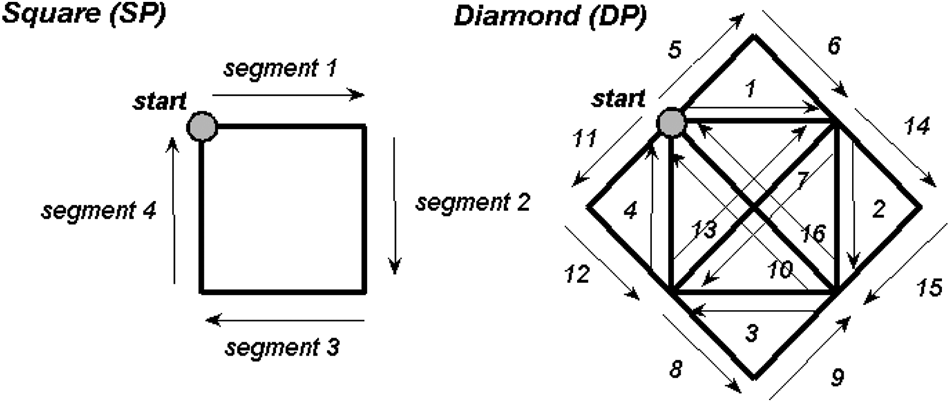
Point-to-point reaching tasks: all the patients had to make a sequence of point-to-point reaching movements in the horizontal plane; they were instructed to move the robot handle from the starting point to the end point. The path to follow was initially a square (4 reaching subtasks, left panels). In case of significant motor improvement, the physiotherapist could decide to train a patient on a more complex diamond-shaped path (16 reaching subtasks, right panels). Patients suffering from a left-arm paresis were trained to execute a series of point-to-point reaching movements that were specular to those executed by patients with right-arm paresis.
Performance Measures
Performance was described by 1 discrete variable, %Succ, the percentage of successful tasks executed during each session, and 3 continuous variables: (1) MV, the mean tangential velocity of the handle; (2) nMD, the mean absolute value of the distance between the actual trajectory and the straight line connecting the starting position with the target 21 (theoretical path), normalized on the length of the theoretical path; (3) nPK, the number of peaks in the speed profile (expressed as a negative value), a well-known parameter quantifying movement smoothness. 20 All these variables were computed from the Cartesian coordinates of the end-effector trajectory. 24
Time Course of Recovery
Patients suffering from a right-arm paresis were trained to execute a series of point-to-point reaching movements that were specular to those executed by patients with left-arm paresis. Therefore, segments denoted by the same numerical code (Figure 1) could be pooled together for data analysis, independently from the trained arm.
Motor improvement was analyzed separately on different segments of the executed path. The analysis is focused on SP because it was executed by all 18 patients. Also, 8 of the patients were additionally trained on DP because their performances on SP reached a plateau after 13 ± 5 sessions, according to the therapist’s assessment of all the performance measures previously described. Additional analyses were conducted on these patients to investigate generalization of motor recovery. In particular, the performances achieved during both the first and last training sessions on DP were compared among different segments. To this end, the segments of DP were classified into the following domains:
within (segments 1, 2, 3, 4, 7, 10, 13, and 16) and outside the trained workspace (segments 5, 6, 8, 9, 11, 12, 14, and 15);
proximal, that is, directed toward the body (segments 2, 6, 7, 8, 11, 12, 14, and 15), and distal, that is, directed away from the body (segments 4, 5, 9, 10, 13, and 16); and
dominant, when directed toward the nonaffected side (segments 3, 7, 10, 11, 15, and 16), and nondominant (segments 1, 5, 6, 8, 9, 12, 13, and 14).
Motor recovery was also analyzed with respect to the primary directions of movement. In all, 8 different directions of movement were identified in DP: E (segment 1), NE (segments 5 and 9), N (segment 4), NW (segments 10, 13, and 16), W (segment 3), SW (segments 7, 11, and 15), S (segment 2), SE (segment 6, 8, 12, and 14).
A state-space model was used to track motor improvement during training. It consisted of a state equation, governing the dynamics of the unobservable motor improvement variable, and a set of observation equations, describing how the selected performance measures relate to motor improvement. Such an approach was previously used to characterize associative learning in animal studies.31,32 However, if opportunely modified, it can also be applied to describe motor improvement during neurorehabilitation training.
Briefly, the state equation, or the unobservable motor improvement, was defined as a random walk:

where k = 1,. . ., K are the training sessions, and εk are independent Gaussian random variables with mean 0 and variance σ2ε. The number of successful tasks executed during session k, Succ k , was described by a Binomial model:
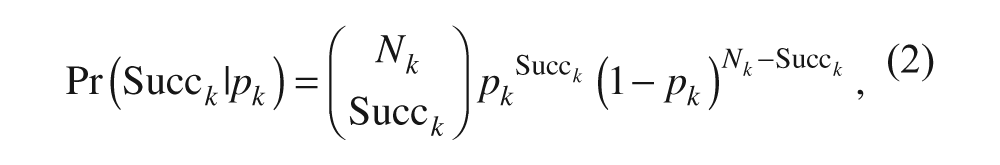
where Nk is the number of task repetitions during session k, and p k is the probability of a successful task during session k.
Three additional observation equations for the continuous variables, MV, nMD, and nPK can be defined by a log-linear probability model.24,33 Labeling these variables r(j) (j = 1, 2, 3), we have

where the δ
k
are independent zero mean Gaussian random variables with variance
A virtual rehabilitation training was simulated to test the proposed state-space model. It consisted of k = 40 sessions of N = 20 repetitions of a reaching task. Different simulations were executed to test whether the model was able to track observation variables having different dynamics. During each simulation, 1 of the 4 observation variables slowly varied compared with the others, and the capability of the model—based on a single state variable x—to capture the mixed dynamics was evaluated. Details about the state-space model, the model computation, and the validation procedure are reported in the Appendix.
Data Analysis
Statistical analysis to assess differences in the time course of motor recovery on different segments were performed with repeated measures 2-way ANOVA. Post hoc analyses were performed by means of Tukey HSD (honestly significant difference). To investigate generalization of motor recovery, the Kolmogorov-Smirnov test was used to compare performances on different segments in the subgroup of patients who practiced the DP. The 1-tailed Student paired t test was used to compare the training session at which the physiotherapists changed the difficulty level of the task and that proposed by the algorithm. The level of probability selected as statistically significant was P < .05. Statistical analyses were performed using Statistica 10 (StatSoft Inc, Tulsa, Oklahoma).
Results
Motor Improvement
Figure 2 shows the mean time course of recovery (averaged over the 18 participants) of the robot-measured variables for each segment of SP (see Methods section and Figure 1). Movement kinematics improved along each segment during the course of treatment. MV during the last day of treatment increased significantly with respect to the first day (F1,35 = 126.68; P < .001). The same was true for nPK (F1,35 = 9.64; P = .004) and %Succ (F1,35 = 50.35; P < .001), whereas nMD significantly decreased (F1,35 = 25.33; P < .001). Curves for different segments were significantly different for MV (F3,51 = 8.25; P < .001), nMD (F3,51 = 7.97; P < .001), and %Succ (F3,51 = 6.35; P = .001), whereas they were not for nPK (F3,51 = 2.02; P = .12). Post hoc analyses revealed that the time course of MV for segment 3 was significantly different from those for both segments 1 (Tukey HSD, P = .001) and 4 (P < .001) but not for segment 2 (P = .09). Analogously, the time course of nMD for segment 1 was significantly different from those for both segments 2 (P = .002) and 3 (P < .001) but not for segment 4 (P = .22). For %Succ, both segments 2 and 3 were significantly different from segments 1 and 4 (P < .02 for all the pairwise comparisons).
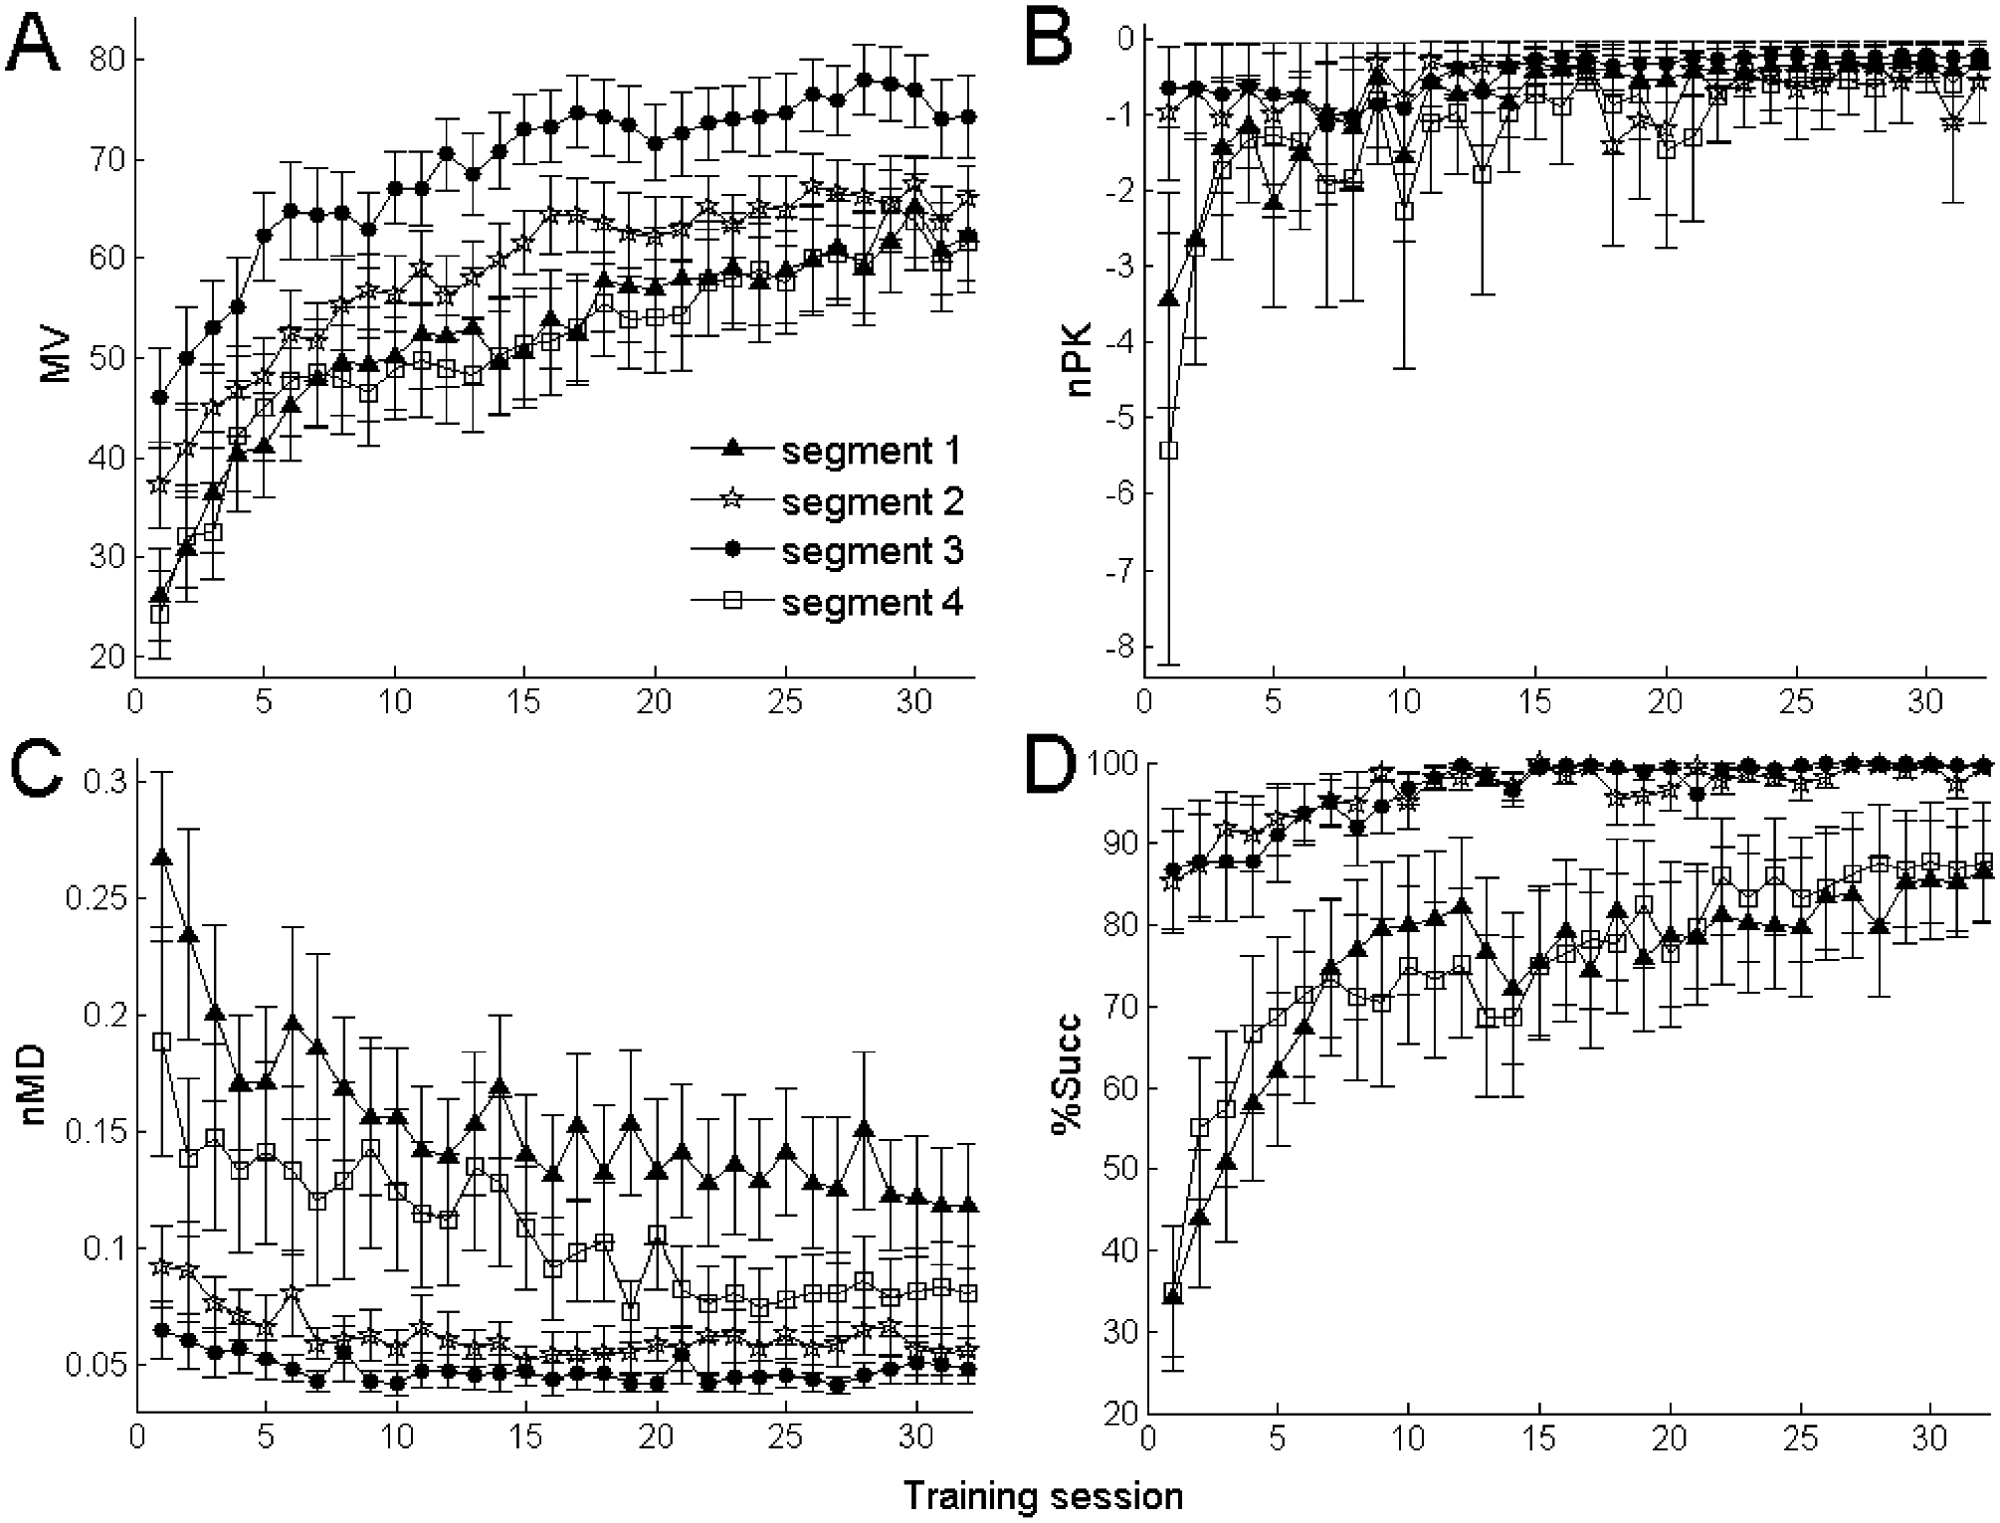
Average time course of recovery of the robot-measured variables: average curves (±SEM) for the kinematic variables MV, nMD, and nPK and for the task completion–related variable %Succ. On average, segments 2 and 3 of the square path show similar features—that is, they start from initially good values (indicating participant’s good performance) and improve slowly. In contrast, segments 1 and 4 improve quickly after a worse initial performance.
Figure 3 shows the time course of the robotic variables along each segment of both SP and DP, averaged over the 8 participants who performed both. Left panels show point-to-point movements performed on DP within (black) and outside (gray) the training workspace; middle panels show proximal (black) and distal (gray) movements, whereas the right panels show dominant (gray) and nondominant (black) segments. %Succ was not significantly different (P > .05) among these groups, both at the beginning and at the end of the training on DP. In contrast, MV, nMD, and nPK were significantly different between movements within and outside the training workspace at the beginning of DP training. It is interesting to note that their difference was preserved even at the end of DP. A small but not significant difference was revealed between proximal and distal movements. Finally, nPK at the beginning of DP was significantly different (P < .01) between dominant and nondominant movements. In particular, movements toward the nonaffected side were smoother. However, this difference vanished at the end of DP training.
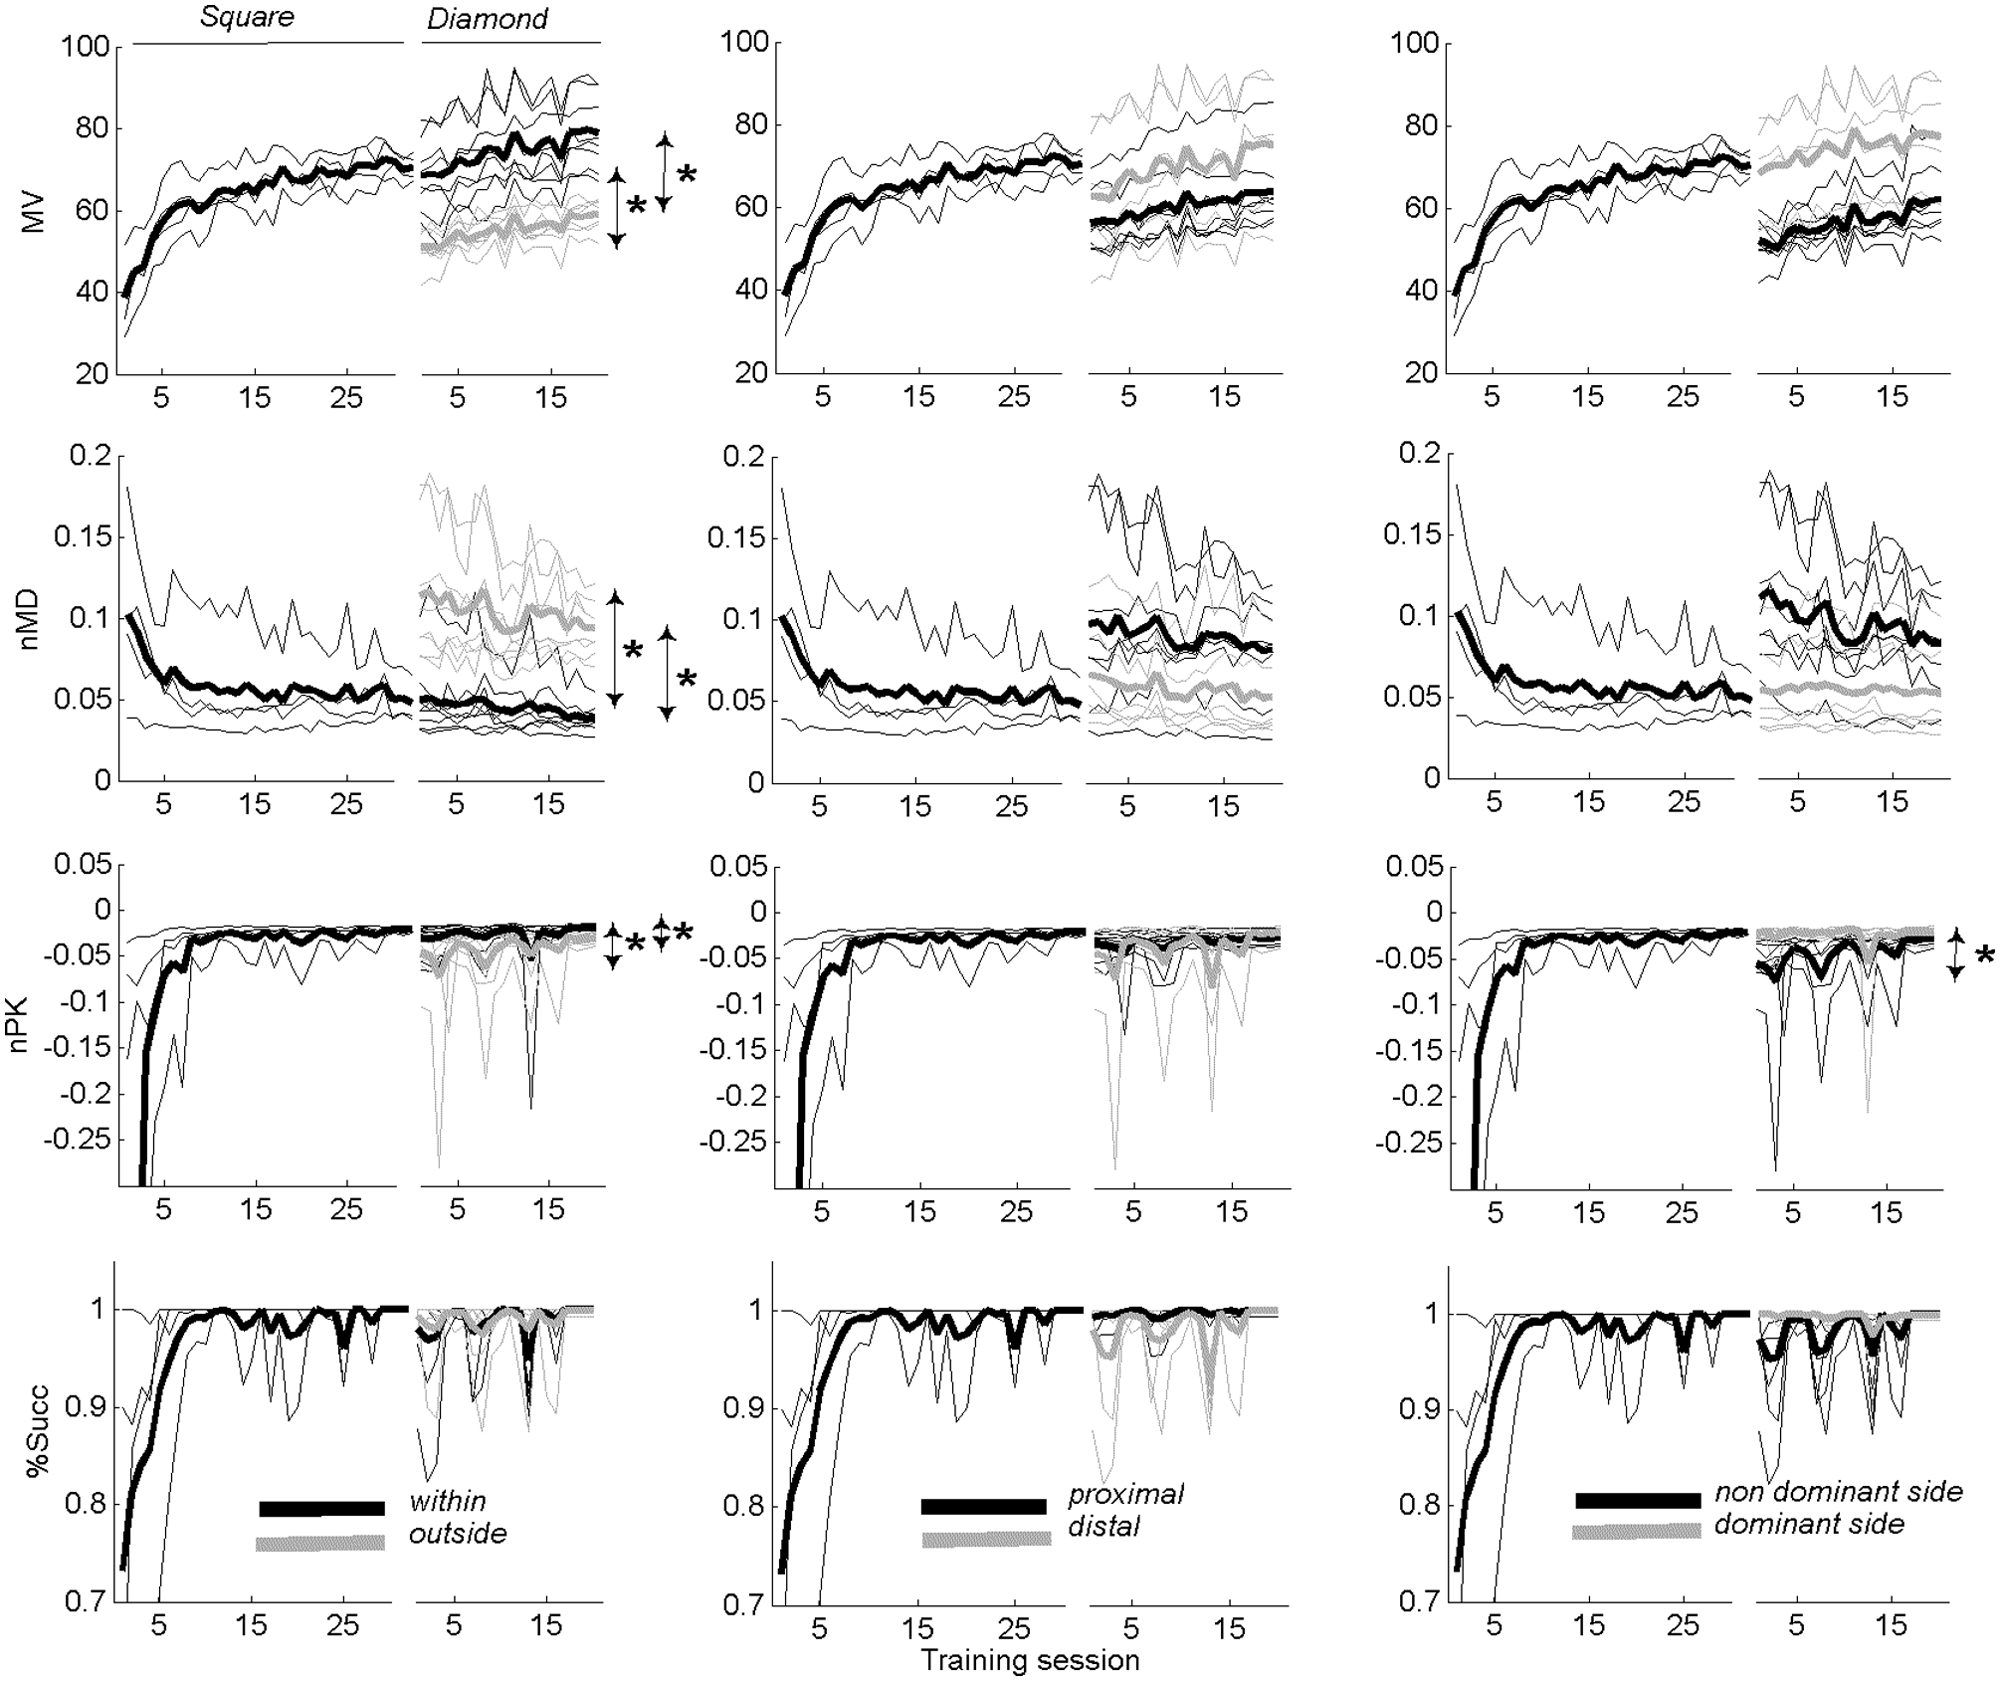
Average time course of recovery measured by the robotic variables along each training segment: in each subplot, the curves corresponding to both the square and the diamond have been shown. Left panels show the point-to-point movements divided, for the diamond, into within (black) and outside (gray) the training workspace; center panels show proximal (toward the body) and distal (away from the body) movements; the right panels show the dominant side (toward the participant’s nonaffected limb) and nondominant side.
Figure 4 shows the motor improvement obtained with respect to the 8 primary directions of movement for both SP and DP: MV improved in all the directions of SP, whereas the greater improvement for DP was in the NW direction; nMD was reduced mainly in the E and N directions of SP and in the E and NE of DP; nPK improved in the E and N directions of SP but not in the others, where it exhibited optimal values since the beginning of the training; %Succ improved in the E and N directions of SP and in the NE direction of DP.
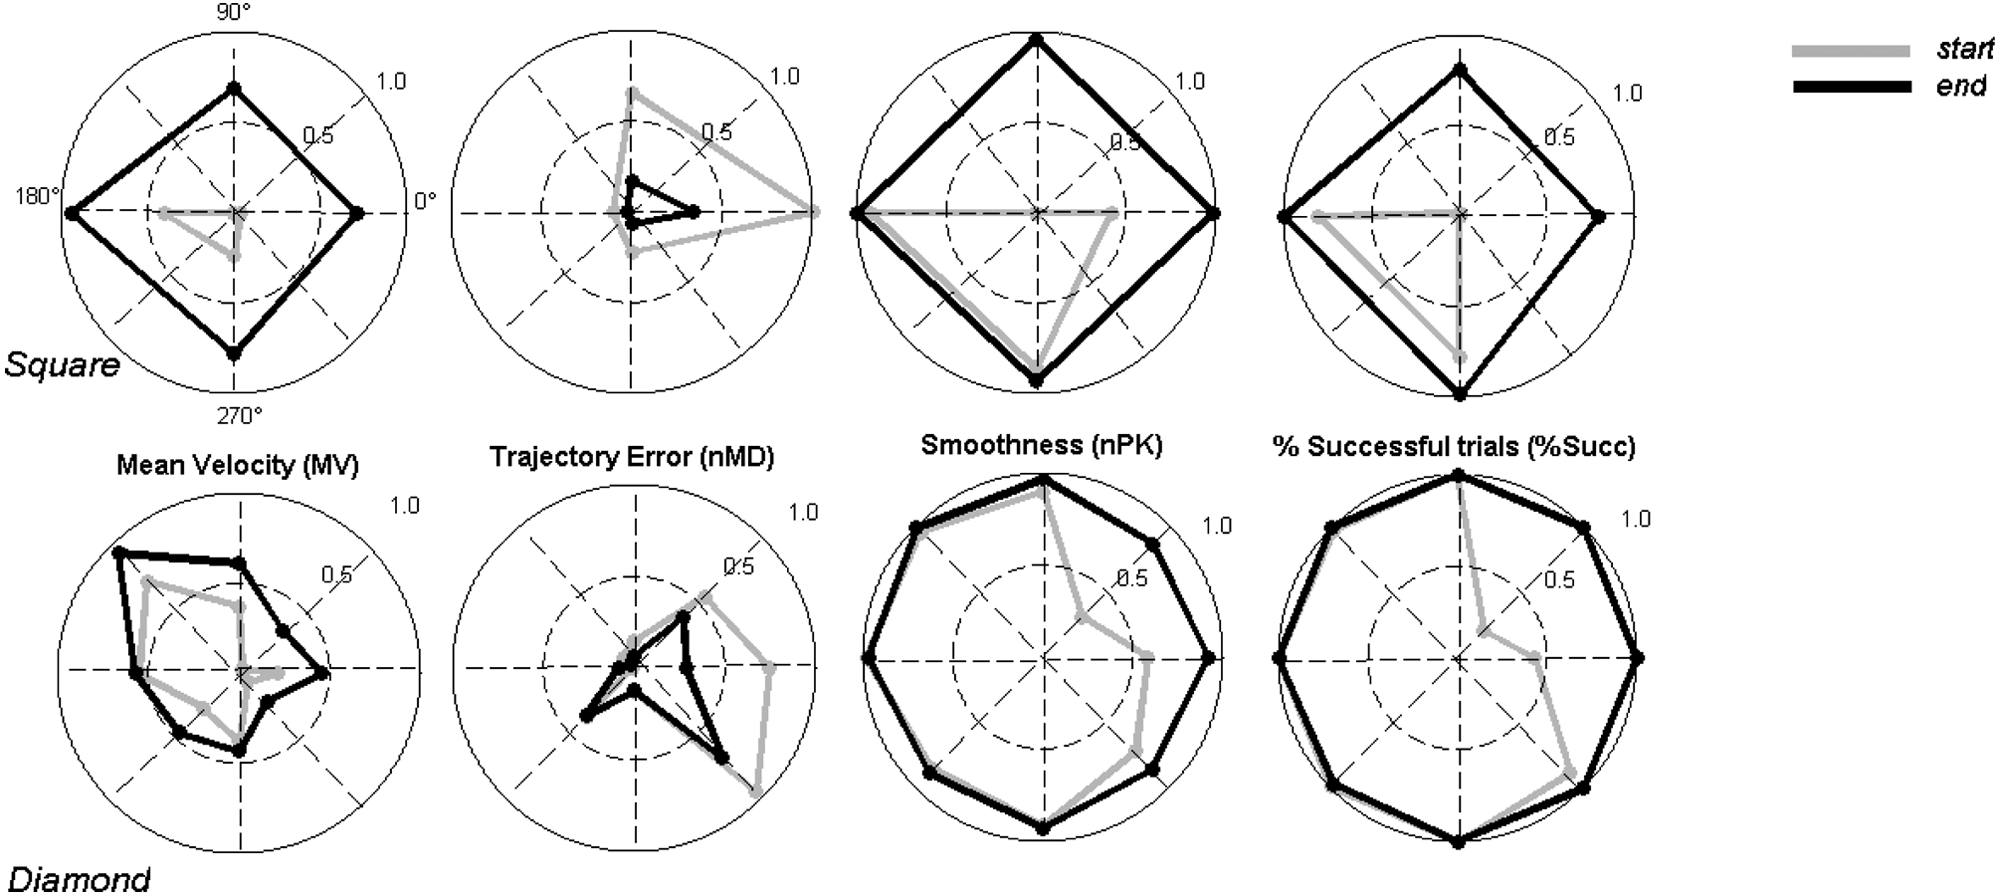
Changes of motor recovery with respect to the primary directions of movement in the practiced workspace. Each plot represents the values at the start and at the end of treatment for each parameter and direction in the workspace. The changes in the parameters are normalized between the minimum (the circle center) and the maximum (the unit circle) values. The gray and black lines connecting points on the directions of movement allow us to obtain a geometrical representation of the workspace exploration abilities of the patients.
Tracking Motor Improvement
Validation of the statistical tool
The proposed model (Equations 1-3) was able to capture the dynamics of all the observation variables because (1) the 95% confidence interval of the time constant of each estimated observed variable (Figure 5, black curves) included the value selected for the simulation and (2) the median value of the squared Pearson correlation coefficient, R2, between the observed variables and the estimated observation variables was 0.78 (range = 0.55-0.97). Moreover, the motor improvement curve smoothly varied (
We then investigated whether such a tool would have mimicked the decision rules applied by our physiotherapists during the rehabilitation training of the 18 poststroke participants. The physiotherapists monitored MV, nMD, nPK, and %Succ, and decided to increase task difficulty when the participant’s performance, at task level, was recovered to some degree. Such sessions were denoted as Sessionphys(j), j = 1,2,…,18.
To mimic physiotherapists’ decision rules, the algorithm (1) estimated the session, Sessionthres(i, j), during which motor improvement crossed a fixed threshold, and remained above it thereafter, for each subject j and each subtask i; (2) computed the mean, Sessionthres(j), of the crossing sessions, Sessionthres(i, j) over the different subtasks; if no crossing session existed for some i, Sessionthres(j) was set to the last trained session; (3) looped (1) and (2) over a range of possible threshold values, r = [0.5-5.5], and computed the squared Pearson correlation coefficient between Sessionthres(j) and Sessionphys(j).
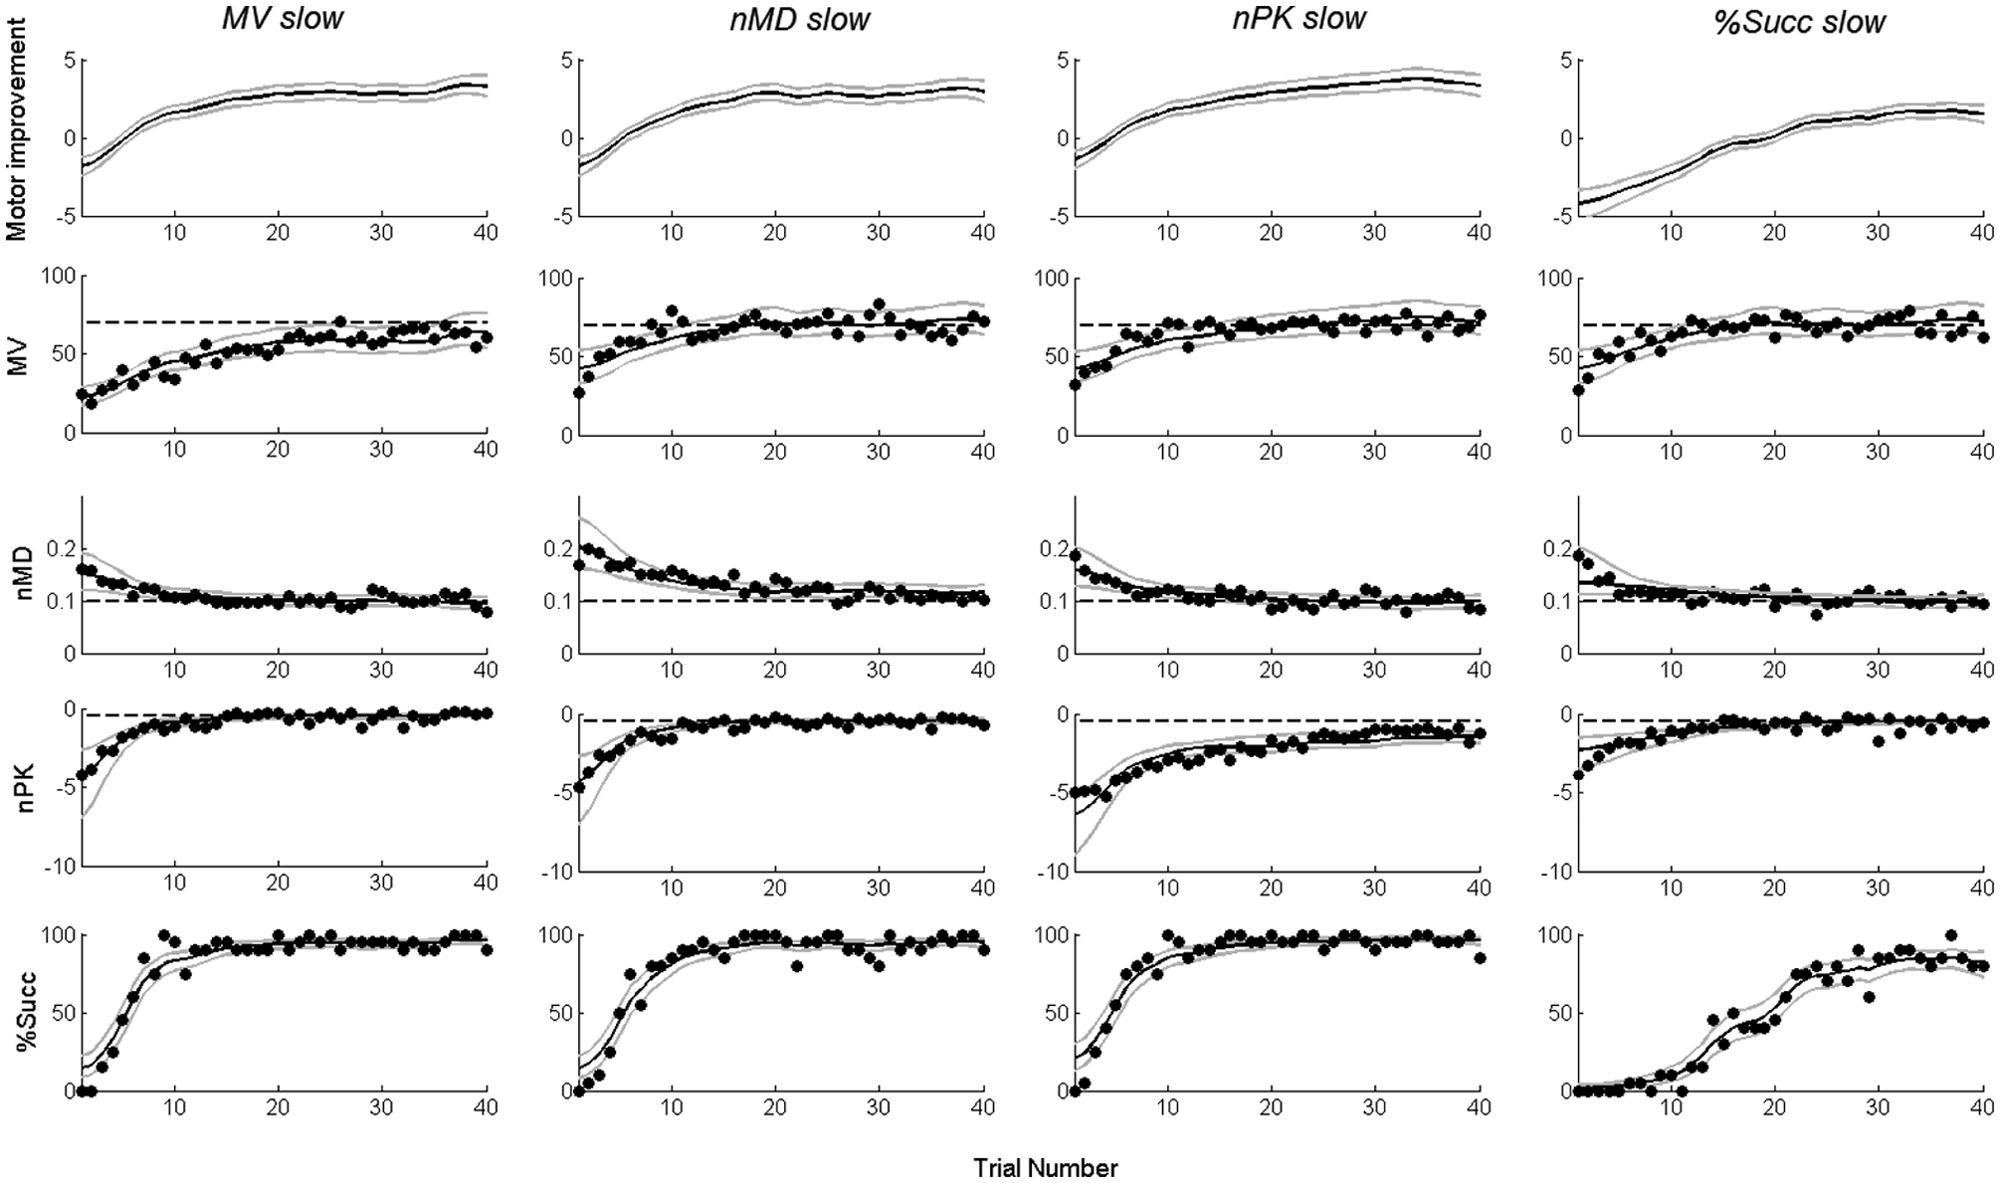
Results of a simulated rehabilitation training: top, motor improvement curves (black) and 95% confidence bounds (gray) computed using the proposed model (Equations 1-3); bottom, simulated data for the observation variables (empty circles) are shown with superimposed estimated mean curves (black) and confidence bounds (gray) computed using the motor improvement variable (see Equation 3). The values assumed by the time constants in Equations (A3) and (A4)—see Appendix A—for the 4 simulations were as follows: (1) τMV = 15 sessions and τnMD, τnPK, and τx = 4 sessions; (2) τnMD = 15 sessions and τMV, τnPK, and τx = 4 sessions; (3) τnPK = 15 sessions and τMV, τnMD, and τx = 4 sessions; and (4) τx = 15 sessions and τMV, τnMD, and τnPK = 4 sessions. Abbreviations: MV, mean tangential velocity; MD, mean absolute value of the distance between the actual trajectory and the straight line connecting the starting position with the target; nPK, number of peaks in the speed profile.
The median values across participants of the squared Pearson correlation coefficient, R2, between the observed variables and the estimated observation variables were as follows: 0.79 for MV, 0.54 for nMD, 0.62 for nPK, and 0.81 for %Succ. Figure 6A shows the values of R2 for each value of the threshold in r (at increments of 0.1). The threshold thmax = 2 was the most representative of physiotherapists’ decisions (R2 = 0.87; P < .001). It is interesting to note that Sessionthres and Sessionphys differed by ~5 sessions, on average (1-tailed paired t test, P < .001). Therefore, if the algorithm had been applied during the training with this value of the threshold, it would have provided instructions to increase task difficulty 5 sessions earlier.
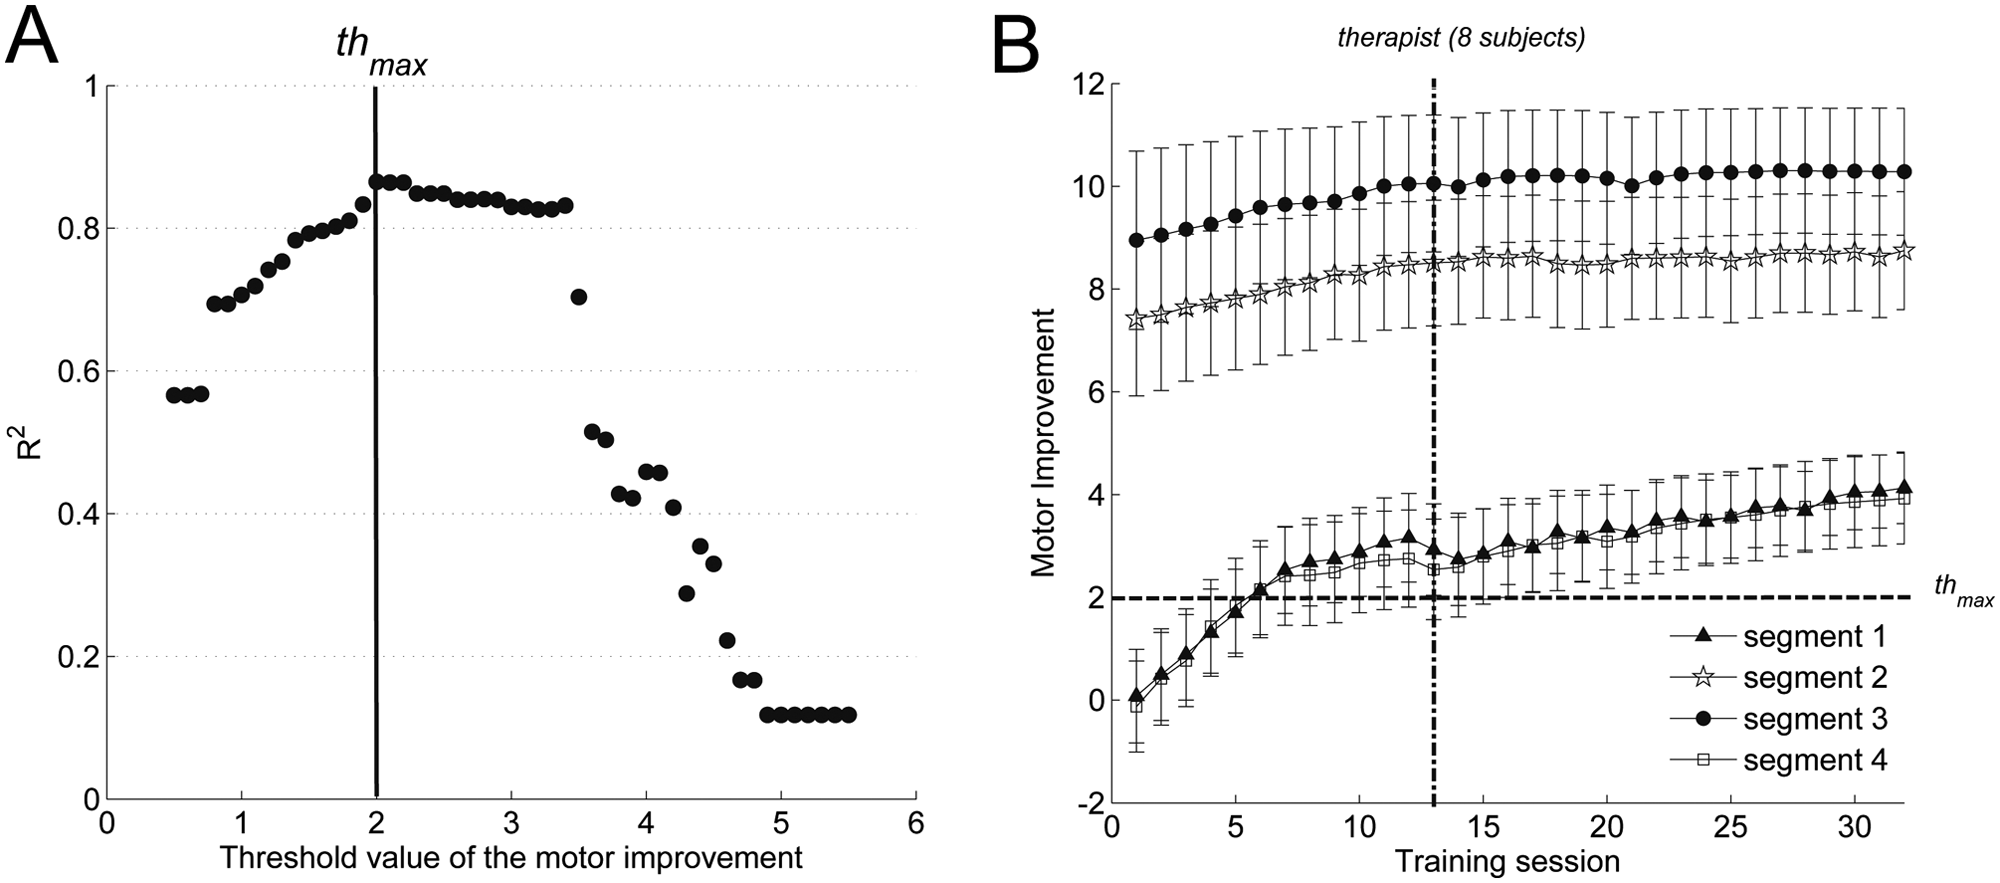
State-space model to track motor improvement: (A) correlation between the decisions taken by physiotherapists and those suggested by the algorithm. Values assumed by the squared Pearson correlation coefficient, R2, for each value, at fixed increments of 0.1 of the motor improvement threshold in the range r = [0.5-5.5]. (B) Average motor improvement curves estimated by the model for the 18 participants involved in the rehabilitation training. Curves describing improvement over segments 1 and 2 of the square path show similar features. Curves for segments 2 and 3, although similar, differed markedly from those for 1 and 4. The dashed line shows the threshold on motor improvement curves corresponding to the decisions suggested by the algorithm. The dash-dotted line shows the mean session chosen by physiotherapists to increase task difficulty in 8 out of 18 patients.
Therapy adaptation
As motor improvement followed a different time course on each subtask (see Figure 2), we investigated whether the statistical algorithm described by Equations (1) to (3) could have helped physiotherapists dynamically adapt treatment on a subtask basis.
Figure 6B illustrates the average Motor improvement curves for the 18 participants along the 4 segments of SP. The curves are similar to %Succ and the kinematic variables shown in Figure 2. Segments 1 and 4 show a similar pattern of recovery, whereas segments 2 and 3 vary much more slowly and to a smaller extent. Average curves for segment 2 and segment 3 show a high variability when compared with 1 and 4. Although an actual variability among participants’ behavior along these directions partially contributed to the standard error (vertical bars), the latter is mainly a consequence of motor improvement boundlessness, and especially for extremely good (bad) performance, it can assume very high (low) values.
As motor improvement on different segments can be tracked, and a method to tune the algorithm to mimic physiotherapists’ decision rules was found, we finally propose a design of the algorithm to dynamically adapt subtask difficulty: (1) evaluate patient’s motor improvement at each session for each subtask; (2) if motor improvement for a single subtask crosses a fixed threshold, increase subtask difficulty, otherwise keep the same settings in the next session; (3) loop over the previous steps until the performance on each subtask reaches the desired improvement or a plateau phase (both to be defined by physiotherapists).
Discussion
This study shows that people with chronic stroke performing robot-aided rehabilitation of the upper limb on a multicomponent task exhibit a subtask-dependent motor recovery. An algorithm able to dynamically track patient’s motor improvement was proposed and tested on simulated data. When applied to real data, the algorithm adopted therapist-like decision rules for varying task difficulty based on the patient’s performance at the task level. A design of the algorithm based on the patient’s performance at the subtask level was proposed, unwrapping new possibilities to carry out customized treatment.
Motor Recovery Is Direction Dependent
Stroke reduces the ability to independently control muscles during arm movement, and the affected limbs show coupling of joints or muscles.34,35 These abnormal patterns have been shown to limit the workspace of reaching movements.36,37 After a period of treatment, abnormal patterns might be broken down, and patients’ reaching workspace restored.38,39
In this study we observed an abnormal reaching workspace for our patients. In particular, their capability to autonomously perform elbow-extension movements (segments 1 and 4 of SP) was initially limited (Figure 2, panel D). Moreover, when successfully generated, these movements exhibited low speed, low smoothness, and high trajectory errors, compared with elbow-flexion movements (Figure 4, top panels, gray lines). We also showed that after treatment, the workspace was successfully restored (Figure 4, top panels, black lines). It is interesting to note that motor recovery showed a subtask-dependent time course (Figures 2 and 3), suggesting that different mechanisms were responsible for generating and recovering movements toward (and from) different target locations. Of course, this behavior might be a result of differing abilities of our patients, depending on the experienced lesion site and area. Additionally, this directional dependence might have been exploited by the physiotherapist if recognized to increase the rate or level of improvement.
Generalization of Motor Recovery
Motor recovery has been shown to generalize across the same workspace.39,40 In this article, we investigated to what extent motor recovery of chronic stroke patients generalizes on point-to-point reaching movements executed outside the workspace on which they were previously trained. More specifically, patients were trained on a planar square-shaped workspace (training workspace), and then, in case of significant improvement, on a different diamond-shaped workspace, which included point-to-point movements both within and outside the training workspace. Moreover, we investigated differences between movements toward and away from the body and toward and away from the hemiparetic side.
Our results suggest that although motor gains generalize well on new point-to-point movements executed inside the training workspace, it generalizes only to some extent on point-to-point movements outside. In particular, movements executed outside the training workspace were slower, less accurate, and less smooth than those within. Therefore, generalization of motor recovery can only be expected on movements falling within the workspace spanned by the movements executed during training. On the other hand, one might ask whether there is a minimum set of movements optimally spanning the workspace of interest—that is, if sufficient motor recovery can be achieved by practicing on a selected number of nonredundant movements within a workspace. Unfortunately, our data cannot help in clarifying this point, and specific experiments are required to investigate whether a particular subset of movements is more effective than others.
Rohrer et al20,41 showed that movement smoothness increases during stroke recovery. Our results, however, suggest that smoothness is not sufficient to objectively quantify motor recovery. In fact, both movement smoothness and the other robotic variables do not generalize outside the training workspace; but whereas differences in smoothness between movements toward and away from the hemiparetic side vanished after training (Figure 3, third row, rightmost panel), motor performance quantified by other variables (MV, nMD) showed a different behavior: that is, patients did not recover to the same extent in all directions.
Dynamically Tracking Motor Improvement
Tracking aspects of motor improvement while treatment is being delivered may enable the therapist to dynamically customize practice to boost recovery. In addition, performance-based progressive training schemes have been proposed as a way to gradually reduce the amount of robotic assistance during training or change the task practiced by the patients based on measured abilities.25-29 The patient’s performance is evaluated on a task level basis—that is, after each task repetition—but tasks consist of several elementary components, each of which might have a different influence on treatment effects. 18
Our application of a statistical tool dynamically tracked the patient’s progress during robotic-assisted training. The algorithm allows the estimation of a motor improvement curve for the ongoing task and subtasks. So far, it has been used mainly to study associative learning and neural correlates in animal experiments, 31 and to our knowledge, this is the first study testing such an algorithm for robotic-based rehabilitation. One major benefit of using such an approach, with respect to more conventional methods, is that it allows for an early estimation of when the participant significantly improves performance. 32 This information would allow the therapist to keep the task challenging and the participant motivated throughout the training. Moreover, we showed that the proposed approach provides a natural framework for integrating several robotic measurements into a single meaningful tool to monitor patient progress during rehabilitation. We chose 3 continuous variables—MV, nMD, and nPK—because they showed significant correlation with a subset of clinical scales 24 and were only moderately correlated among them and 1 discrete variable—%Succ. The tool can be easily modified to take into account different metrics—and even a larger number of variables—by providing a different set of observation equations (Equations 2 and 3). We used log-linear functions (Equation 3) to model the continuous variables, but standard model selection approaches, such as the Akaike information criterion and Bayesian information criterion, can be used to choose different models that are more appropriate for the data. 31 Moreover, if necessary, the motor improvement curve might be estimated at each repetition of the motor task instead of at the end of the session. This modification is especially useful when the therapist needs to vary task difficulty within a training session to maintain motivation and challenge the motor system.
We designed a control algorithm for (semi)automatic adaptation of therapy. We validated it by showing its ability to mimic the physiotherapist’s decision rules on when to change task difficulty based on the participant’s reaching a plateau in performance. Moreover, we showed that it can apply similar decision rules to suggest to the therapist when to vary subtask difficulty in order to continuously challenge the patient’s neuromuscular system and, consequently, boost recovery. In the case of the apparatus used in this study, ways to make the task more difficult, in a specified segment of the path, include the following: (1) decrease the gain between the force exerted by the patient and the movement executed by the manipulator, therefore requiring more force applied in a specific direction to move the robotic handle; (2) introduce a velocity-dependent field; and (3) introduce a divergent force field pushing the handle in a direction orthogonal to the movement. Future work will explore these possibilities to help therapists carry out customized and more effective robot-assisted therapy programs.
Footnotes
Appendix
Acknowledgements
The authors would like to thank Ms Alessandra Mazzone and Ms Carmen Delconte for their valuable contribution in the data collection and analysis and the personnel of The Biorobotics Institute, Scuola Superiore Sant’Anna, for their contribution in the design of the MEMOS device.
Declaration of Conflicting Interests
The author(s) declared no potential conflicts of interest with respect to the research, authorship, and/or publication of this article.
Funding
The author(s) disclosed receipt of the following financial support for the research, authorship, and/or publication of this article: This research was partly funded by the EU grant FP7-ICT-231724 HUMOUR.