
Abstract
Background
Gait speed or 6-minute walk test are frequently used to project community ambulation abilities post-stroke by categorizing individuals as household ambulators, limited, or unlimited community ambulators. However, whether improved clinically-assessed gait outcomes truly translate into enhanced real-world community ambulation remains uncertain.
Objective
This cross-sectional study aimed to examine differences in home and community ambulation between established categories of speed- and endurance-based classification systems of community ambulation post-stroke and compare these with healthy controls.
Methods
Sixty stroke survivors and 18 healthy controls participated. Stroke survivors were categorized into low-speed, medium-speed, or high-speed groups based on speed-based classifications and into low-endurance, medium-endurance, or high-endurance groups based on the endurance-based classification. Home and community steps/day were quantified using Global Positioning System and accelerometer devices over 7 days.
Results
The low-speed groups exhibited fewer home and community steps/day than their medium- and high-speed counterparts (P < .05). The low-endurance group took fewer community steps/day than the high-endurance group (P < .05). Despite vast differences in clinical measures of gait speed and endurance, the medium-speed/endurance groups did not differ in their home and community steps/day from the high-speed/endurance groups, respectively. Stroke survivors took 48% fewer home steps/day and 77% fewer community steps/day than healthy controls.
Conclusions
Clinical classification systems may only distinguish home ambulators from community ambulators, but not between levels of community ambulation, especially beyond certain thresholds of gait speed and endurance. Clinicians should use caution when predicting community ambulation status through clinical measures, due to the limited translation of these classification systems into the real world.
Introduction
Advancements in post-stroke gait rehabilitation have led to substantial recovery rates, with 65% to 85% of stroke survivors regaining the ability to walk independently in controlled environments such as their homes or clinics.1,2 However, many individuals still face limitations in community ambulation, 3 which is concerning given its recognized importance in post-stroke recovery.4,5 Community ambulation, defined as “independent mobility outside the home, including the ability to confidently negotiate uneven terrain, private venues, shopping centers, and other public spaces,” 4 is crucial for fostering an active lifestyle, social engagement, and overall quality of life among stroke survivors.5-9 Consequently, improving community ambulation is a vital but currently unmet goal of post-stroke rehabilitation. 10
Historically, clinical measures of gait speed 11 and endurance have been used to predict community ambulation. 12 In a seminal 1995 study, Perry et al 11 used expert opinion to establish gait speed as an independent discriminator of post-stroke community ambulation levels, leading to the widely adopted, conventional classification system of home ambulators (<0.4 m/s), limited community ambulators (0.4-0.8 m/s), and unlimited community ambulators (>0.8 m/s).12-15 Subsequent research by Schmid et al 15 elucidated that transitioning between these categories were clinically meaningful with substantially improved quality of life, in initial household ambulators. However, in 2017, based on direct measurement of daily walking activity, 16 Fulk et al., determined that the 6-minute walk test (6MWT) is a superior discriminator of post-stroke community ambulation and advised 6MWT cut-offs (home ambulators: <204 m, limited community ambulators: 204 to 288 m, and unlimited community ambulators: >288 m) and updated gait speed-based cut-offs (home ambulators: <0.49 m/s, limited community ambulators: 0.49-0.93 m/s, and unlimited community ambulators: >0.93 m/s) to better discriminate between community ambulation levels.
Despite these advancements, there remains a gap in understanding the relationship between clinical measures and real-world community ambulation. While gait speed and 6MWT provide insights into an individual’s walking “capacity,” that is, what one can do in a structured environment, they may not fully capture walking “performance” that is, what one actually does their own free-living environment. 17 The rehabilitation community increasingly recognizes that walking capacity and walking performance are distinct constructs that may not necessarily predict or improve each other. 18 Previous accelerometry studies demonstrated that stroke survivors classified as “unlimited community ambulators” according to speed- or endurance-based criteria exhibit a higher total daily step count compared to “limited community ambulators” or “home ambulators.”13,14,19 However, further analysis of accelerometry data by Roos et al 14 revealed that differences in step counts between the conventional speed-based categories were primarily due to a lower frequency and length of walking bouts per day. Even stroke survivors categorized as “unlimited community ambulators” based on an average 6MWT distance of 463 m were found to have limitations in the number of long-distance walking bouts per day, further underscoring the disparity between walking capacity and walking performance. 14 In spite of these insights, accelerometers lack location-specific data, hindering a precise understanding of where individuals accumulate their steps—at home or in the community. Recent studies utilizing Global Positioning Systems (GPS) technology,20,21 have revealed that even after achieving “unlimited community ambulator” status based on both gait speed and 6MWT distance, individuals did not exhibit an increase in their community trips,20,21 destinations visited, 20 or community walking activity 21 over a 1-year period post-stroke.20,21 This highlights a notable gap in the current classification systems, as the location of community ambulation has not been systematically addressed in their development and validation. 4
Given these considerations, the primary purpose of this study was to compare daily home and community steps between the established speed- and endurance-based categories of post-stroke community ambulation. We hypothesized that “home ambulators” would take significantly fewer home and community steps than the “limited” and ‘‘unlimited community ambulators’’ within each classification system. However, considering that walking capacity may only explain 30% to 50% of the variance in walking performance,3,22 distinctions between walking performance levels may become less unambiguous as capacities increase, potentially due to the influence of other factors. Hence, we hypothesized no significant differences in home and community steps between “limited” and “unlimited” community ambulation categories. Additionally, while it’s commonly assumed that healthy older adults would take more steps/day in home and community environments than stroke survivors, this gap has not yet been objectively quantified using accelerometer and GPS devices. Hence, our secondary aim was to compare home and community steps between stroke survivors and healthy controls. By bridging the gap between capacity-based predictions and real-world walking performance, our study aims to provide valuable insights for stakeholders to develop more effective interventions and strategies for long-term stroke management.
Methods
This cross-sectional study was conducted at the Malcolm Randall VAMC Brain Rehabilitation Research Center, Gainesville, Florida and Brooks Rehabilitation Clinical Research Center, Jacksonville, Florida. According to a power analysis based on our pilot study (see Supplemental Material#1), we recruited 70 participants at least 6 months post-stroke and 20 age- and location-matched healthy controls, between October 2019 to April 2023, based on the following inclusion criteria: (1) >18 years of age, (2) community-dwelling, (3) able to follow a 3-step command, and (4) able to walk independently without assistance from another person. Stroke survivors and healthy controls were excluded if they had (1) history of intermittent claudication, (2) angina at rest or with minimal exertion, (3) history of COPD, (4) orthopedic condition that limits mobility, (5) a neurological diagnosis (other than stroke for stroke survivors), (6) use of a wheelchair or scooter as their primary means of mobility, and (7) ongoing physical rehabilitation services. Location of stroke survivors and healthy controls was matched based on their neighborhood walkability, as determined by their resident’s Walk Score®. 23 Eligible participants signed a written informed consent form approved by the University of Florida Institutional Review Board.
Procedures
All participants walked over a GAITRite®, an instrumented 4.98-m walkway, for 2 trials at their self-selected speed with a 1-m pathway on either side of the GAITRite® to allow for acceleration and deceleration to assure capture of participants’ steady-state speed. Participants’ walking speed was quantified as the average of the 2 trials. The 6MWT assessed participants’ gait endurance24,25 and has demonstrated excellent test–retest reliability (ICC = .95). 26 Participants used their customary assistive devices during all assessments.
The StepWatch Activity Monitor-4 recorded daily steps. 14 The StepWatch™ is a micro-processor-linked, pager-sized accelerometer with a 30-day battery life. 27 The StepWatch™ was calibrated to each stroke survivor’s and healthy control’s self-reported height and GAITRite®-derived non-paretic or left stride length, respectively. Stroke survivors wore the StepWatch™ on their non-paretic ankle,27,28 and healthy controls on their left ankle.
The GlobalSat® DG-500 GPS device detected the location of walking activity. This pager-sized, low-cost device has a 17-hour battery life.29,30 GlobalSat® has been validated to study outdoor walking 29 and has been used for quantifying outdoor ambulation post-stroke. 20 Participants wore the GPS device on a waist belt.
Participants wore the StepWatch™ and GPS devices during all waking hours except while bathing or participating in water-related activities, for 7 consecutive days. Unlike the StepWatch™, the GPS device was charged nightly. To ensure compliance, we provided detailed instructions and demonstration on wearing the devices and charging the GPS device with the aid of an instructional manual. Additionally, we sent daily text messages to remind participants to don the devices in the morning and charge the GPS device at night.
Data Analysis
Community Ambulation Categories
Based on their gait speed, participants were placed into community ambulation categories as per the conventional speed-based classification (low-speed1: <0.4 m/s; medium-speed1: 0.4-0.8 m/s; and high-speed1: >0.8 m/s), and the updated speed-based classification systems (low-speed2: <0.49 m/s, medium-speed2: 0.49-0.93 m/s; and high-speed2: >0.93 m/s). Additionally, based on their 6MWT, participants were classified into categories as per the endurance-based classification system (low-endurance: <204 m; medium-endurance: 204-288 m; and high-endurance:>288 m).
Steps/Day
After 7 days of recording, we downloaded the StepWatch™ data in Microsoft® Excel® format. The StepWatch™ directly provided amount of strides/day in 10-second intervals.27,28 To obtain total daily steps the number of stride/days were doubled and summated.31-33
Walking Bouts/Day
Given the complexity of community ambulation, which often involves walking longer distances, 34 it is imperative to examine the length of walking bouts undertaken by stroke survivors outside their homes, in addition to assessing the total number of steps taken per day. 14 Accordingly, Roos et al., categorized the length of walking bouts based on average distances required for community ambulation 34 and a typical post-stroke step length of 0.5 m. 35 Based on Roos et al’s 14 methodology, we categorized community walking bouts into short-distance (<40 steps/bout), medium-distance (41 to 300 steps/bout), and long-distance (>300 steps/bout).19,21,36 The start of a bout was operationally defined as at least 4 steps within a 10-second interval and the end of a bout as a 10-second interval in which no steps occurred. 14 The total number of daily bouts were then segregated and summed by their lengths using a customized MATLAB code.
Walking Location
The GlobalSat® recorded the participant’s location data (latitude, longitude, and timestamp) at 5-second intervals, that was downloaded via device-specific software post-data collection into Microsoft® Excel® format.29,30 Using time stamp synchronization in MATLAB, we mapped the walking performance from StepWatch™ onto the location data from GlobalSat®. Any missing data from GlobalSat® was interpolated linearly between the previous and next location. A detailed algorithm for handling missing GPS data has been previously published. 33 Each participant’s location of walking performance was categorized into home (latitude and longitude of participant’s home address with 85-m surrounding perimeter) and community (location outside the 85-m radius). The 85-m radius helped account for average yard space 37 and any erroneous spikes (ie, noise) in the GPS signals when indoors (see Supplemental Material #2).
We then computed the daily home and community steps/day and the number of short, medium- and long-distance bouts taken in the community per day. To be included in the data analysis, a participant must have worn the devices for at least 8 continuous hours per day for a minimum of 4 days. 38 This was confirmed through visual examination of step data plots for each participant. All variables were then averaged over the number of compliant days.
Statistical Analysis
We used the Kolmogorov–Smirnov and Shapiro–Wilk tests 39 to determine the normality of the dependent variables and to ensure absence of skewness, kurtosis, and any outliers. 39 Additionally, we ensured multivariate normality by testing for homogeneity of covariance (a nonsignificant Box’s M test) and checked for non-redundancy of variables (correlation coefficients between variables <0.7). 40 For all statistical tests, the conventional speed-based classification system (low-speed1, medium-speed1, and high-speed1 groups), the updated speed-based classification system (low-speed2, medium-speed2, and high-speed2 groups) and the endurance-based classification system (low-endurance, medium-endurance, and high-endurance groups) were tested separately.
Differences in home and community steps/day between each of the 3 post-stroke groups for each classification system were tested with multivariate analysis of variance (MANOVA) models. Kruskal–Wallis tests compared the differences in the average number of short-, medium-, and long-distance community walking bouts/day between each classification system’s post-stroke groups, as these variables were not normally distributed. Similarly, differences in home and community steps/day and in length of community walking bouts/day between stroke survivors and healthy controls were tested using MANOVA and Mann–Whitney U tests, respectively. For any significant main effects in the parametric and non-parametric tests, follow-up pairwise comparisons were conducted between each group with Bonferroni corrections. Effect sizes for all between-group differences were computed through Hedge’s g. Analysis was conducted using the Statistical Package for the Social Sciences (SPSS, V.24) with significance level set at α = .05.
Results
Seventy stroke survivors and 20 healthy individuals participated. Ten stroke survivors and 2 healthy control participants were excluded because of non-compliance with study procedures (n = 6) or insufficient GPS data (n = 6). Thus, 60 stroke survivors and 18 healthy controls were included in the final analysis. As per our aim, stroke survivors were classified into the conventional speed-based categories (Low-speed1: n = 19, Medium-speed1: n = 22, and High-speed1: n = 19 groups), the updated speed-based categories (Low-speed2: n = 23, Medium-speed2: n = 24, and High-speed2: n = 13 groups) and the endurance-based categories (Low-endurance: n = 30, Medium-endurance: n = 13, and High-endurance: n = 17 groups); according to their average gait speed or 6MWT distance. All participants’ demographics and clinical characteristics are listed in Table 1. None of the speed- and endurance-based categories differed significantly in employment status or living situation. Not surprisingly, healthy controls were more likely to be employed than stroke survivors (χ2 = 4.3, P = .03).
Demographic/Clinical Characteristics.
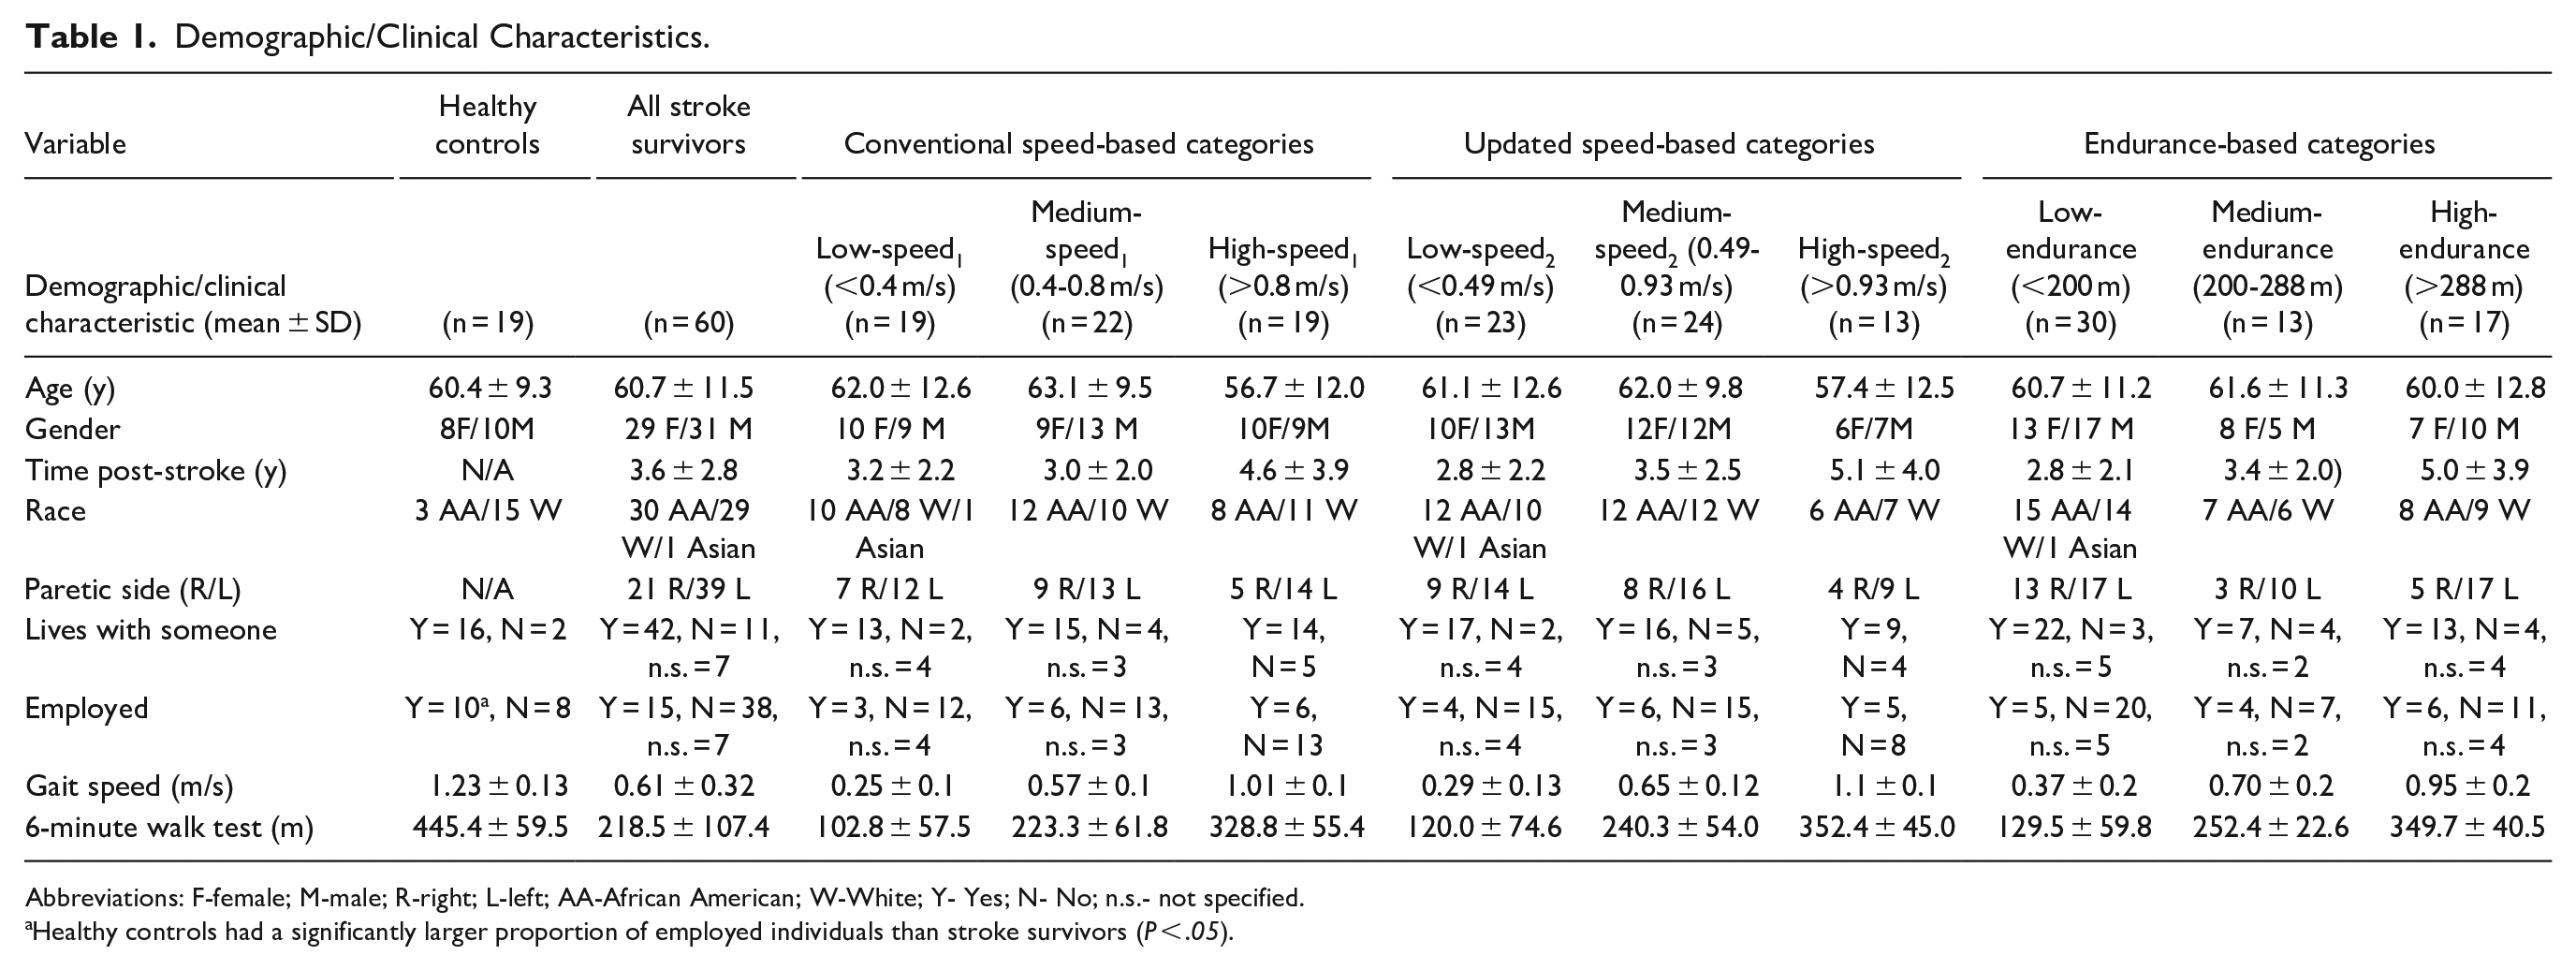
Abbreviations: F-female; M-male; R-right; L-left; AA-African American; W-White; Y- Yes; N- No; n.s.- not specified.
Healthy controls had a significantly larger proportion of employed individuals than stroke survivors (P < .05).
Dependent Variable: Home and Community Steps/day
Conventional Speed-Based Categories
The conventional speed-based categories exhibited significant differences in home and community steps/day with a large effect size (MANOVA main effect: Wilks’ Λ = .69; P < .001, ŋ 2 = .17). Follow-up univariate analysis revealed that the low-speed1 group took significantly fewer home steps/day and community steps/day than the medium-speed1 group (Home steps/day: P = .027, Hedge’s g = 0.9; Community steps/day: P = .03, Hedge’s g = 0.92) and the high-speed1 group (Home steps/day P = .001, Hedge’s g = 1.3; Community steps/day: P = .012, Hedge’s g = 1.0) with large effect sizes. However, the medium-speed1 and high-speed1 groups did not differ from each other in daily home steps or community steps (Table 2, Figure 1).
Differences in Home and Community Ambulation Variables in Speed- and Endurance-based Categories.
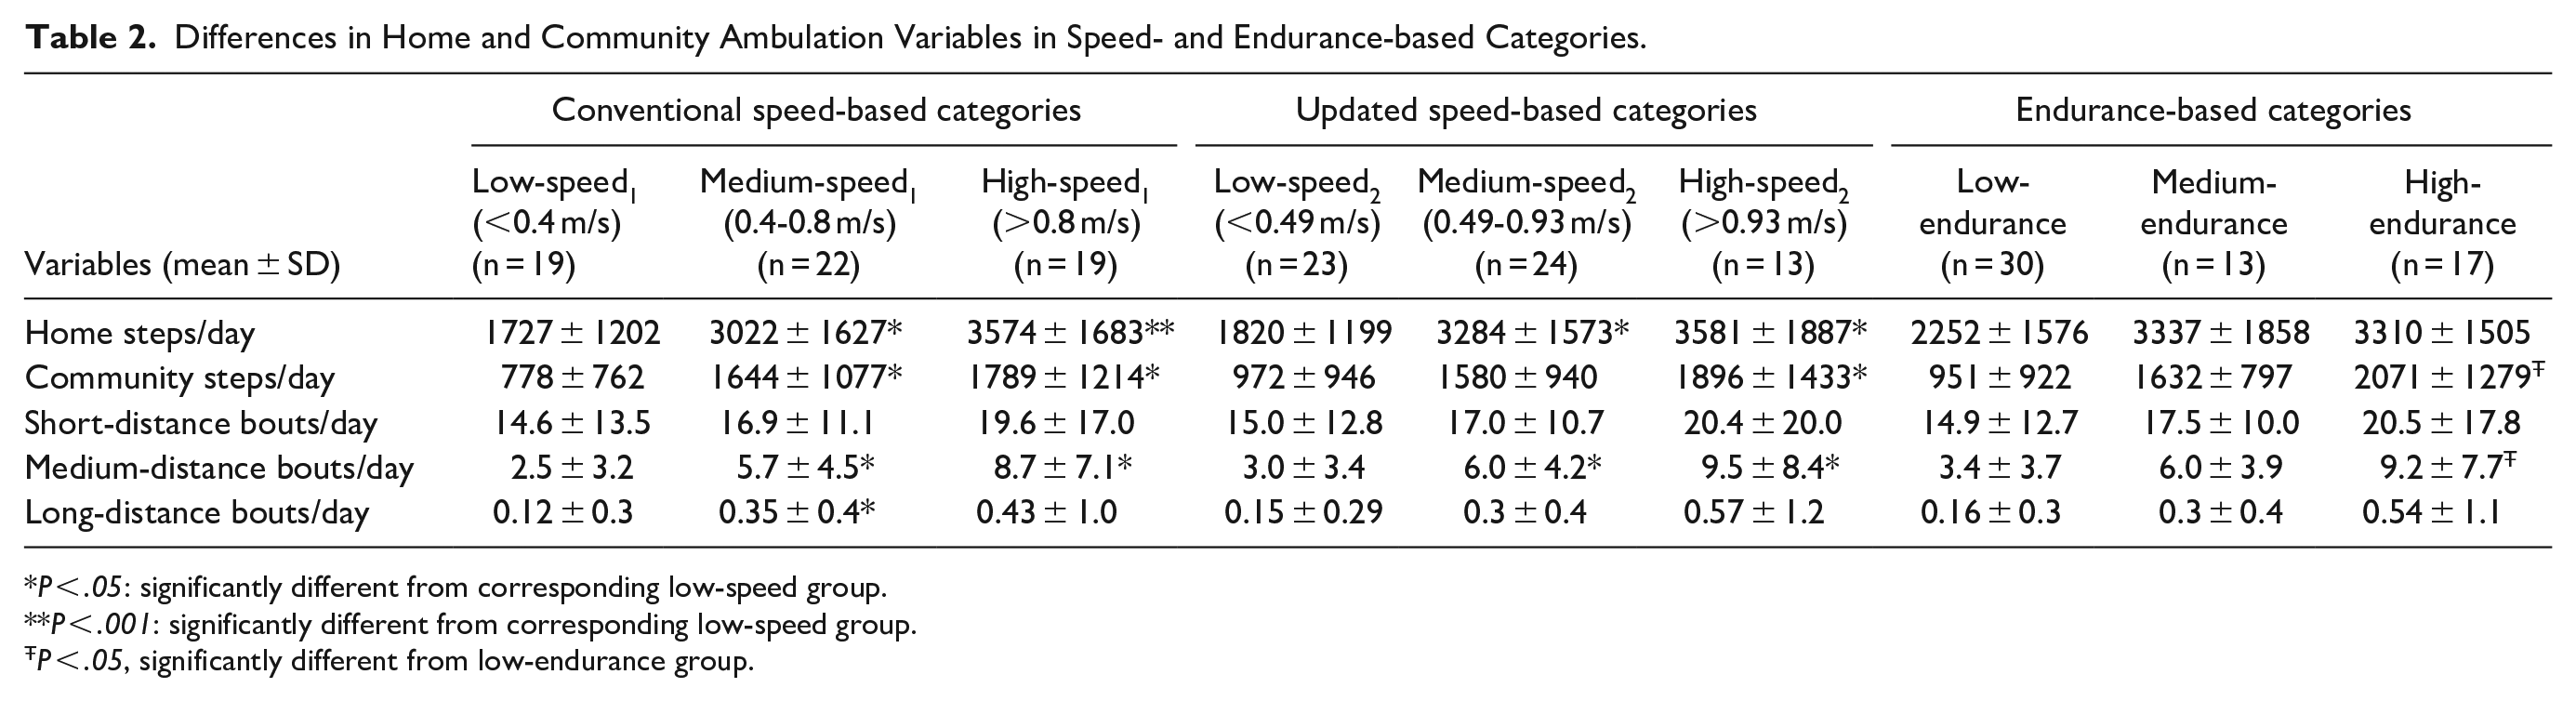
P < .05: significantly different from corresponding low-speed group.
P < .001: significantly different from corresponding low-speed group.
P < .05, significantly different from low-endurance group.
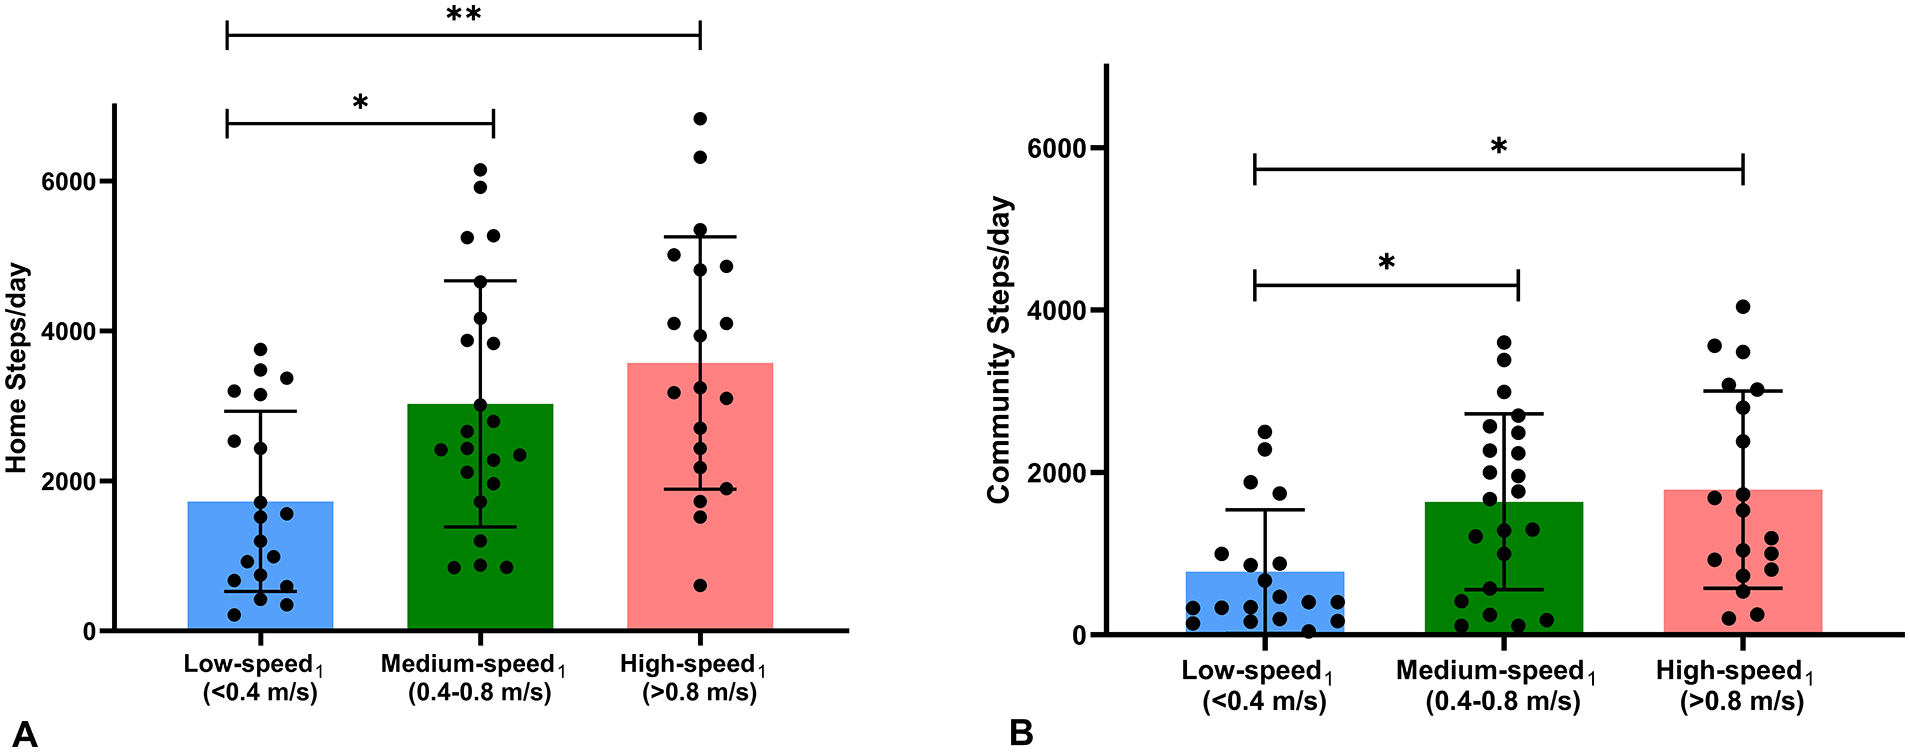
Differences in home and community steps/day between the conventional speed-based categories of low-, medium-, and high-speed1 groups. Low-speed1 group (blue) took significantly fewer home (A) and community steps/day (B) than medium- (green) and high- (pink) speed1 groups.
Updated Speed-Based Categories
The updated speed-based categories demonstrated significant differences in home and community steps/day with a large effect size (MANOVA main effect: Wilks’ Λ = .72; P < .001, ŋ 2 = 0.15). Follow-up univariate analysis revealed that the low-speed2 group took significantly fewer home steps/day than the medium-speed2 (P = .005, Hedge’s g = 1.06) and high-speed2 groups (P = .004, Hedge’s g = 1.2) with large effect sizes. Additionally, the low-speed2 group took significantly fewer community steps/day than the high-speed2 group (P = .046, Hedge’s g = 0.81) with medium effect size, but not as compared to the medium-speed2 group (P = .17). Like the conventional speed-based categories, the updated medium-speed2 and high-speed2 groups did not differ from each other in daily home steps or community steps (Table 2, Figure 2).
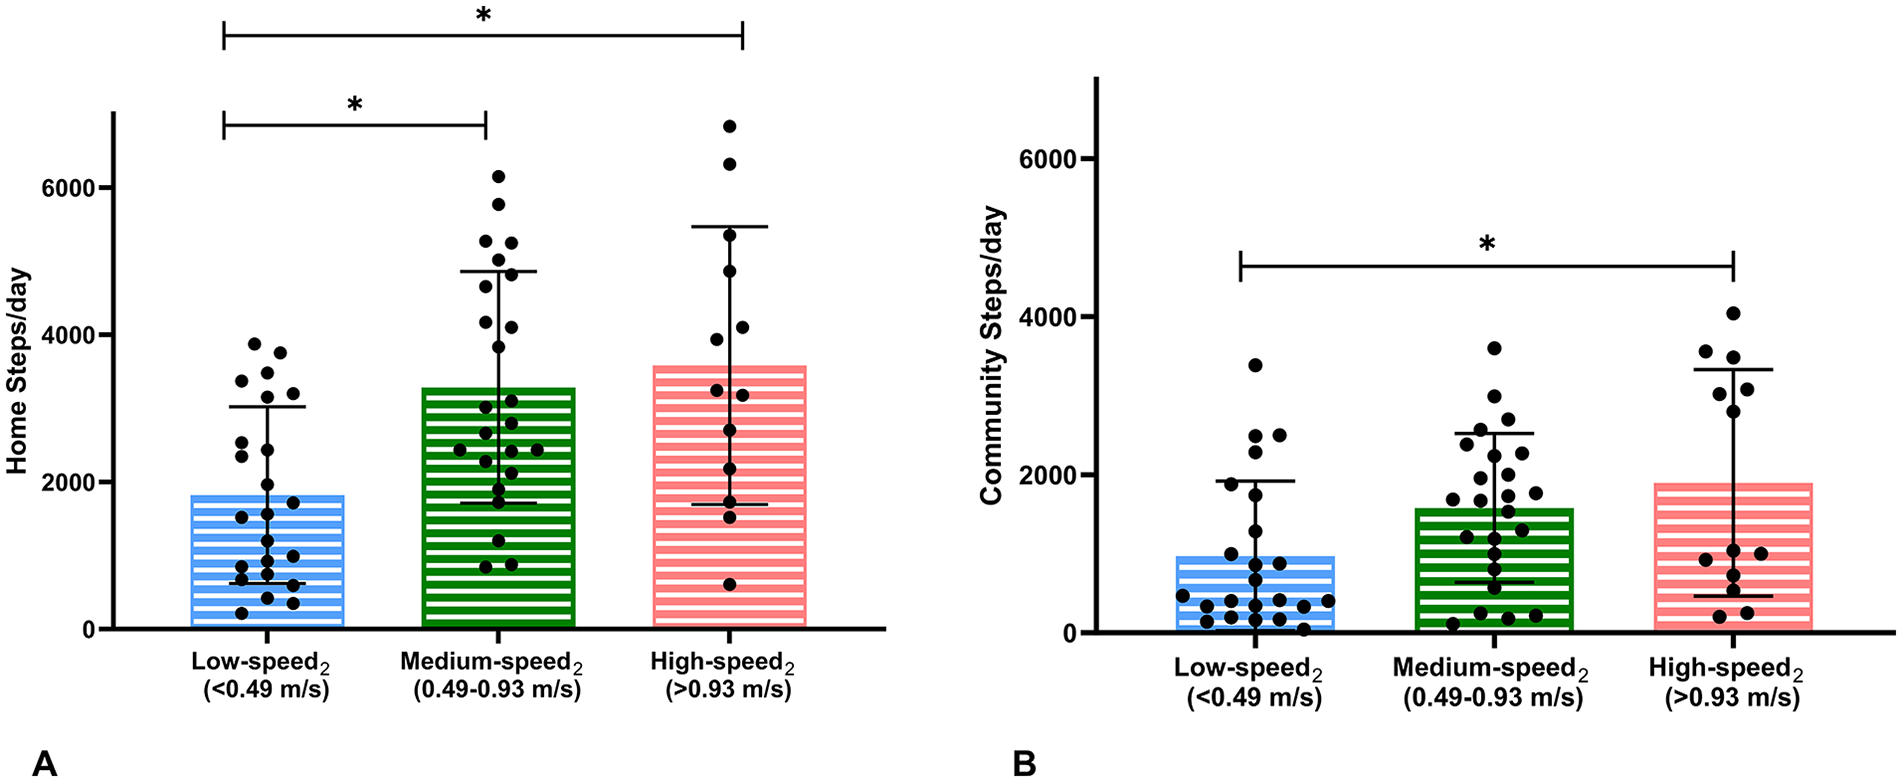
Differences in home and community steps/day between the updated speed-based categories of low-, medium-, and high-speed2 groups. Low-speed2 group (blue) took significantly fewer home steps/day than medium- (green) and high- (pink) speed2 groups (A). Low-speed2 group (blue) took significantly fewer community steps/day than high- (pink) speed2 group (B).
Endurance-Based Categories
The endurance-based categories revealed significant differences in home and community steps/day with a large effect size (MANOVA main effect: Wilks’ Λ = .74; P = .002, ŋ 2 = .14). Follow-up univariate analysis showed that the low-endurance group took significantly fewer community steps/day than the high-endurance group (P = .002, Hedge’s g = 1.1) with a large effect size, but not compared to the medium-endurance group (P = .14, Hedge’s g = 0.76). Additionally, the medium- and high-endurance groups did not differ in their community steps/day. Lastly, none of the endurance groups differed in their home steps/day (Table 2, Figure 3).
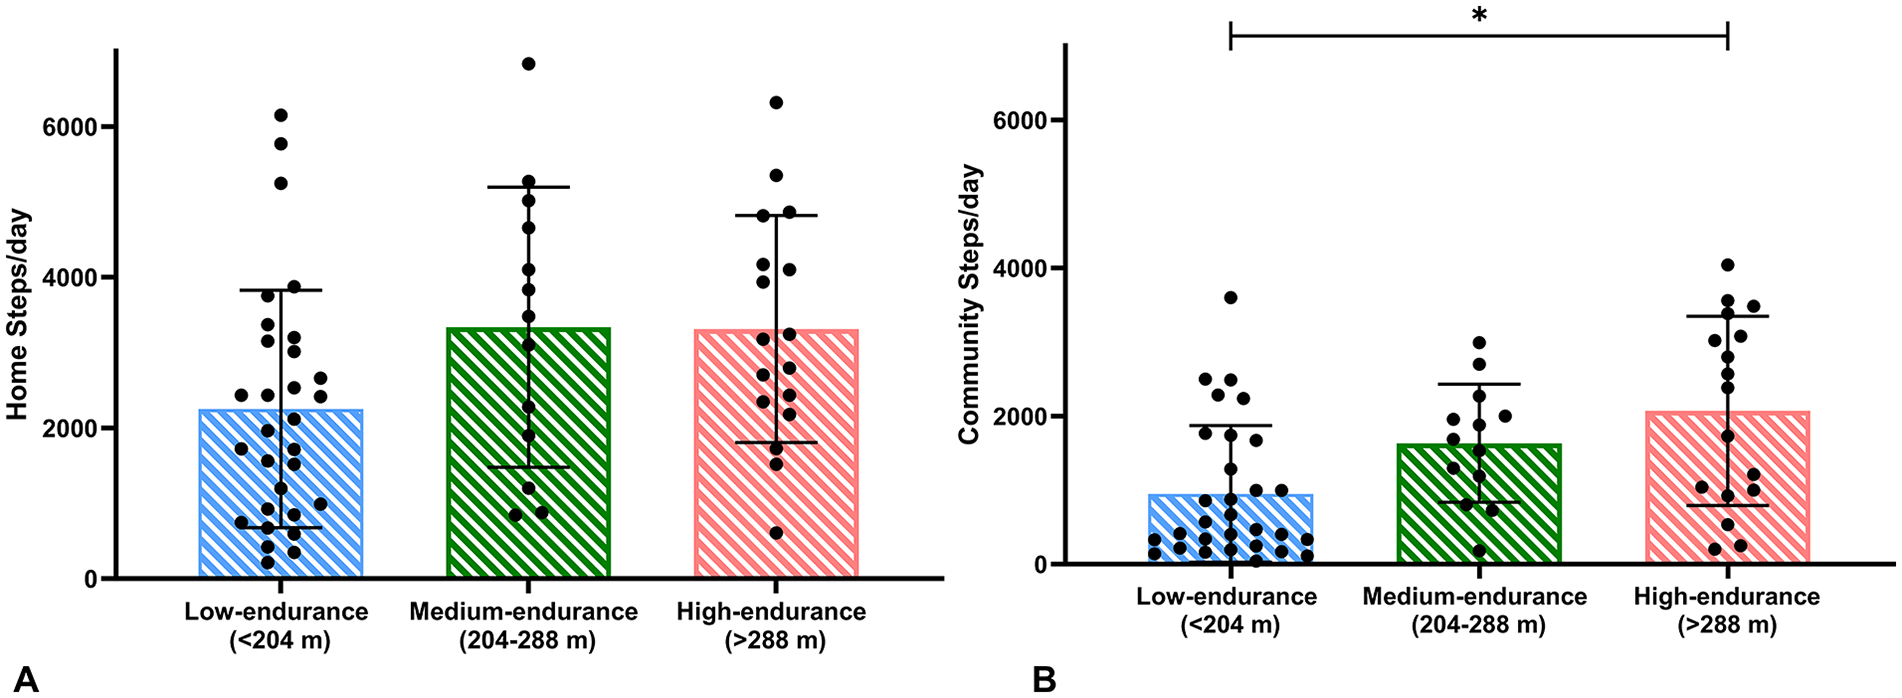
Differences in home and community steps/day between low- (blue), medium- (green), and high- (pink) endurance groups. (A) No differences in home steps/day across the endurance-based groups, (B) The low endurance group took significantly fewer community steps/day than the high endurance group.
Dependent Variable: Length of Walking Bouts
Conventional Speed-Based Categories
The main effects for the differences between the conventional speed-based categories were significant for the medium-distance (P = .001) and long-distance community bouts (P = .04), but not for the short-distance bouts (P = .57). Follow-up analysis revealed that the low-speed1 group took significantly fewer number of medium-distance bouts/day, compared to the medium-speed1 group (P = .039, Hedge’s g = 0.8), and high-speed1 group (P = .01, Hedge’s g = 1.1) with large effect sizes. Additionally, the low-speed1 group took significantly fewer long-distance bouts than the medium-speed1 group (P = .036, Hedge’s g = 0.64) with a medium effect size, but not compared to the high-speed1 group (P = .10, Hedge’s g = 0.42). Finally, the medium-speed1 group and high-speed1 group did not differ from each other in their medium-distance or long-distance bouts/day (Table 2).
Updated Speed-Based Categories
The main effect for differences between the updated speed-based categories was significant for the medium-distance community walking bouts (P = .007), but not for the short- and long-distance walking bouts. Follow-up analysis revealed that the low-speed2 groups took significantly fewer number of medium-distance bouts/day, compared to both the medium-speed2 group (P = .025, Hedge’s g = 0.78), and high-speed2 group (P = .022, Hedge’s g = 1.1) with large effect sizes. However, the medium-speed2 and high-speed2 groups did not differ in their medium-distance walking bouts/day (Table 2).
Endurance-Based Categories
The main effect for the differences in medium-distance (P = .05) community walking bouts was significant between the 3 groups, but not for short- and long-distance community walking bouts. Follow-up analysis revealed that the low-endurance group took significantly fewer number of medium-distance bouts than the high-endurance group (P = .008, Hedge’s g = 1.1) with a large effect size, but not as compared to the medium-endurance group. Lastly, the medium- and high-endurance groups did not differ in the medium-distance bouts/day (Table 2).
Comparison Between Stroke Survivors and Healthy Controls
All stroke survivors took 48% fewer home steps and 77% fewer community steps compared to age- and location-matched healthy controls (Main effect: Wilks’ Λ = .37; P < .001, ŋ 2 = .63, large effect size). Moreover, healthy controls took 53% of their total steps in the community, whereas stroke survivors only took 31% to 38% of their total steps in the community, depending on their speed- and endurance-based categories (Tables 2 and 3). Additionally, stroke survivors took fewer short-distance (P = .014), medium-distance (P = .001), and long-distance community walking bouts (P = .001) than healthy controls (Table 3). Depending on speed- or endurance-based groups, stroke survivors took 33% to 68% fewer steps at home and 66% to 87% fewer steps in the community, compared to healthy controls (Tables 2 and 3).
Differences in Home and Community Ambulation Variables Between Healthy Controls and All Stroke Survivors.
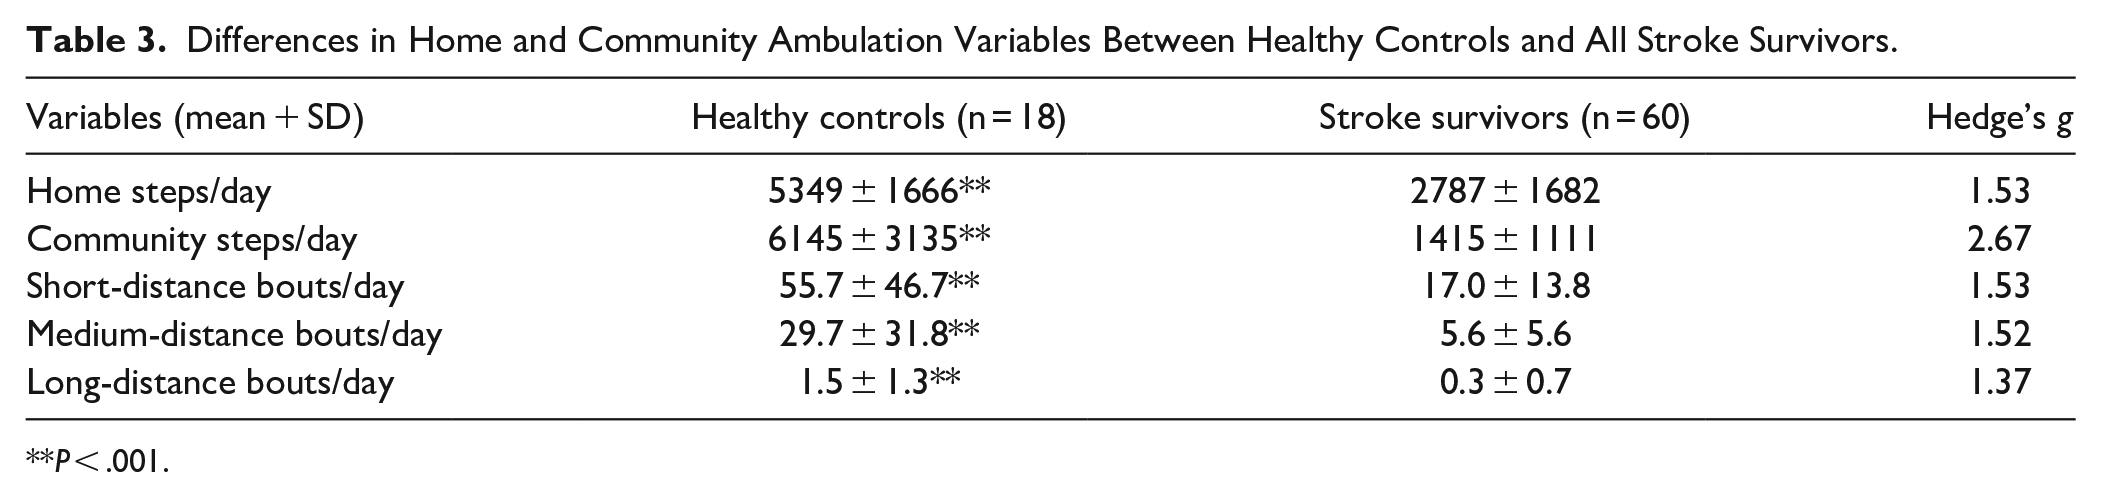
P < .001.
Discussion
This study aimed to examine the differences in real-world walking performance among stroke survivors classified into speed- and endurance-based categories of community ambulation and compare these findings with age- and location-matched healthy controls. Our results support our hypothesis that individuals categorized as low-speed or low-endurance groups take fewer community steps per day compared to their higher-speed or higher-endurance counterparts. Interestingly, no significant differences were observed in home or community walking performance between medium and high speed/endurance groups, despite significant variations in gait-related capacity. These findings emphasize the limitations of translating clinical capacity-based outcomes to real-world walking performance in the community post-stroke.
Contrary to prevalent clinical classification systems, our study suggests that distinctions in true community walking performance may not align with traditional categories of “unlimited” versus “limited community ambulators.”11-13,41 Our results bolster previous reports that capacity-based predictions of community ambulation overestimate real-world walking performance.12,42 It is plausible that stroke survivors who walk slower than 0.49 m/s or less than 204 m in the 6MWT, are too physically challenged to ambulate in their home and community environments than those who walk faster or further. Beyond these thresholds, other factors such as falls-efficacy,3,43,44 balance, 43 and motivation 5 may influence one’s ability to ambulate in their home and community environments more than their physical limitations. Indeed, our previous work has indicated that psychological factors, such as stress responses during outdoor walking tasks, can impact home and community walking behaviors regardless of gait speed and endurance levels. 33 Our present findings highlight the clear need for comprehensive interventions rooted in behavior change models 45 that address personal and social factors alongside walking capacity.
Our results diverge from prior studies that suggest stroke survivors who walk faster than 0.8 m/s or further than 288 m exhibit higher daily steps13,19,46,47 and total walking bouts,14,46 compared to slow walkers. Such discrepancies may stem from the location of walking performance examined in the present study. Unlike previous research13,14,19,46 relying solely on step-count data from accelerometers to infer community ambulation, our novel approach of pairing a GPS device with an accelerometer allowed for a specific examination to differentiate walking performance in the home from community settings post-stroke. The discrepancies between previous reports and the present study may also be attributable to either methodological or chronological differences. For example, the Sensewear Armband used previously 46 has shown poor correlation with the StepWatch™ and may underestimate step activity, especially in individuals with slower gait speeds. 48 Furthermore, prior studies13,14,19 using the StepWatch™ were conducted over a decade ago, when electronic aids for daily activities were less prevalent. 49 Given the heightened adoption of information and communication technology among stroke survivors, including e-banking, online shopping, and social networking, 50 higher gait speed may no longer be the sole determinant of community ambulation. Our findings align with experts’ perspectives41,44,51 and encourage rehabilitation professionals to not solely rely on capacity-based measures to infer community ambulation status post-stroke, especially beyond gait speeds of 0.49 m/s or 6MWT distance beyond 204 m. Instead, measuring community ambulation directly through travel logs or consumer-friendly wearable technology may create a more accurate picture of one’s community ambulation level post-stroke. 52
The fact that the low-endurance group did not differ in their home ambulation from their higher endurance counterparts, implies that the differences reported previously in total steps/day between the endurance-based categories 19 may be partially explained by the low-endurance group’s specific limitation in community ambulation. Moreover, the absence of distinctions in home ambulation across all endurance-based categories seems logical, 34 as activities at home can be accomplished without sustained walking efforts and with frequent rest breaks. Home ambulation may be impacted by a myriad of factors such as size and structure of home, overprotective family members, motivation to be active at home, fatigue, fear of falling, and sedentary behavior.53,54 Indeed, stroke survivors who are primarily home-bound often exhibit prolonged sedentary behavior. 6 Future research might explore the distinct factors influencing home ambulation compared to those influencing community ambulation. 22
Although none of the groups differed in their short-distance community bouts, the low-speed/endurance groups exhibited markedly fewer medium-distance community bouts (41-300 steps/bout) than the higher speed/endurance groups. This suggests that individuals with slower gait speeds or shorter 6MWT distances may encounter challenges in sustaining medium-distance community walking bouts, likely due to increased fatigue, diminished endurance, and a potentially heightened fall risk. 55 Conversely, the absence of differences in long-distance bouts among the 3 endurance-based groups indicates that increased gait endurance may only facilitate walking for medium distances (41-300 steps/bout) but does not automatically translate to long-distance walking activities (>300 steps/bout). As stroke survivors typically take less than 300 steps during their 6MWT, 56 they may need to walk for more than 6 minutes without rest breaks to complete a long-distance community walking bout. This may be challenging even for the “unlimited community ambulators” based on the current 6MWT categories. Future research might explore longer functional walking tests, such as the 12-minute walk test, 57 to better discern community ambulation post-stroke. Our results encourage rehabilitation specialists to investigate if improved long-distance walking capacities would enhance community walking performance post-stroke.
While previous reports have concluded that stroke survivors take fewer total daily steps14,58,59 than healthy controls, the present study provides empirical evidence that this difference in total steps predominantly stems from stroke survivors’ limitation in community ambulation, rather than home ambulation. Consistent with previous GPS-based studies, which reported that individuals in the first 6 months post-stroke take an average of 1700 to 2298 community steps per day, 21 our findings reveal a similar range, highlighting the ongoing challenge of restricted community ambulation throughout the chronic phase of stroke. Additionally, our results underscore the notable restriction in the length of community walking bouts per day among stroke survivors compared to healthy controls, highlighting the need for improvement in long-distance walking ability to enhance community ambulation post-stroke. Our results urge rehabilitation specialists, social workers, policy makers, and caregivers to address the critical need of enhancing community walking behavior for all stroke survivors, regardless of their functional walking capacities.
While our study has notable strengths, several limitations warrant acknowledgment. Despite instructing participants not to alter their daily walking activity, the awareness of being observed might have influenced their ambulation behaviors., As the ankle-worn StepWatch™ does not provide feedback on daily ambulatory activity, any potential Hawthorne effect may have been mitigated. Secondly, this study was limited to the state of Florida, and results may not be generalizable to regions with different climates or cultural contexts. We recognize that real-world walking performance is impacted by a myriad of personal, environmental, and psychosocial factors,2,3,44,47 our cohort displayed much variability in their walking activity, however our sample size precluded a multivariate analysis. The narrow bandwidth of the endurance-based classification system for limited community ambulators between 204 and 287 m restricted just 13 individuals assigned to the medium-endurance group, reducing the statistical power for an accurate comparison. Future investigation may examine walking performance in varied geographical areas and in a larger cohort.
Conclusion
In conclusion, our results suggest that while stroke survivors can achieve specific gait speed thresholds or complete certain distances in the 6MWT, their actual walking performance in home and community settings may not correspond accordingly. Ours is the first study to specifically examine differences in home and community ambulation between categories of speed- and endurance-based classification systems by pairing a GPS device with an accelerometer. However, these classification systems may be more effective in distinguishing between home and community ambulators rather than varying levels of community ambulation, particularly beyond the thresholds of gait speed >0.4 m/s or 6MWT>204 m. Rehabilitation specialists and clinical researchers should refrain from labelling stroke survivors as “limited community ambulators” or “unlimited community ambulators” based solely on their gait speed or 6MWT. Instead, our findings urge clinicians to directly measure walking performance in daily life through consumer-friendly wearable devices or travel diaries. Lastly, irrespective of clinical capacities, stroke survivors demonstrate significantly restricted community ambulation compared to healthy individuals, highlighting the need to develop robust, holistic interventions to improve community ambulation post-stroke.
Supplemental Material
sj-pdf-1-nnr-10.1177_15459683241257521 – Supplemental material for Speed- and Endurance-Based Classifications of Community Ambulation Post-Stroke Revisited: The Importance of Location in Walking Performance Measurement
Supplemental material, sj-pdf-1-nnr-10.1177_15459683241257521 for Speed- and Endurance-Based Classifications of Community Ambulation Post-Stroke Revisited: The Importance of Location in Walking Performance Measurement by Kanika Bansal, Emily J. Fox, David Clark, George Fulk and Dorian K. Rose in Neurorehabilitation and Neural Repair
Supplemental Material
sj-pdf-2-nnr-10.1177_15459683241257521 – Supplemental material for Speed- and Endurance-Based Classifications of Community Ambulation Post-Stroke Revisited: The Importance of Location in Walking Performance Measurement
Supplemental material, sj-pdf-2-nnr-10.1177_15459683241257521 for Speed- and Endurance-Based Classifications of Community Ambulation Post-Stroke Revisited: The Importance of Location in Walking Performance Measurement by Kanika Bansal, Emily J. Fox, David Clark, George Fulk and Dorian K. Rose in Neurorehabilitation and Neural Repair
Footnotes
Acknowledgements
We thank Dr. Christopher Janelle for his guidance throughout Dr. Bansal’s dissertation, Michael Monaldi, MSBE for developing this project’s MATLAB code, and the clinical research teams at the Malcom Randall VAMC and Brooks Rehabilitation for assistance with participant recruitment and data collection.
Author Contributions
Kanika Bansal: Conceptualization; Formal analysis; Investigation; Methodology; Software; Validation; Visualization; Writing—original draft; Writing—review & editing. Emily Fox: Conceptualization; Investigation; Project administration; Resources; Supervision; Writing—review & editing. David Clark: Conceptualization; Formal analysis; Project administration; Resources; Software; Supervision; Writing—review & editing. George Fulk: Conceptualization; Methodology; Writing—review & editing. Dorian Rose: Conceptualization; Data curation; Formal analysis; Funding acquisition; Investigation; Methodology; Project administration; Resources; Software; Supervision; Validation; Writing—review & editing.
Declaration of Conflicting Interests
The author(s) declared no potential conflicts of interest with respect to the research, authorship, and/or publication of this article.
Funding
The author(s) disclosed receipt of the following financial support for the research, authorship, and/or publication of this article: Veteran’s Health Administration-Rehabilitation Research & Development (0419BRRC-04; B3336-P); Brooks Rehabilitation-University of Florida College of Public Health and Health Professions Collaboration; Florida Department of Health (20K08)
Supplementary material for this article is available on the Neurorehabilitation & Neural Repair website along with the online version of this article.
References
Supplementary Material
Please find the following supplemental material available below.
For Open Access articles published under a Creative Commons License, all supplemental material carries the same license as the article it is associated with.
For non-Open Access articles published, all supplemental material carries a non-exclusive license, and permission requests for re-use of supplemental material or any part of supplemental material shall be sent directly to the copyright owner as specified in the copyright notice associated with the article.