
Abstract
Background
Non-disabling stroke (NDS) and transient ischemic attack (TIA) herald the possibility of future, more debilitating vascular events. Evidence is conflicting about potency of exercise and education in reducing risk factors for second stroke.
Methods
Three-site, single-blinded, randomized controlled trial with 184 participants <3 months of NDS or TIA (mean age, 65 years; 66% male) randomized to usual care (UC) or UC + 12-week program of exercise and education (PREVENT). Primary (resting systolic blood pressure) and secondary outcomes (diastolic blood pressure [DBPrest], high-density lipoprotein cholesterol [HDL-C], low-density lipoprotein cholesterol [LDL-C], total cholesterol [TC], TC/HDL, triglycerides, fasting glucose, and body mass index) were assessed at baseline, post-intervention, and 6- and 12-month follow-up. Peak oxygen consumption (VO2peak) was measured at baseline, post-intervention, 12-month assessments.
Results
Significant between-group differences at post-intervention favored PREVENT group over UC: DBPrest (mean difference [MD]: −3.2 mmHg, 95% confidence interval [CI]: −6.3, −.2, P = .04) and LDL-C (MD: −.31 mmol/L, 95% CI: −.42, −.20, P = .02). Trends of improvement in PREVENT group were noted in several variables between baseline and 6-month follow-up but not sustained at 12-month follow-up. Of note, VO2 peak did not change over time in either group.
Conclusion
Impact of PREVENT on vascular risk factor reduction was more modest than anticipated, possibly because several outcome variables approximated normative values at baseline and training intensity may have been sub-optimal. Further investigation is warranted to determine when exercise and education programs are viable adjuncts to pharmaceutical management for reduction of risk factors for second stroke.
Introduction
Non-disabling stroke (NDS) and transient ischemic attack (TIA) have long been regarded as relatively benign conditions due to lack of overt impairments and long-term consequences. 1 The reality is that NDS and TIA are harbingers of further, more debilitating vascular events or death. 2 The probability of a second stroke or death within the first 2 years following NDS and TIA is not trivial—from 10% in low-risk groups to up to 31% in high-risk groups. 3 Although the highest probability of second stroke is during the acute period, the risk persists long term and is independent of the severity of the index stroke. 4 Recurrent strokes are associated with greater physical disability, more institutionalization, and higher fatality rates, 5 and have been referred to as the most potentially modifiable outcome of stroke or TIA. 6 Thus, a multi-faceted secondary stroke reduction program represents a significant opportunity to lower the total stroke burden, even for patients with minor presenting events.
Most individuals presenting with TIA or NDS have significant atherosclerotic lesions throughout their vascular system and manifest, or are at increased risk of, co-morbid cardiovascular disease. 7 A host of factors interact synergistically to accelerate the progression of atherosclerosis, thereby increasing the risk of further cerebrovascular disease. Because many risk factors are modifiable, they are obvious targets of secondary prevention. However, control of vascular risk factors after TIA or stroke remains unacceptably poor; 8 a secondary analysis of two large data sets reported achieving control in only 10.6% of people with a history of stroke. 9 Particularly concerning is the lack of control of resting systolic and diastolic blood pressure (SBPrest and DBPrest), considering that hypertension accounts for a significant proportion of the aftermath of stroke and is, therefore, the most important risk factor to target for secondary prevention. 10
Clinical guidelines for secondary stroke prevention recommend a combination of pharmacological therapy and non-pharmacological interventions, including education, exercise, and lifestyle counselling.11-13 Lack of patient awareness and knowledge of cardiovascular risks is a known barrier to averting further events.14,15 Positive effects of exercise on cardiovascular risk factors,16,17 exercise capacity, 16 and mental wellbeing 18 in the general population are broadly recognized. Despite the suggestion from a modelling study that non-pharmacological strategies after stroke could result in at least 80% reduction in further vascular events, 19 evidence of effectiveness of such strategies remains equivocal. Six systematic reviews of randomized controlled trials (RCTs) on non-pharmacological interventions for vascular risk factor reduction post-stroke offer conflicting results—reduction in SBPrest and DBPrest; 20 improvement in SBPrest, high-density lipoprotein cholesterol (HDL-C), and fasting glucose; 21 decrease in SBPrest, DBPrest, and total cholesterol; 22 and no effects.23-25 These divergent findings are due, in part, to heterogeneity in terms of populations (e.g., stroke severity and time post-onset), experimental interventions (exercise, education, and/or lifestyle counselling), and comparison interventions (e.g., usual care [UC] and no intervention). The relative effectiveness of non-pharmacological interventions has not been systematically studied; however, Wang and colleagues 22 reported greater reductions in SBPrest with exercise and education compared to exercise alone. Further evidence of sustainability of results is lacking; only three RCTs included in the above reviews included follow-up greater than 6 months.26-28
We undertook this study to investigate short and long-term effects of a community-based program of rehabilitative exercise and education as an adjunct to pharmacological management to reduce vascular risk factors in people after NDS/TIA. SBPrest, the most robust predictor of secondary vascular events, 29 was selected as the primary outcome measure, and NDS or TIA as the population of interest to enhance homogeneity of stroke severity and ability to engage in exercise. The primary hypothesis was that the Program of Rehabilitative Exercise and Education to Avert Vascular Events after Non-disabling Stroke or Transient Ischemic Attack (PREVENT) program would be more effective than UC in reducing SBPrest at post-intervention. The secondary hypothesis was that improvements in SBPrest would be maintained at 6- and 12-month follow-ups. We also investigated the short and long-term effects of the PREVENT program vs UC on other modifiable vascular risk factors (i.e., DBPrest, lipids, fasting glucose, body mass index, and waist girth), cardiorespiratory fitness, depression, and fatigue.
Methods
Design
The study was a single-blind, parallel two-group RCT conducted at one urban and two rural community facilities (NCT00885456). Participants were randomly assigned to one of 2 groups (PREVENT +UC or UC alone), using the Stroke Prognosis Instrument II (SPI-II) for stratification. The SPI-II is a tool designed to stratify patients following TIA or NDS by prognosis for stroke or death in 2 years: 1. SPI-II Level 1 (0-3 points, low-risk) 2. Level 2 (4-7 points, moderate-risk) or Level 3 (8-15 points, high-risk). 3 Allocation concealment was assured through use of sequentially numbered, opaque, sealed envelopes containing group assignment, which were prepared by an individual not involved in the study and opened after completion of the baseline assessment. Each site’s ethics review board approved the study protocol, and all participants provided written informed consent.
Participants
We enrolled men and women over 17 years of age within 3 months of first probable or definite TIA (symptom resolution in ≤24 h) or NDS (National Institutes of Health Stroke Scale [NIHSS] <6). 30 Potential participants were excluded if they had contraindications to maximal exercise stress testing, 31 musculoskeletal or cognitive limitations that could preclude participation in the program, or involvement in other pharmacological or physical intervention studies. Family physicians of the participants were informed of intent to participate.
Calculation of sample size was based on the primary outcome, resting SBP, using estimates obtained from a previous study that examined the effects of aerobic exercise on resting SBP post-stroke. 32 A sample size of 89 in each group would have 80% power to detect a difference in means of 6.5 mmHg, assuming a common standard deviation of 15.4 and a type 1 error rate of 5% (two-sided). In anticipation of 10% attrition increased the target sample size was increased to 98 per group (196 in total).
Intervention Protocols
Usual Care
Following acute management, all participants in the PREVENT and UC groups attended an outpatient neurovascular clinic for: (i) a neurological assessment, (ii) counseling regarding stroke/TIA and diagnostic test results, and (iii) assessment, modification and education of secondary prevention factors (i.e., dietary intake, lipid profile, adherence to medication regime, physical activity, smoking, alcohol intake, elf-referral to weight loss, and smoking cessation programs). Required therapeutic interventions (e.g., medications, diagnostic/laboratory tests) were initiated or adjusted, and referrals were sent to appropriate team members or clinics (e.g., social work, physiotherapy, occupational therapy, dietitian, speech language pathologist, diabetes center, hypertension clinic, anticoagulation clinic, and smoking cessation). Follow-up care was provided by 1–3 return clinic visits after which patients were referred to their primary care physician.
PREVENT Intervention
Participants randomized to the PREVENT group engaged in a multi-modal, case-managed program of exercise and education. Because the intervention was behavior-focused, strategies known to facilitate and sustain behavior change were incorporated33-35: (i) meetings of participants and program providers to identify personal health goals, and related barriers and facilitators, (ii) exercise sessions supervised by health professionals, (iii) user-friendly health passports to record exercise schedule, medication regimen, and vascular risk factors, (iv) positive reinforcement, and (v) adult learning strategies (interactive educational sessions with participant involvement in content selection). Based on our previous exercise trials, we set a priori targets for adherence in attending exercise and education sessions: attending at least 75% of the total number of exercise sessions and at least 75% of the total number of education sessions.
Group exercise component 60-minute, group-based (4-6 PREVENT participants) exercise sessions were held twice weekly for 12 weeks in community centers and led by trained physiotherapists or kinesiologists. Substitute sessions for missed appointments were provided. The standardized program involved: (i) 10-minute warm-up, (ii) 10–15 minutes of progressive strengthening training of major muscle groups at 60–70% of one-repetition maximum, (iii) 30 minutes of aerobic training with three 10-minute stations of treadmill walking, stationary cycling, and stepping at a prescribed intensity (heart rate recorded during the baseline exercise test at 60–80% of VO2peak 31 ), and (iv) 5–10 minute cool-down. Heart rate and RPE were monitored intermittently, and blood pressure and blood sugars (when indicated) were measured before and after exercise. Aerobic training and strengthening exercises were prescribed and progressed according to ACSM guidelines (individualized and gradual increase in duration/repetitions and intensity/resistance as tolerated by the participant). 31 During the exercise sessions the therapists stressed the importance of continuing physical activity after completion of the program for 30 minutes per day, 5 days per week at a rating of perceived exertion (RPE) of “somewhat hard” to “hard.” 36
Education component Once weekly a multi-disciplinary team conducted an interactive 60-minute group session for participants, family members, and or caregivers. Discussion topics were: 1. Heart healthy eating: the basics, 2. Goal setting, 3. Exercise: The Basics, 4. Cardiovascular risk factors and BP self-monitoring, 5. Nutrition: building on the basics, 6. Exercise: Building on the basics, 7. Cardiovascular medications, 8. Healthy weight, 9. Smoking cessation, 10. Stress and coping, 11. Fine-tuning healthy eating, and 12. Wrap-up. The same slide decks were used across sites to ensure consistency of content.
Assessment Protocols
Participant characteristics (i.e., age, sex, employment status, time post-onset and side of lesion, stroke severity [NIHSS], 37 cognitive status [Montreal Cognitive Assessment 38 ], co-morbidities, and medications) were collected at enrollment. All assessments for each participant were conducted at baseline (pre-randomization), post-intervention, 6- and 12-months at a consistent time of day and by the same trained independent assessor blinded to the hypotheses and group assignment. Participants (necessarily unblinded) were instructed not to divulge their group assignment to the assessor. To determine the effectiveness of blinding, the assessor was asked to indicate on each assessment form their “guess” of the group assignment of each participant.
Given the diversity of potential health benefits of exercise, several vascular risk factors and physical and psychosocial variables were measured, based on the secondary stroke prevention literature, clinical relevance, psychometric qualities, and feasibility. Resting SBP was selected as the primary variable, measured in accordance with published guidelines. 39 Secondary outcomes included other markers of cardiovascular risk: DBPrest, 12-h fasting lipid profile (low-density lipoprotein cholesterol [LDL-C], HDL-C, high-density lipoprotein cholesterol [HDL-C], total cholesterol, triglycerides, ratio of total cholesterol to HDL-C), and 12-h fasting glucose.
Peak oxygen consumption (VO2peak), the gold standard for assessment of exercise capacity, was measured via open-circuit spirometry during a symptom-limited, graded, treadmill test (GXT) using an incremental ramp protocol (slow, regular, fast ramp) with a 2-min warm-up and cool-down, 1-min stages of exercise, continuous monitoring of electrocardiographic activity, and periodic recording of BP and RPE. 40 Selection of ramp protocol was based on comfortable overground speed, with the slow protocol for speeds <.9 m per second (mps); regular, .9-1.2 mps; and fast >1.2 mps. Participants unfamiliar with treadmill walking received a brief orientation prior to the GXT. Testing was conducted by a trained physiotherapist, electrocardiogram activity was monitored by a technician, and test termination followed ACSM criteria. 31
Standardized questionnaires were used to assess tertiary outcomes—anxiety and depression (Hospital Anxiety and Depression Scale, HADS-A and HADS-D, each subscale consisting of seven items with higher scores indicating more severe symptoms 41 ) and general fatigue (Fatigue Assessment Scale, FAS, ten items with higher scores indicating more severe symptoms 42 ).
Data Analysis
Before analysis, data were inspected to identify and remove outliers. Descriptive statistics were used to summarize demographic and clinical characteristics on admission. Between-group baseline differences were assessed with independent t-tests (continuous data), Pearson chi-squared tests (nominal data), and when assumptions of normality were violated (Kolmogorov-Smirnov test), nonparametric methods. Short-term effects on outcome variables were assessed by comparing pre-post change scores between groups using two-tailed independent t-tests. To examine treatment effects over time a mixed model analysis of variance (ANOVA) with repeated measures was used, with one between-subject factor at 2 levels (2 groups: PREVENT, UC) and one within-subject factor at 4 levels (time: baseline, post-program, 6-month follow-up, and 12-month follow-up). To control for baseline differences between groups, we planned to include variables that were significantly different at baseline as covariates in the analyses. Subgroup analysis was also conducted to compare outcomes of participants who had adhered to the PREVENT program (>75% attendance) to the UC group. Two-sample tests for proportions were performed to determine whether the blinded assessor’s guesses of group assignment at post-testing and 6- and 12-month evaluations were better than chance. Analyses were conducted using both intention-to-treat (last observation carried forward) and per protocol. Alpha level was set at < .05.
Results
Participants
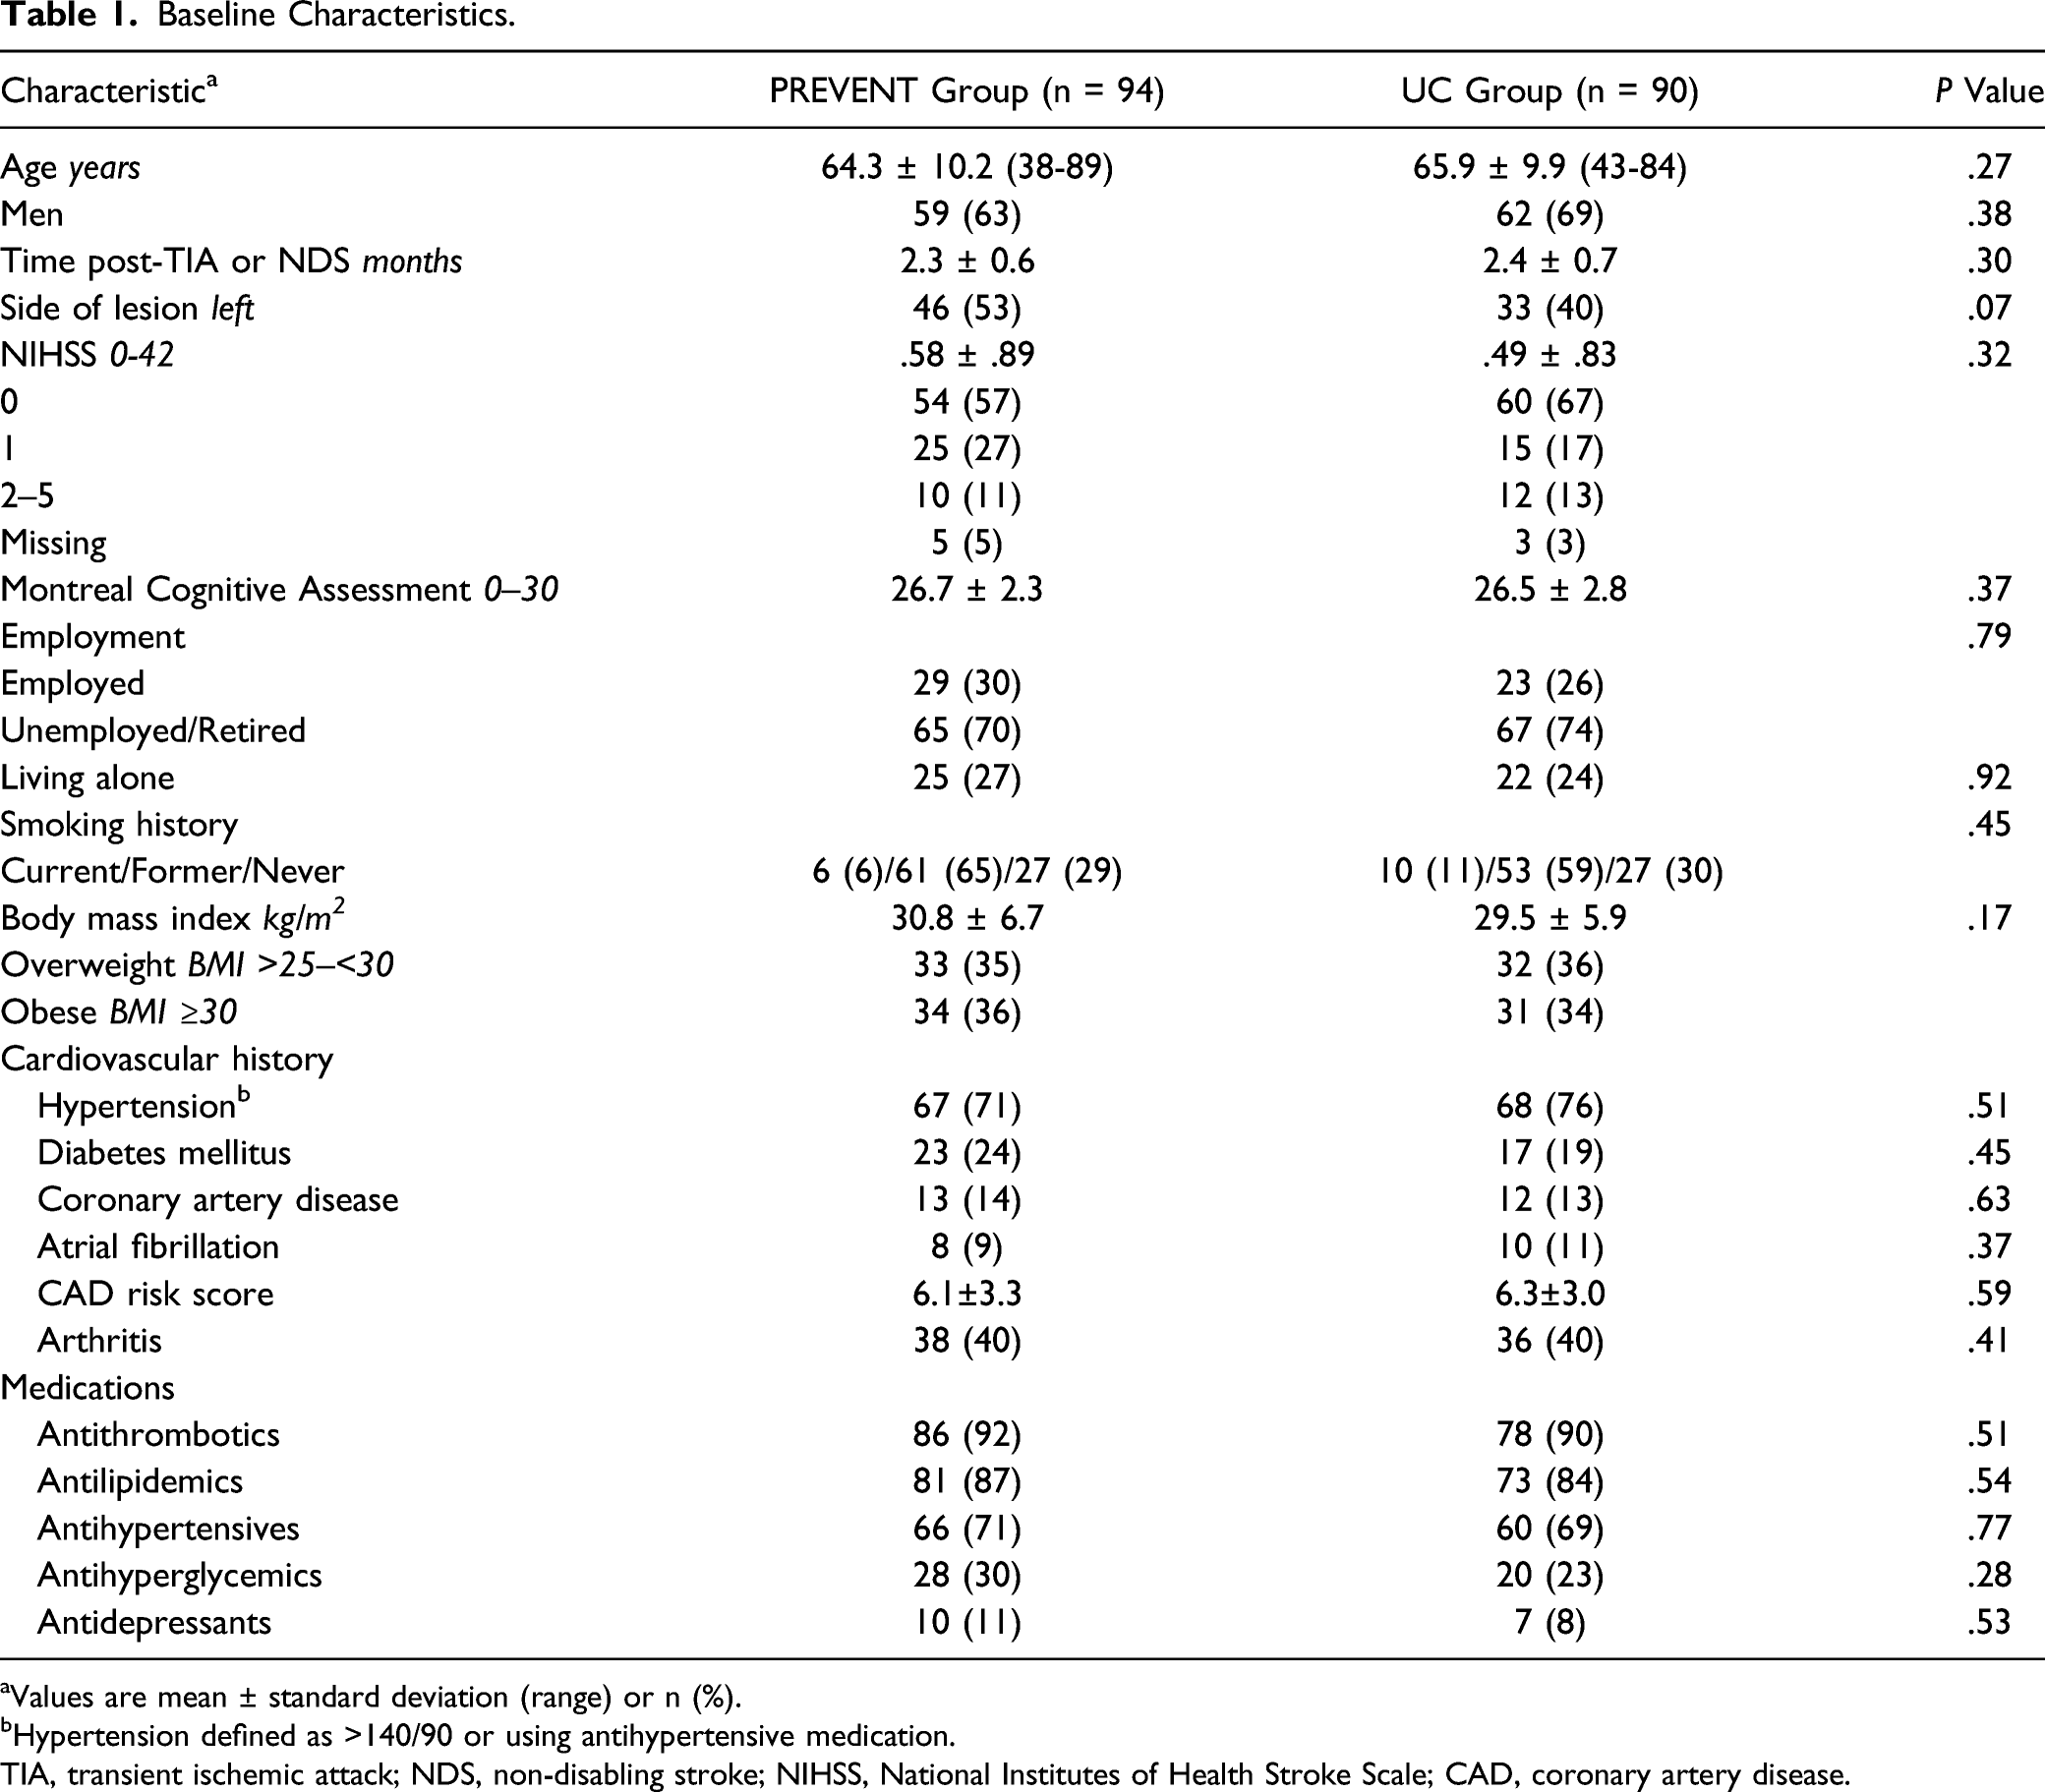
Of 388 people screened, 184 (47%) were randomized into the PREVENT group (n = 94) and UC group (n = 90) (Figure 1). Enrollment was terminated before reaching our target sample of 196 participants because of premature closure at one site due to slow recruitment and protracted recruitment at the remaining two sites. No significant differences were found in baseline characteristics between groups (Table 1). The majority were over 60 years of age, male, overweight, and on antithrombotic, antilipidemic, and antihypertensive agents. During the intervention period no changes in prescription medications were made in the PREVENT group and two changes were made in the UC group (an antidepressant and an antilipidemic were discontinued in two cases due to side effects). In the post-intervention period, 11 modifications were made in the PREVENT group (an antithrombotic and an antidepressant were discontinued in two cases; antilipidemics were discontinued in two cases and dose of antilipidemics was increased in two cases; dose of antihypertensive was increased in two cases and reduced in one case; and an antihyperglycemic and bronchodilator were added in two cases), and in the UC group, eight adjustments were made (an antithrombotic was added in one case and discontinued in another; dose of antihypertensive was increased in one case and reduced in one case, and type of antihypertensive was changed in another case; an antihyperglycemic was added in one case and the dose was increased in another; and an anxiolytic was added in one case). CONSORT flow diagram of subject progress through the phases of the trial. Baseline Characteristics. aValues are mean ± standard deviation (range) or n (%). bHypertension defined as >140/90 or using antihypertensive medication. TIA, transient ischemic attack; NDS, non-disabling stroke; NIHSS, National Institutes of Health Stroke Scale; CAD, coronary artery disease.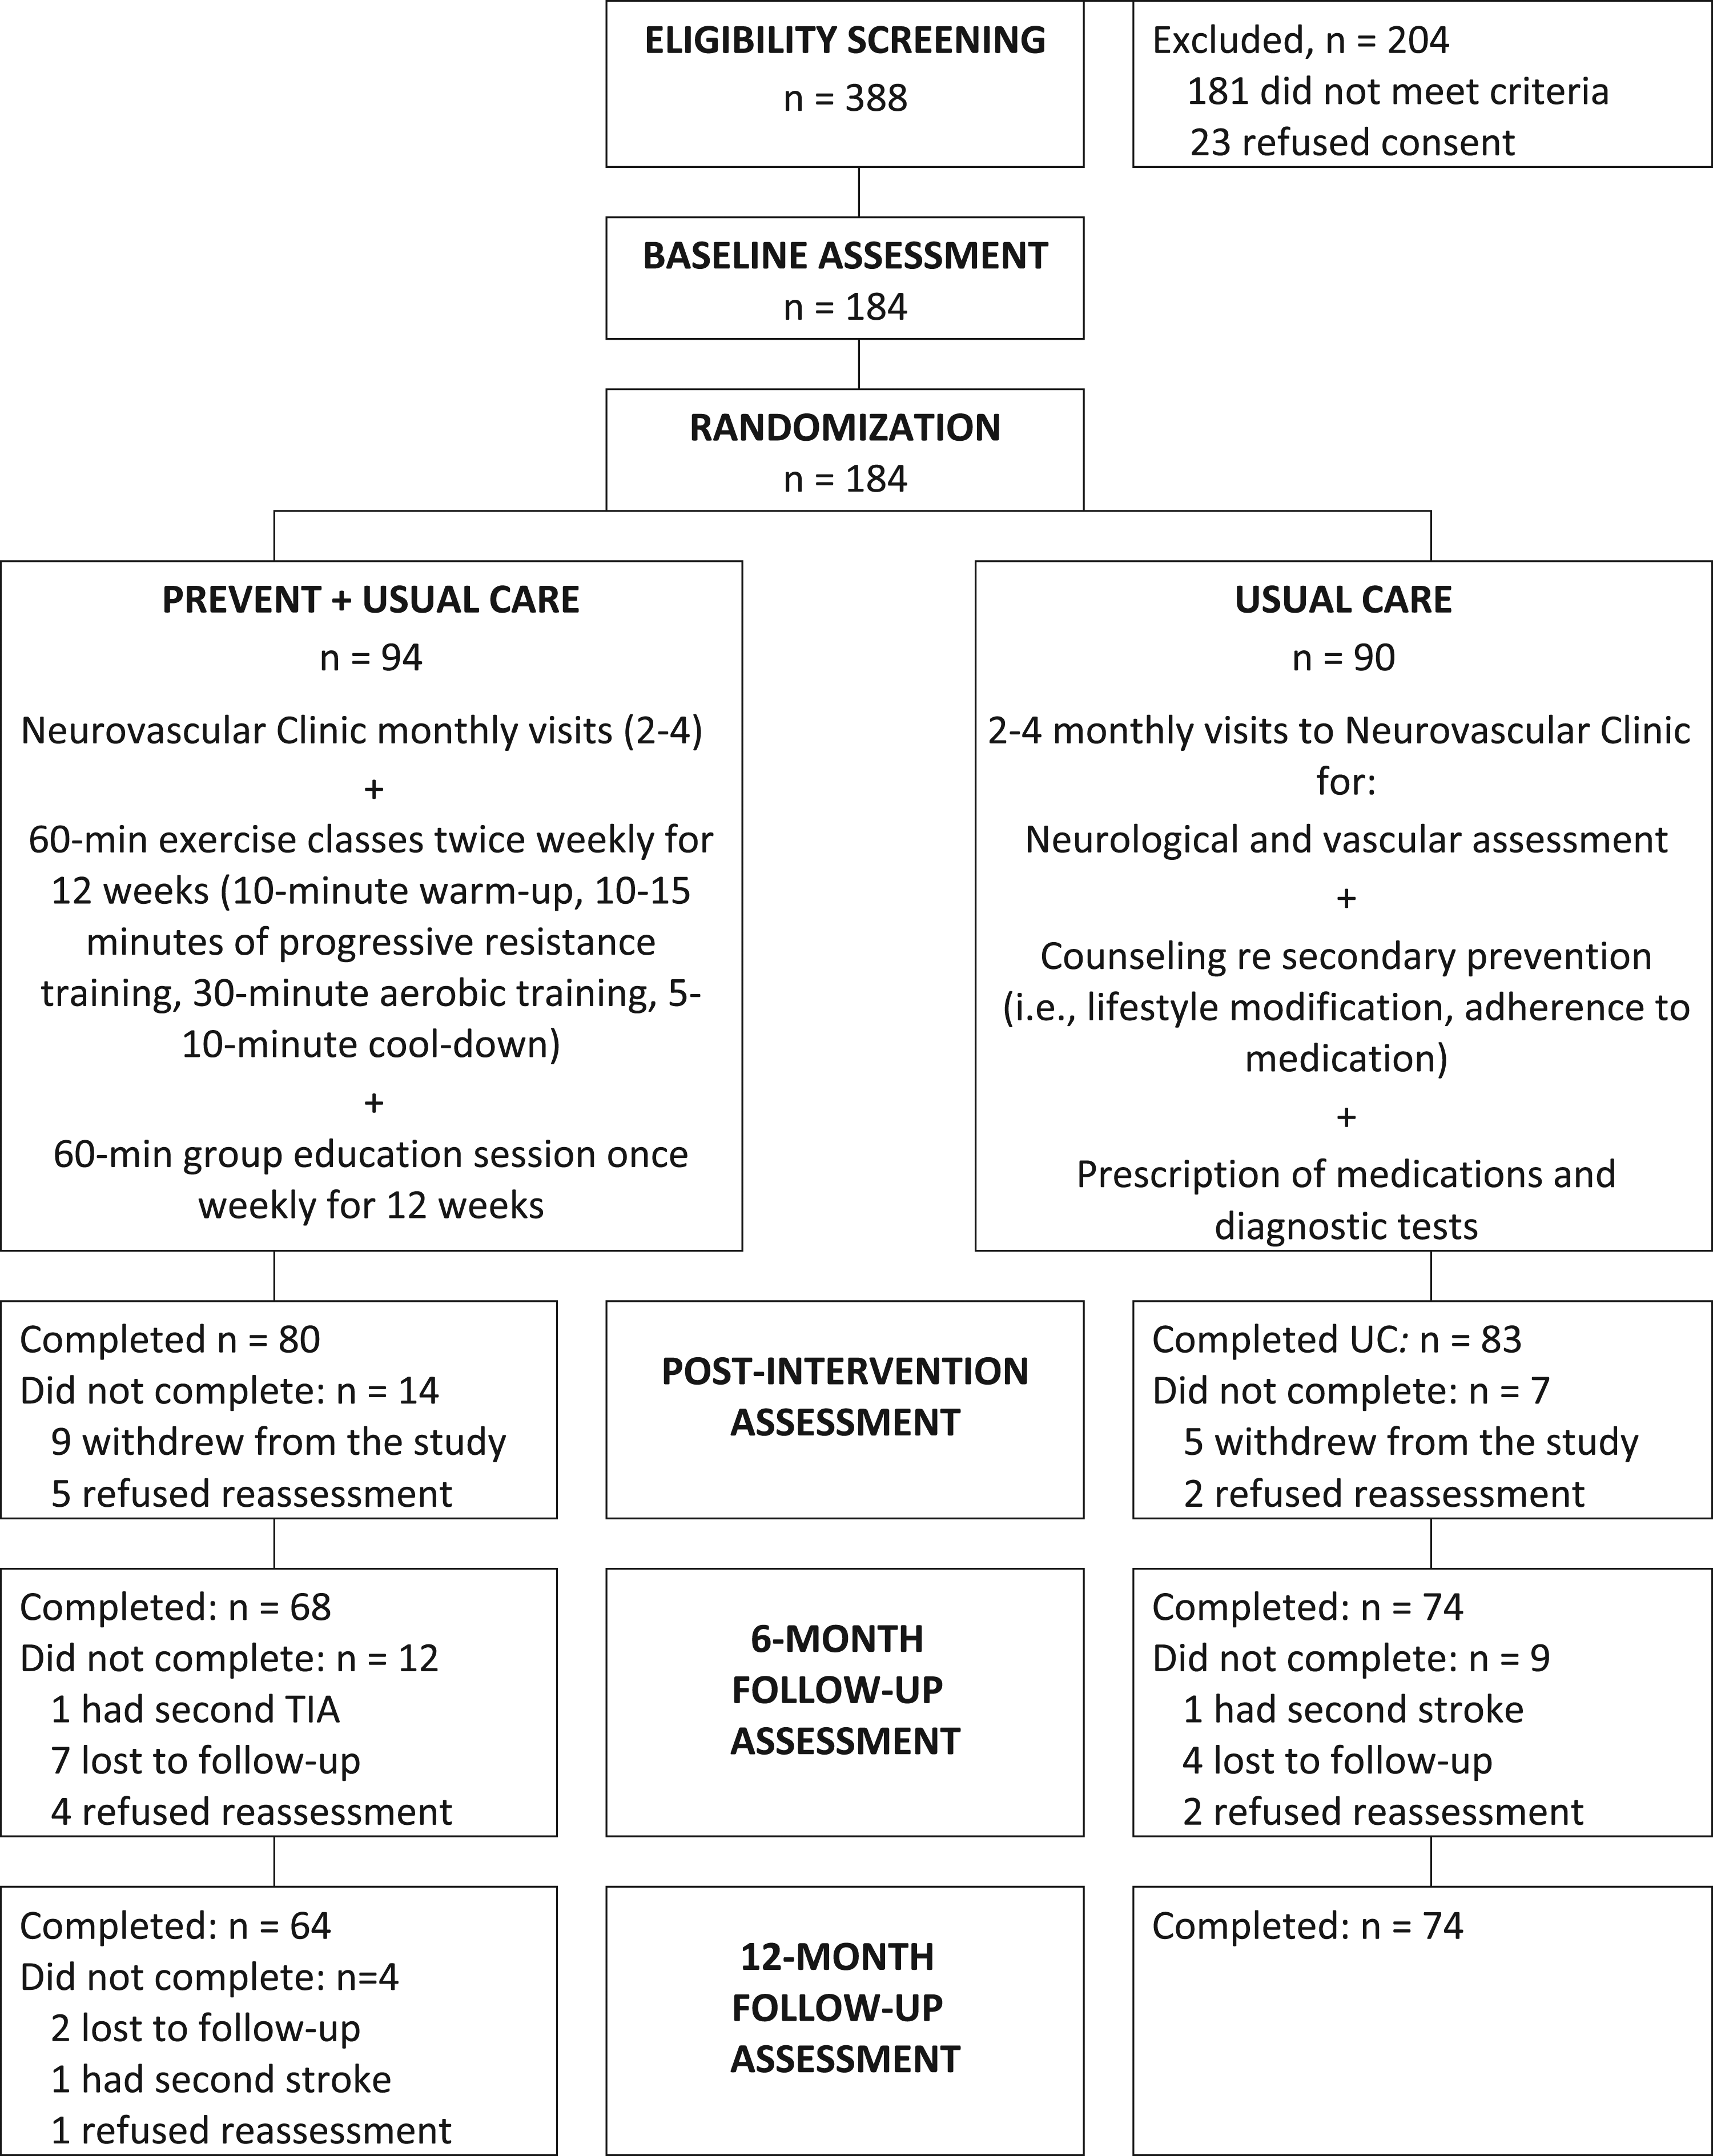
The assessment protocol required an average of 2.25 h including rest intervals and was well tolerated. The blinded assessor’s guesses of group assignment were no better than chance, with the correct guess made 58% at the post-test (P = .29), 54% cases at the 6-month follow-up (P = .64), and 55% of cases at the 12-month follow-up (P = .54). No adverse events occurred during or following the cardiopulmonary stress tests. The regular ramp protocol was used in 65% of stress tests, slow ramp in 19% and fast ramp in 16%. All participants reached volitional exhaustion during GXTs, attaining an average of 93.5% (SD = 9.8) of age-predicted maximum heart rate and a peak respiratory exchange ratio of 1.18 (SD = .11). Target heart rates of 60–80% of baseline VO2peak were achieved during the majority of the exercise sessions, with the percentage of age-predicted maximal heart rate progressing over time—from a mean of 72% (SD = 9.8) in Week 1 to 75% (SD = 13.1) in Week 2, and 79% (SD = 11.0) in Week 11. However, the duration over which the target intensities was sustained during each exercise session was not documented.
Fourteen (7.6%) participants (9 PREVENT and 5 UC) withdrew from the trial during the intervention period. Among those who completed the PREVENT program, 77 (96%) attended >75% of the sessions. Five PREVENT and 2 UC participants did not return for the post-intervention assessment. Total attrition over the course of the study was 25%, exceeding our anticipated attrition (10%) and that of another trial with a similar design (15%). 26 Participants cited excessive time commitments as the main reason for terminating participation. There were no reports of adverse events (e.g., falls or other injuries, chest pain or other cardiac related symptoms, and intolerance to the training) during the intervention period. In the follow-up period one PREVENT group participant had a second TIA and another had a second stoke, and one UC group participant had a second stroke.
Outcome Assessment
Results of the intention-to-treat analyses are reported. No differences in the results were found using per protocol analyses. As well, planned subgroup analyses comparing outcomes of adherers vs non-adherers in the PREVENT group did not reveal any differences (data not shown).
Primary Outcome: Systolic Blood Pressure
Cardiovascular Risk Factors at Baseline, Post-Training, 6-Month and 12-Month Follow-up.
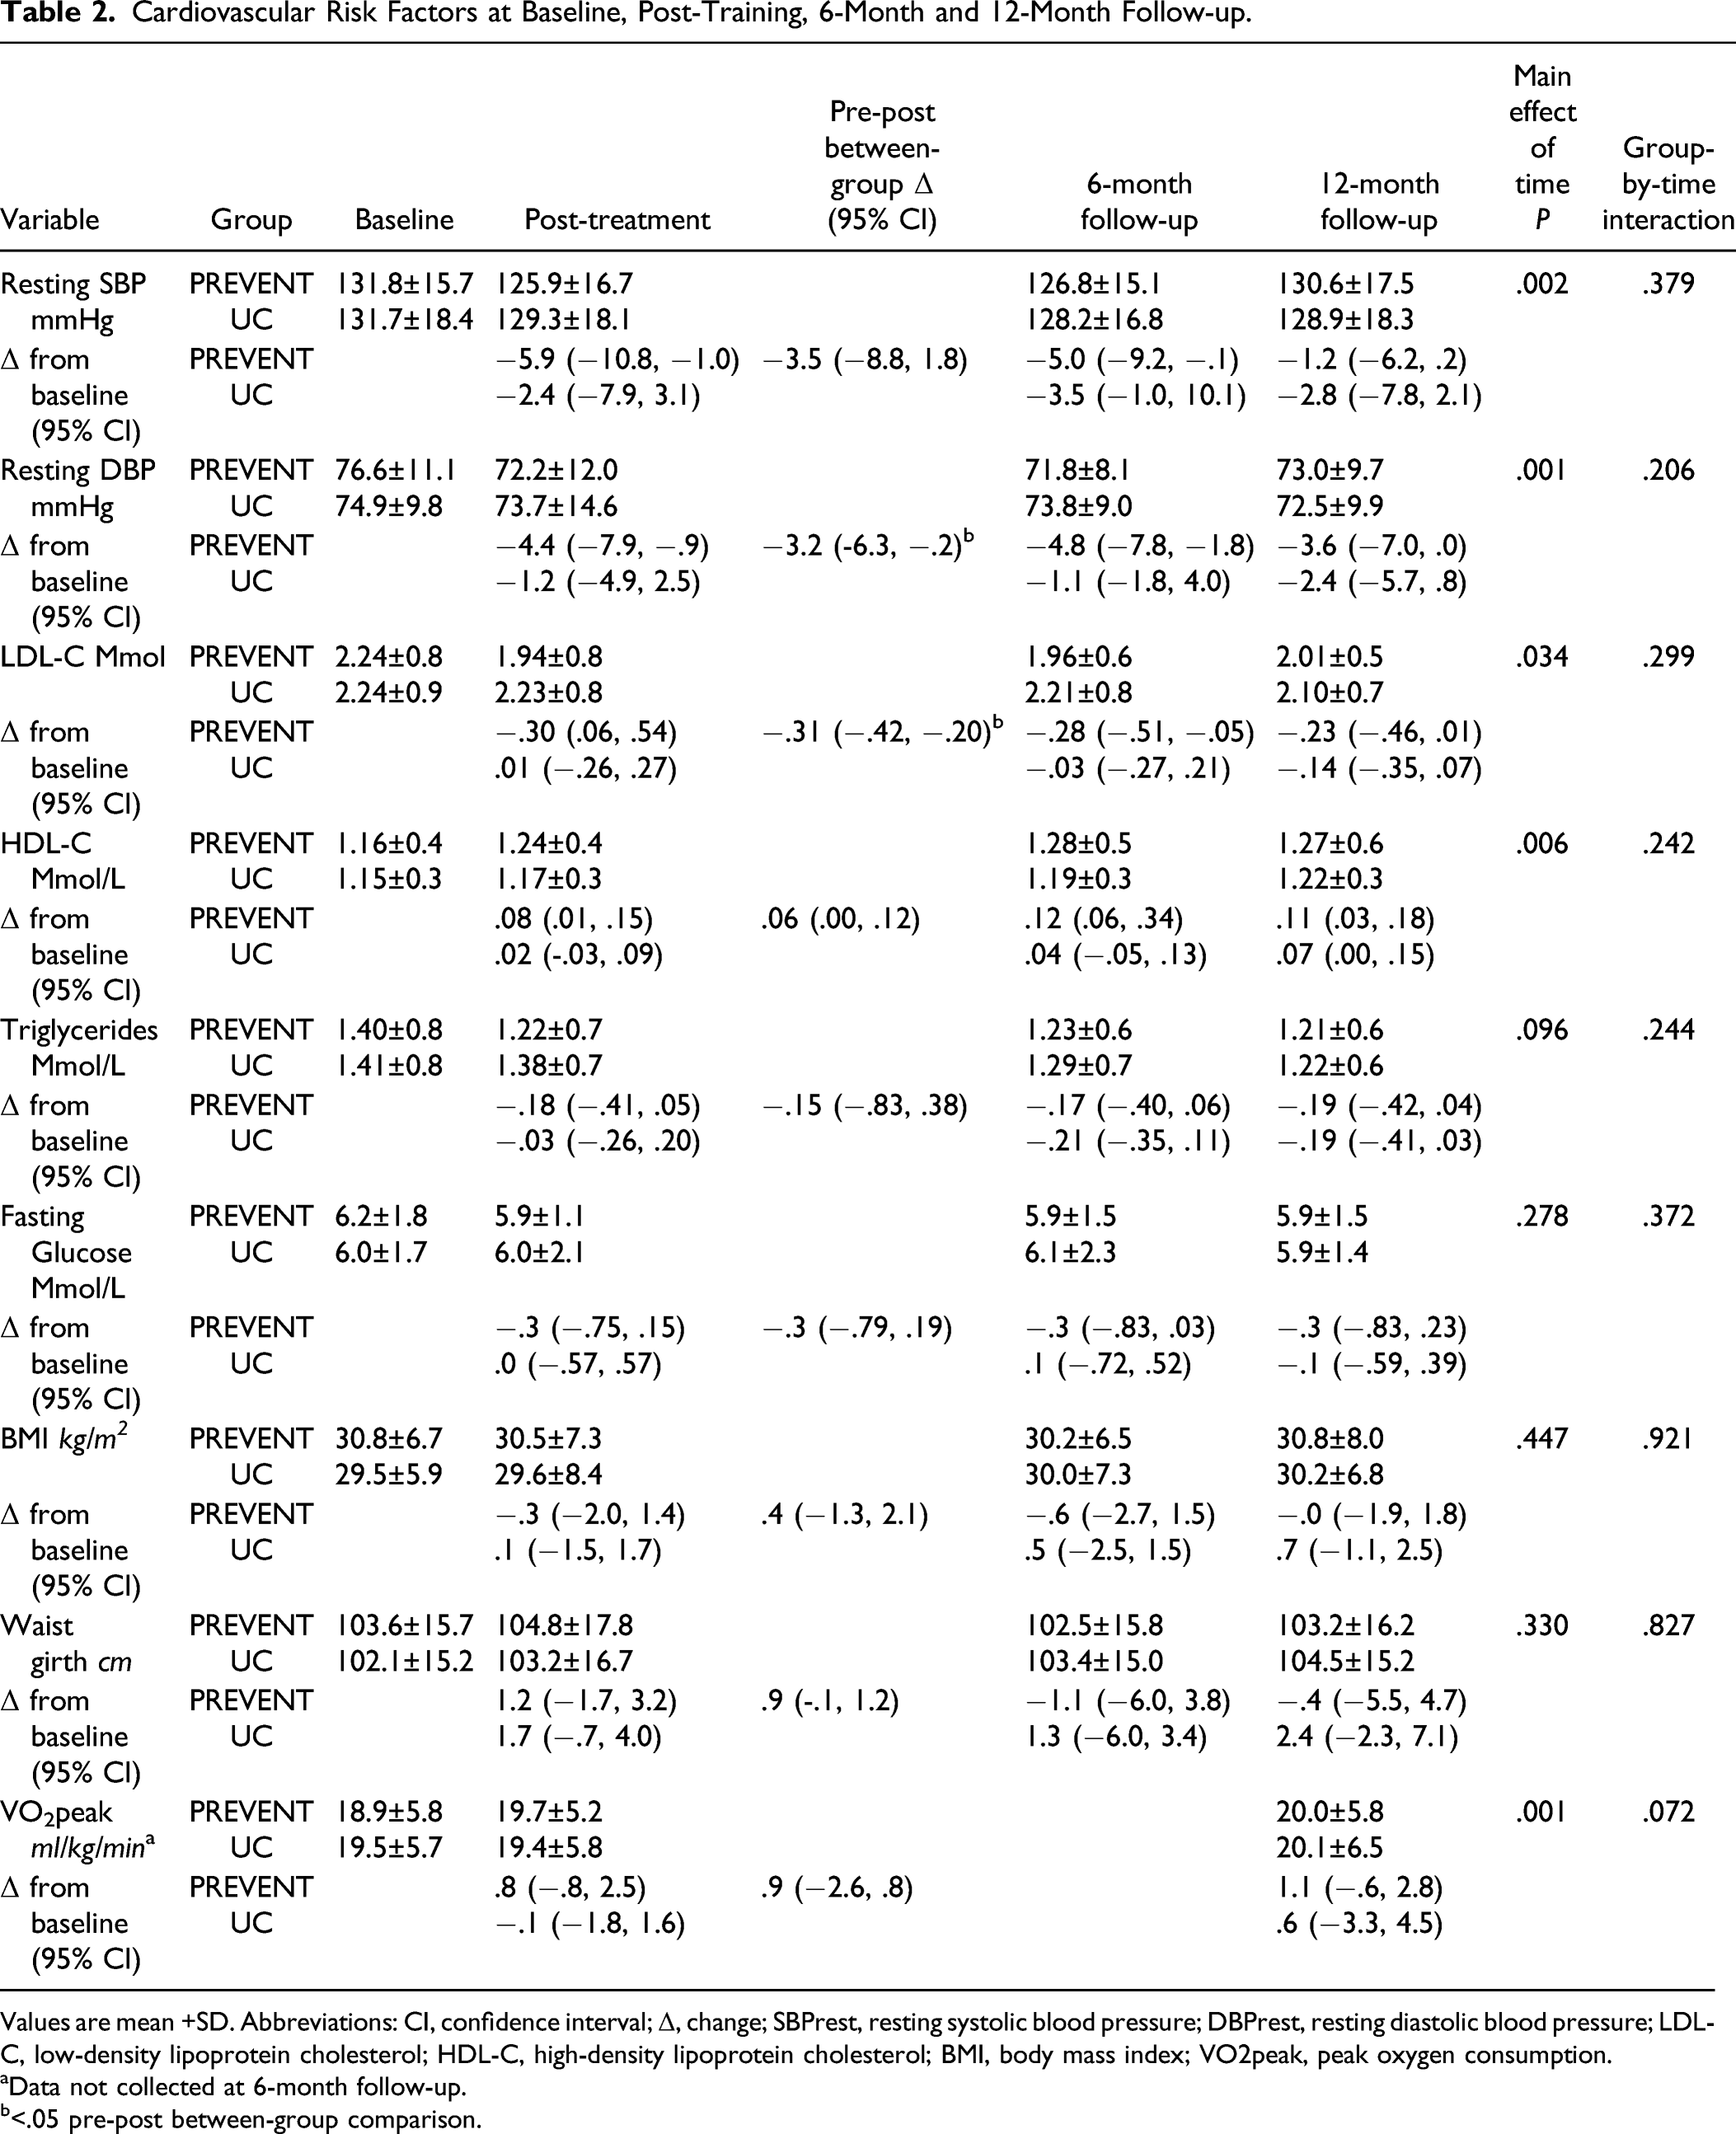
Values are mean +SD. Abbreviations: CI, confidence interval; Δ, change; SBPrest, resting systolic blood pressure; DBPrest, resting diastolic blood pressure; LDL-C, low-density lipoprotein cholesterol; HDL-C, high-density lipoprotein cholesterol; BMI, body mass index; VO2peak, peak oxygen consumption.
aData not collected at 6-month follow-up.
b<.05 pre-post between-group comparison.
Secondary Variables: Other Vascular Risk Factors
Baseline values for total cholesterol (PREVENT, 4.0 ± .9; UC: 4.0 ± 1.1, P = .73) and total cholesterol: HDL (PREVENT, 3.5 ± 1.0, UC; 3.7 ± 1.3, P = .23) were within the normative range in both groups and did not change over the course of the study (data not shown). Pre-post differences in DBPrest and LDL of the PREVENT group were significantly greater compared to the UC group (P = .04, see Table 2). ANOVA revealed no significant group-by-time interactions but significant main effects of time for DBPrest (P = .001), HDL (P = .006), and LDL (P = .34). With the exception of BMI, waist girth, and, notably VO2peak, there were trends of improvement in vascular risk factors from baseline to 6-month follow-up for both groups.
Tertiary Outcomes: Patient-Reported Psychosocial Variables
Tertiary, patient-reported outcomes at baseline, post-training, 6-month and 12-month follow-up.
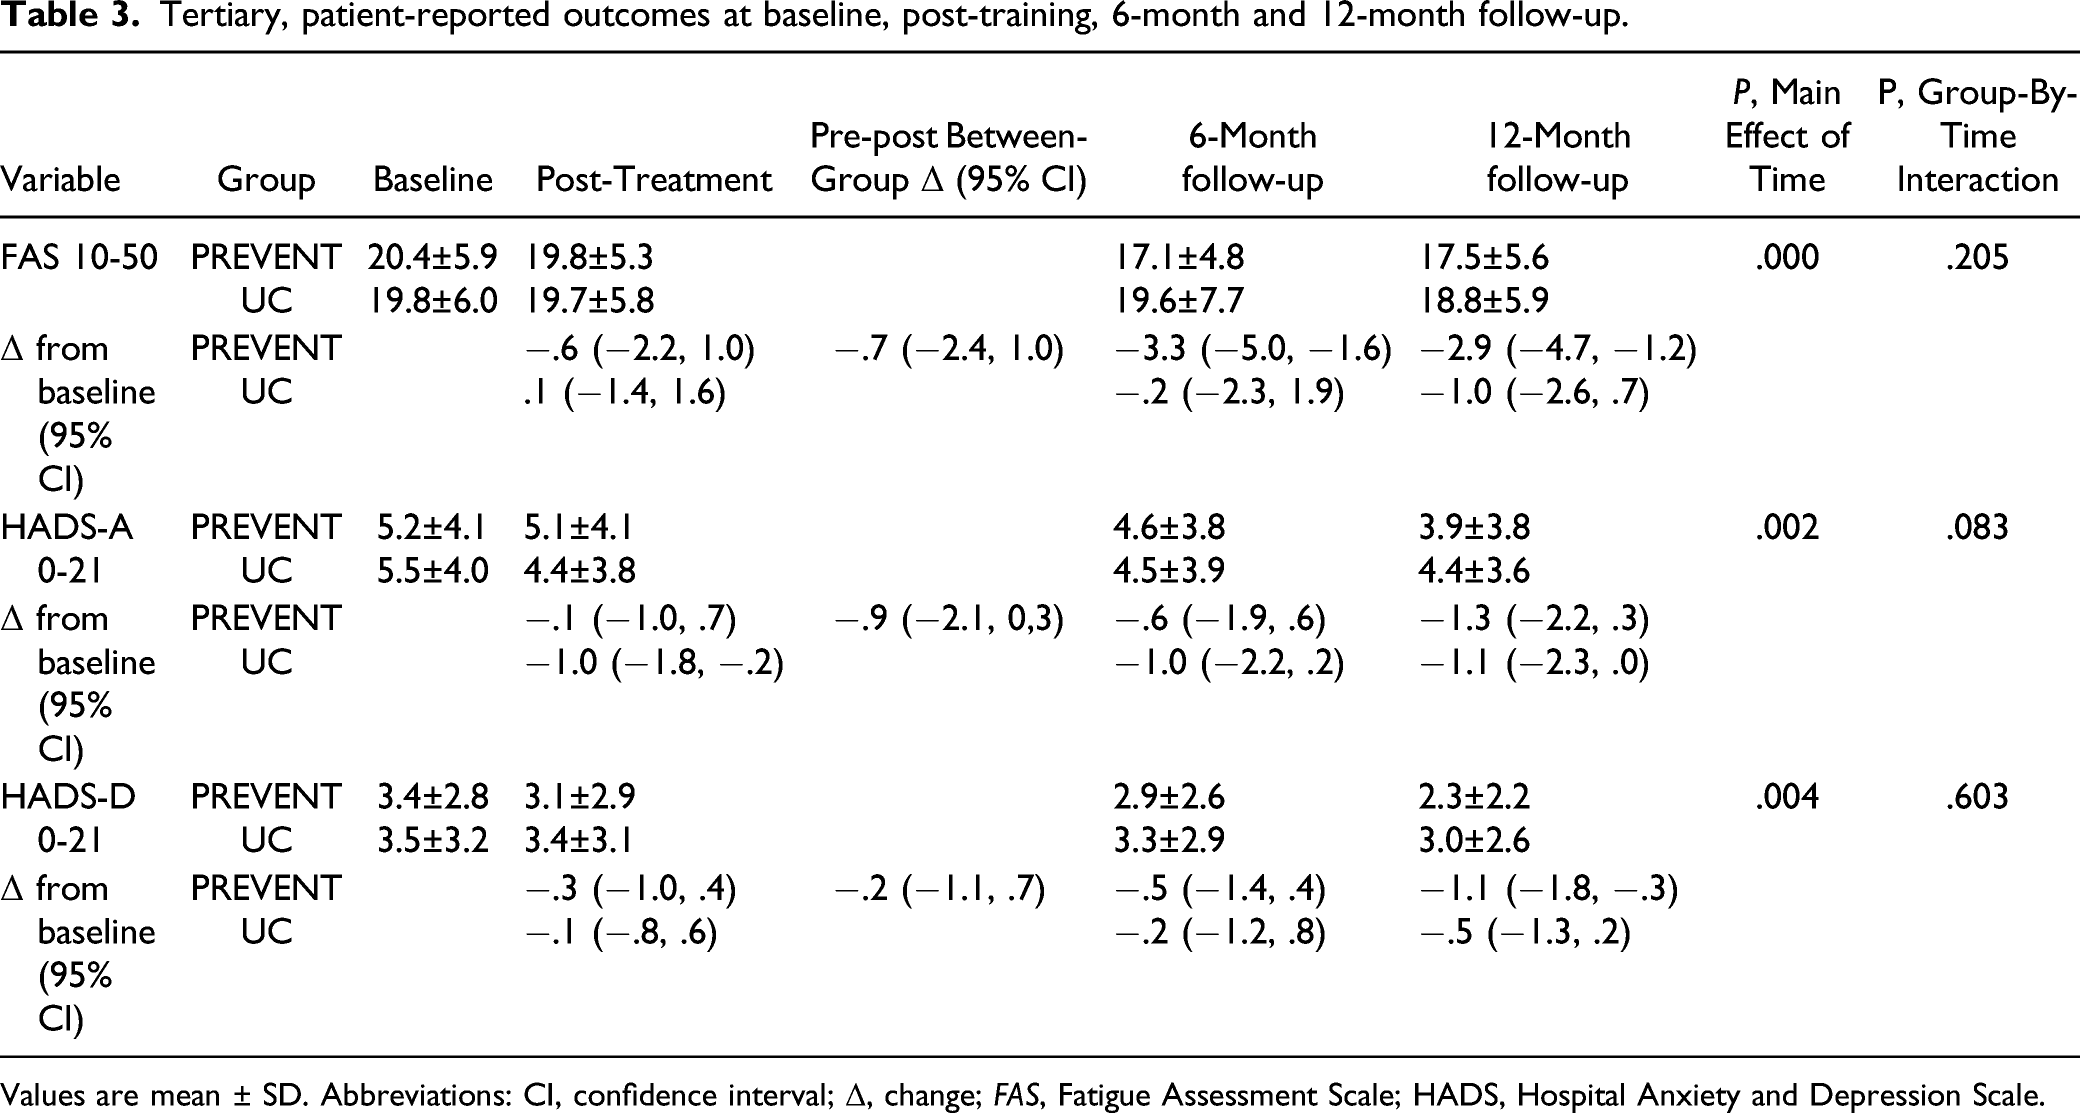
Values are mean ± SD. Abbreviations: CI, confidence interval; Δ, change; FAS, Fatigue Assessment Scale; HADS, Hospital Anxiety and Depression Scale.
Discussion
The primary hypothesis of superiority of the PREVENT intervention of exercise and education over UC for short-term improvement of SBPrest post NDS/TIA was not supported. This finding is counter to meta-analytic evidence of significant decrease in SBPrest following stroke or TIA following structured exercise programs, with greater reduction when exercise was supplemented with behavioral interventions such as education.21,22 A previous trial with a multi-component approach that was initiated 2 weeks post-onset of TIA or NDS and involved participants similar in profile to the PREVENT participants reported an almost 3-fold greater reduction in mean SBPrest compared to our study (mean difference [MD]: −9.8 mmHg; 95% CI = −17.1, 2.53 vs −3.5 mmHg; 95% CI = −8.8, 1.8). 43 Later initiation of the PREVENT program (mean of 2.3 months vs 2 weeks post-onset of TIA or NDS 43 ) may partially account for our more modest response, given that time interval between stroke onset and therapy is predictive of the impact of exercise after stroke. 44 In fact, Faulkner and colleagues 43 postulated that a critical window might exist for an effective training response early post-stroke.
Another factor that likely contributed to the disparity between our results and those of Faulkner and colleagues 43 was better control of SBPrest in the PREVENT participants at baseline (131.8 ± 15.7 vs 140.0 ± 14.3 mmHg). Although aerobic training has been shown to reduce SBPrest in both normotensive and hypertensive individuals, the magnitude of effect is greater with higher baseline values. 45 Further investigation is necessary to determine if UC alone is adequate for patients after TIA or NDS who have reasonable control of SBPrest and other risk factors.
Reduction in DBPrest following non-cardioembolic stroke is associated with a significantly lower risk of recurrent stroke and other major vascular events. 46 Thus, despite mean DBPrest at baseline in the normative range for both groups, 46 the finding of a significant pre-post, between-group difference in DBPrest in favor of the PREVENT group (MD: 3.2 mmHg; 95% CI −6.3, −2.0) may be of clinical significance for secondary stroke prevention. As with SBPrest, evidence is contradictory regarding the effect of exercise on DBPrest post-stroke—the conclusion of one meta-analysis reflected our finding (MD: −2.6 mmHg; 95% CI −4.7, −.5)22 whereas another did not (MD: −2.3 mmHg; 95% CI −4.7, .2). 21
Although lowering LDL-C is another recognized strategy for mitigating the risk of recurrent stroke, only one previous exercise trial reported a significant reduction in LDL. 12 The significant pre-post between-group difference found in LDL-C in our study (MD: −.31 mmol/L; 95% CI −.42, −.20) exceeded that reported in the meta-analysis by D’Isabella and colleagues 21 (MD: −.19 mmol/L; 95% CI −.88, .50). Although there is uncertainty about clinical benefit of the magnitude of change in LDL-C in our trial, a reduction of 1 mmol/L has been associated with as much as a 20% decrease in 5-year risk of major vascular events, including ischemic stroke. 47 Further, LDL-C therapeutic targets for secondary stroke risk reduction have not been established definitively; 21 in one exercise trial involving people after recent mild stroke, the goal of attaining LDL-C values <2.59 mmol/L exceeded mean baseline LDL-C values in our study. 28
HDL-C has been regarded as the lipid most improved through exercise, 48 but increases tend to be modest (mean net change of .07 mmol/L). 49 The pre-post difference within the PREVENT group had a similar magnitude of change (.08 mmol/L) but the mean between-group difference did not reach statistical significance. This neutral finding is supported by one stroke-specific meta-analysis 22 but not another. 21 Various factors influence the extent HDL-C improvements with exercise. In the systematic review by Kodama et al. 49 significant increases in HDL-C were associated with exercise duration of ≥120 min per week, baseline total cholesterol level ≥5.7 mmol/L, and BMI <28. 49 Only the first condition was met in the PREVENT group—weekly duration of structured exercise was 120 min, whereas mean baseline total cholesterol was 4.0 mmol/L, and mean BMI exceeded 30.
The secondary hypothesis of superiority of the PREVENT intervention over UC in long-term retention of SBPrest post NDS/TIA was not supported. Both groups showed trends of improvement in SBPrest over baseline at 6-month follow-up, which dissipated by the 12-month follow-up. Similar patterns were observed for DBPrest, HDL-C, and HDL-C in the PREVENT group only. Exercise adherence, which is regarded as an essential aspect of exercise-induced blood pressure management programs, 50 may help to explain the observed regression towards baseline values. Although participation was relatively high during delivery of the PREVENT program, the extent of adherence in the post-intervention period is unknown because long-term participation in exercise was not tracked. Whelton et al 50 noted less marked reduction in blood pressure in studies with longer follow-up periods, probably because commitment to exercise tends to wane over time.
Lack of change in other vascular risk factors (total cholesterol, ratio of total cholesterol to HDL-C, triglycerides, 12-h fasting glucose, BMI, and waist girth) in both PREVENT and UC groups over the course of the study is in keeping with findings of most exercise trials involving people post-stroke or TIA.21,22, Exceptions include a decrease in total cholesterol following an 8-week exercise and education program after mild stroke or TIA, 43 and exercise-related reductions in BMI post-TIA between post-intervention and 12-month follow-up. 26
Surprisingly, only one previous exercise trial on secondary stroke prevention after mild stroke and TIA 28 was cited that assessed VO2peak—the definitive index of exercise capacity for deconditioned or elderly individuals. 51 Our finding of a lack of a significant gain in post-intervention VO2peak in the PREVENT group vs UC group (overall gains of 4.2% vs −.5%, respectively) aligns with the results of the other study. 28 The finding is difficult to explain—in numerous stroke trials we and others have demonstrated robust exercise-elicited changes in VO2peak using similar training protocols. 23 One factor that might have contributed was the high proportion (70%) of PREVENT participants who were overweight or obese; non-stroke participants in a previous aerobic exercise trial with a range of BMI of 28-40 kg/m2 experienced very modest improvements in VO2max (mean of 5.8%). 52
Another factor may have played a role in the lack of significant improvement in VO2peak - the challenge in a group exercise format of ensuring that training is performed at the prescribed intensity consistently throughout the session. In both the PREVENT and the above-mentioned study by Boss et al. 28 the therapist-participant ratio was as high as 1:5. Although this ratio is within the standard for cardiac rehabilitation programs, it is conceivable that the participants’ level of effort waned when not directly supervised. In a recent community-based exercise trial of ambulatory people post-stroke, participants struggled to achieve and sustain the prescribed dose of exercise. 53 Issues underlying this problem were not explored by the investigators but previously reported personal barriers to exercise post-stroke, including lack of motivation to exercise, health concerns (e.g., fatigue and depression), and motor impairments, may have been contributing factors. 54 The importance of exercise dose to exercise-related outcomes is well documented in older adults 55 (e.g., a robust dose–response relationship is often observed between intensity of aerobic exercise and HDL-C levels 56 ). Yet the systematic reviews on the effects of exercise on cardiovascular risk factors after stroke did not take into account the exercise intensities used in the trials reviewed.20-22 Underdosing during PREVENT exercise sessions may have contributed to lack of change in VO2peak as well as other neutral results of this trial.
Despite the lack of change in exercise capacity in our study, improvements were found in both DBPrest and LDL-C in the PREVENT group compared to the UC group at post-intervention, possibly because of the dual impact of exercise and education on these specific variables. Similarly, in the above-mentioned secondary stroke prevention study by Boss and colleagues, 28 in which there was not a significant improvement in VO2peak, significantly more participants in exercise group achieved the composite endpoint of optimal medical therapy (i.e., blood pressure of <140/90 mmHg) and LDL-c of <100 mg/dL).
In accordance with previous exercise trials post NDS and TIA,57,58 we did not observe statistically significant between-groups differences in HAD-A and HAD-D. Baseline values for anxiety and depression as well as fatigue (FAS) were below established symptom thresholds for stroke population,59,60 thus diminishing the potential for modification. As well, a meta-analysis showed that extent of exercise-induced change in depressive symptoms after stroke is related to the training intensity. 61 Encouraging, however, were trends of reductions in all three patient-reported outcomes in the PREVENT group over the course of the study, and the fact the mean reduction in the FAS score of the PREVENT group between baseline and 6- and 12-month follow-ups exceeded the minimal clinically important difference of 1.7. 62
tStrengths of this trial include using rural and urban community settings for the exercise program to enhance “real-world” validity of the study; measuring, rather than estimating, VO2 peak; and tracking progress for 12 months post-intervention. The study was not powered to detect change in hard clinical outcomes (i.e., recurrent TIA, stroke, cardiac events, and death) and the targeted sample size was not attained. Nonetheless, the study was the largest exercise trial to date on risk factor reduction for secondary stroke prevention. Other limitations included unequal exposure to intervention of experimental and control groups, lack of use of participant logs to record daily physical activity during and after intervention, absence of structured participant feedback regarding the exercise and education programs, and lack of follow-up in the post-intervention period to monitor adherence to physical activity. Further, since the PREVENT trial involved a combined therapeutic approach, it was not possible to establish whether observed changes were attributable to exercise or education or both.
Conclusion
The impact of this largely neutral trial on exercise-induced vascular risk factor reduction for secondary stroke prevention was more modest than we had anticipated, given the known potency of exercise as a physiological stimulus. The significant between-group differences found in DBPrest and LDL-C at post-intervention, in favor of the PREVENT group, were not sustained at follow-up. The PREVENT group more often demonstrated trends of improvement in SBPrest, HDL-C and FAS than controls. Several risk factors approximated normative values at baseline, thus limiting the potential for impact. Also, a blunted fitness training effect suggests that the exercise intensity may have been sub-optimal. Further study is warranted that incorporates selection of participants within the first month after TIA or NSD who have baseline vascular risk factors outside the normative range, baseline assessment of personal barriers to exercise, participant-specific targets for risk factor improvement, and close monitoring of exercise intensity to determine if a program of exercise and education is a viable adjunct to pharmaceutical management of cardiovascular risk factors after TIA or NSD.
Footnotes
Declaration of Conflicting Interests
The authors declared no potential conflicts of interest with respect to the research, authorship, and/or publication of this article.
Funding
The authors disclosed receipt of the following financial support for the research, authorship, and/or publication of this article: This study was jointly funded by the Canadian Institute of Health Research and the Heart and Stroke Foundation of Canada.