
Abstract
Background
Considerable evidence indicates that the functional connectome of the healthy human brain is highly stable, analogous to a fingerprint.
Objective
We investigated the stability of functional connectivity across tasks and sessions in a cohort of individuals with chronic stroke using a supervised machine learning approach.
Methods
Twelve individuals with chronic stroke underwent functional magnetic resonance imaging (fMRI) seven times over 18 weeks. The middle 6 weeks consisted of intensive aphasia therapy. We collected fMRI data during rest and performance of 2 tasks. We calculated functional connectivity metrics for each imaging run, then applied a support vector machine to classify data on the basis of participant, task, and time point (pre- or posttherapy). Permutation testing established statistical significance.
Results
Whole brain functional connectivity matrices could be classified at levels significantly greater than chance on the basis of participant (87.1% accuracy; P < .0001), task (68.1% accuracy; P = .002), and time point (72.1% accuracy; P = .015). All significant effects were reproduced using only the contralesional right hemisphere; the left hemisphere revealed significant effects for participant and task, but not time point. Resting state data could also be used to classify task-based data according to subject (66.0%; P < .0001). While the strongest posttherapy changes occurred among regions outside putative language networks, connections with traditional language-associated regions were significantly more positively correlated with behavioral outcome measures, and other regions had more negative correlations and intrahemispheric connections.
Conclusions
Findings suggest the profound importance of considering interindividual variability when interpreting mechanisms of recovery in studies of functional connectivity in stroke.
Keywords
Introduction
The brain is a complex, dynamic organ comprising many interconnected networks that reconfigure over time 1 and in accordance with task demands.2,3 Despite this fact, which underlies learning 4 and development, 5 there are strong individual differences in functional connectivity sometimes described as a “functional connectome fingerprint.” 6 Healthy adults can reliably be identified across different sessions of resting state and task-based functional magnetic resonance imaging (fMRI) as well as across performance of distinct tasks.6-10 To our knowledge, this trait stability has not been explored in individuals with neurological injury.
The correspondence of functional architecture across task and rest in the healthy brain suggests that neural networks are consistently engaged and interacting, even when not currently being called upon to perform a specific action or cognitive exercise. Resting state brain connectivity can be used to accurately predict activation patterns obtained during tasks on an individual basis. 7 With regard to cognitive functions following stroke, this suggests that findings during resting state may be informative about the configuration of brain networks supporting task performance, elucidating network pathology and patterns of plasticity associated with behavioral improvement. 11 Previous work suggests that gross topological network organization s adequately maintained after stroke to permit identification of networks present in healthy adults.12,13 Given that clinical studies employing healthy controls often seek to identify differences with patient populations, the co-occurring and potentially confounding phenomena of individual heterogeneity (as demonstrated in healthy controls)—in the context of at least some network similarity between patients and controls—suggests that trait distinctions bear further examination in the stroke population.
Despite the existence of unique individual patterns, previous studies also indicate that functional connectivity metrics can be used to identify which tasks a healthy participant is performing by comparison to others performing the same set of tasks.6,10 Thus, strong contributions of trait notwithstanding, effects of state still measurably contribute to the variance of these data in a discernible manner.
Yet in studies of rehabilitation and recovery, we often seek to identify patterns across a group of patients—and sometimes a set of tasks—associated with participation in, or benefit following, a treatment program. In view of the strong effects of trait and state reported in healthy individuals, it could be that we are at a relative disadvantage for detecting these corollaries of experience. While many robust and laudable studies have identified meaningful and informative changes associated with treatment and recovery, such studies are typically hypothesis driven rather than data driven and rely on narrow contrasts between specific conditions, instead of focusing on large-scale neurological reorganization. Thus, it remains an open question whether, and how, brain networks predictably change across participants and tasks to reflect the effects of a therapeutic experience.
In this work, we explored the stability of functional connectivity across tasks and sessions in individuals with post-stroke language impairments (aphasia) participating in an intensive therapy program. We further investigated whether common patterns could reliably separate pre- and posttherapy connectivity measures.
We hypothesized that, following stroke, the brain’s functional connectivity would (1) maintain the strong individual differences reported in healthy adults (ie, unique traits), evinced in stability over time and identifiable patterns across tasks and rest. We further hypothesized that (2) across individuals, functional connectivity matrices would manifest similar (predictable) task-dependent network properties (ie, commonalities of state), and that (3) these functional correlations would show systematic patterns reliably distinguishing pre- from posttherapy networks (ie, effects of experience).
We used machine learning to test these 3 hypotheses. In particular, we aimed to classify the functional connectivity matrices by participant, task, and time (pre- vs posttherapy) in 12 individuals with left hemisphere ischemic stroke and aphasia. Our primary objectives were to determine whether we could identify inter-individual, task-dependent, and/or therapy- (or at least time-) induced differences.
Methods
Participants
Twelve right-handed native English speakers with chronic aphasia following single left hemisphere ischemic stroke, confirmed by neurological examination and MRI, participated in the study (mean ± SD age = 51.33 ± 12.11 years; 3 female). All participants sustained a single stroke 7 to 124 months prior to enrollment (mean = 40.33 ± 42.55 months). Additional individual data are reported in Table 1, and lesion overlap can be seen in Supplemental Figure 1. Participants were selected from a superset of nineteen individuals who completed an 18-week study that included 6 weeks of intensive imitation-based therapy. Inclusion criteria for the present analysis are fully outlined in Supplemental Material; in brief, participants were required to have data acquired using the same MRI scanner and to have ≥7 imaging runs with ≥4 minutes of usable data per scan (ie, without motion artifact) to permit confident use of the machine learning classifier (support vector machine). Behavioral and imaging results of the treatment study have been reported previously.13-17 The study was approved by the institutional ethics committees (institutional review boards) at The University of Chicago and the University of California, Irvine, where the research was conducted. Written informed consent was obtained according to the Declaration of Helsinki.
Participant Data. a
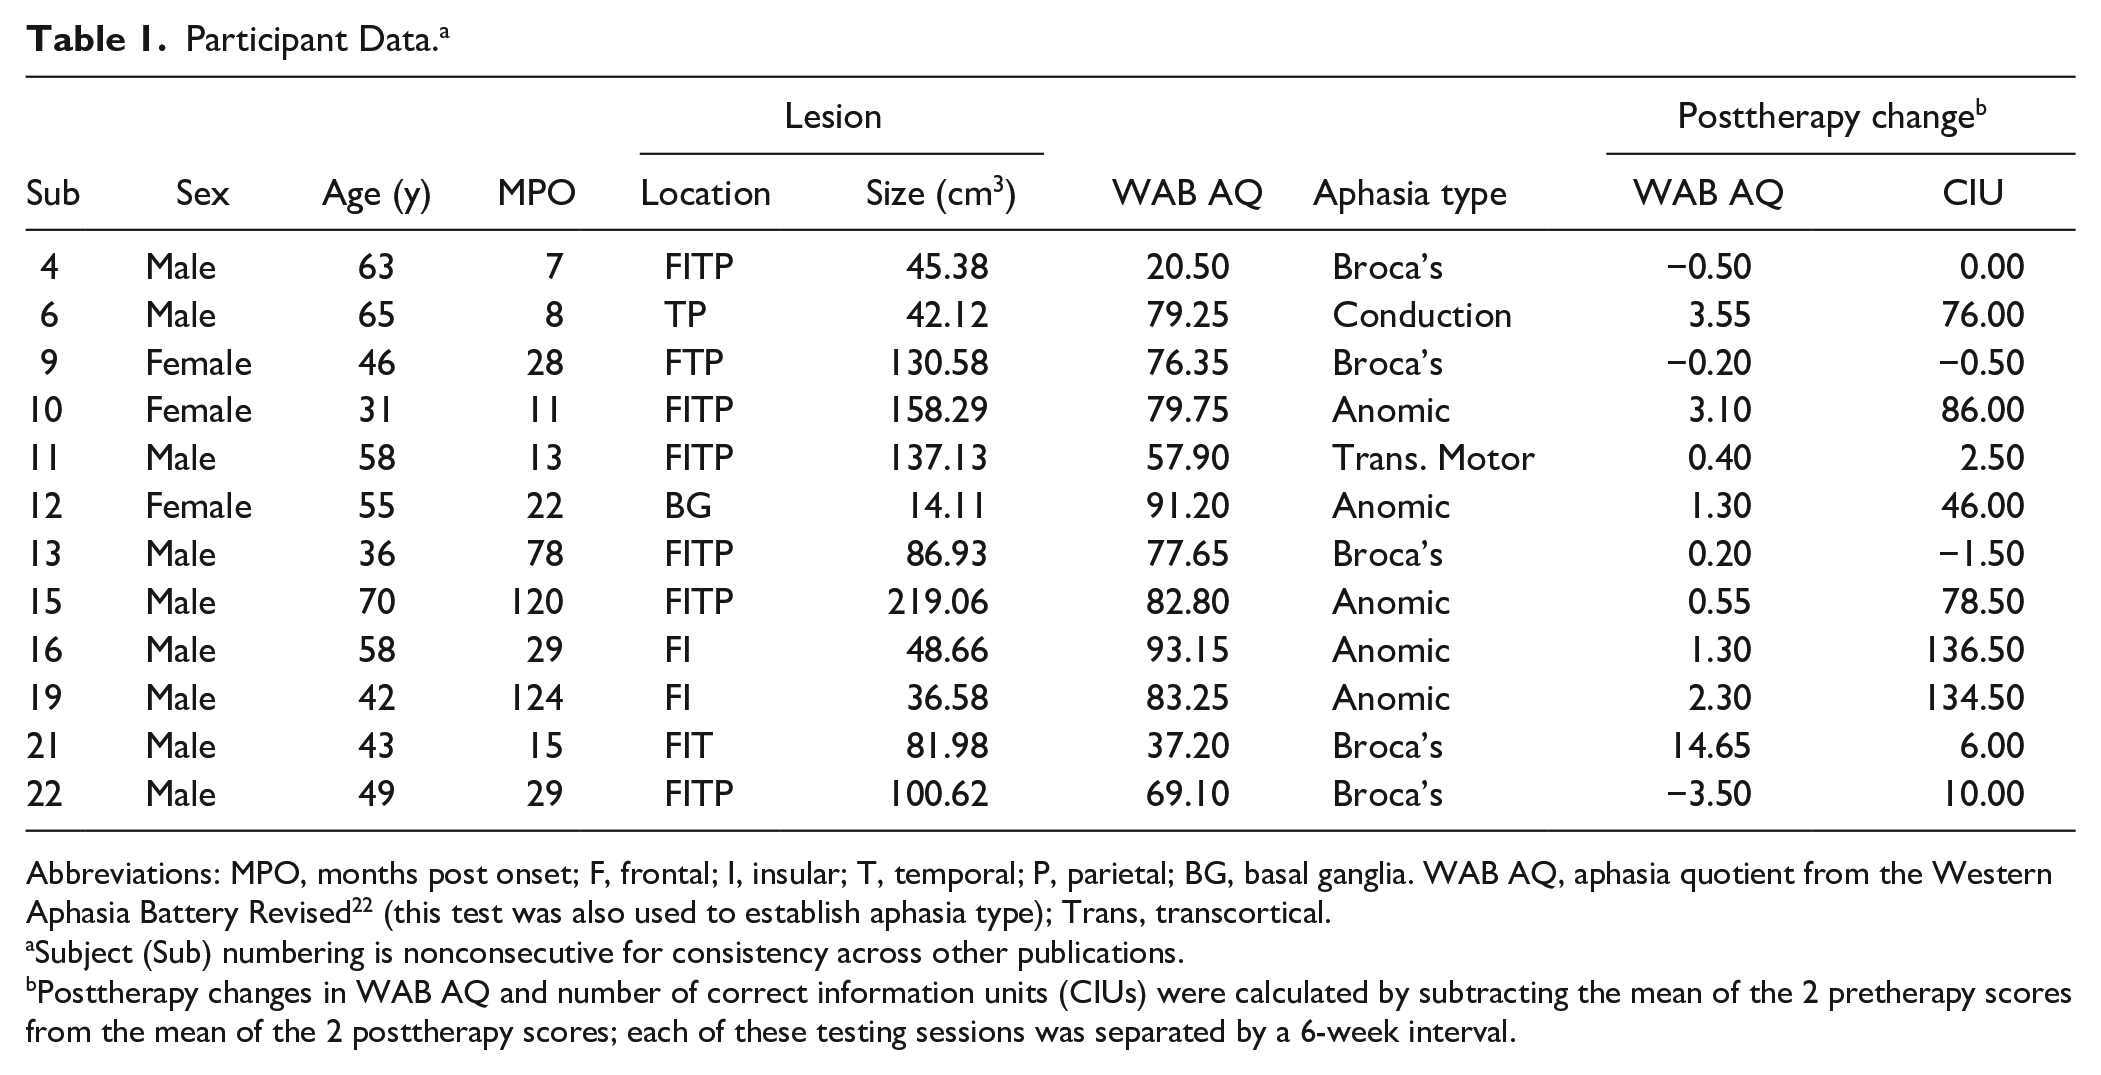
Abbreviations: MPO, months post onset; F, frontal; I, insular; T, temporal; P, parietal; BG, basal ganglia. WAB AQ, aphasia quotient from the Western Aphasia Battery Revised 22 (this test was also used to establish aphasia type); Trans, transcortical.
Subject (Sub) numbering is nonconsecutive for consistency across other publications.
Posttherapy changes in WAB AQ and number of correct information units (CIUs) were calculated by subtracting the mean of the 2 pretherapy scores from the mean of the 2 posttherapy scores; each of these testing sessions was separated by a 6-week interval.
Treatment
Treatment consisted of a computer-based imitation therapy performed during three 30-minute sessions 6 days per week over the course of 6 weeks (108 sessions). Participants repeated words and phrases consecutively spoken by 6 different speakers (massed practice). Level was determined by a speech-language pathologist on the basis of individual ability. Progress was evaluated weekly, with level advanced when appropriate. Higher levels included longer words, more complex phonology, more varied word classes, and longer word sequences. For additional details see Lee et al. 18
Image Acquisition
Seven structural and functional MR images were acquired at intervals of 3 weeks over an 18-week period. The first 6 weeks of this period (during which there were 3 imaging sessions) represent a pretherapy baseline during which no intervention was provided. Speech-language therapy was provided for the next 6 weeks (during which there was 1 mid-therapy imaging session). Three posttherapy scans were collected—immediately following therapy, and then 3 and 6 weeks later—comprising 7 total sessions. See Supplemental Figure 2 for timeline.
Functional data were acquired during 3 separate “runs,” including the resting state (5 minutes; 200 volumes) and during 2 active tasks, speech observation (6:30 minutes; 260 volumes) and speech imitation (12:30 minutes; 500 volumes). During rest, participants were instructed to look at a fixation cross; these scans were consistently acquired immediately following anatomical scans and prior to any active task. The speech observation and speech imitation tasks used the same video stimuli of a woman articulating 4 syllables: /pa/, /fa/, /ta/, and /θa/ (voiceless “tha”). During observation, participants were instructed to passively watch and listen to the stimuli, whereas during imitation they were instructed to repeat the syllable following each presentation. Each non-rest run contained 120 event-related jittered stimuli (equal numbers of each stimulus), with interstimulus interval ranging from 1.5 to 15 seconds for observation and from 3 to 18 for imitation.
MRI data were acquired on a Siemens 3T Trio scanner (Siemens Medical Solutions USA Inc) at the Center for Advanced Magnetic Resonance Imaging (CAMRI) of Northwestern University in Chicago. Anatomical images used a T1-MPRAGE sequence with the following parameters: sagittal acquisition, repetition time (TR) = 2300 ms, echo time (TE) = 3.36 ms, flip angle (FA) = 9°, voxel size = 1 mm isotropic. Functional acquisition for all tasks used an echo-planar imaging (EPI) sequence with the following parameters: axial acquisition, TR = 1500 ms, TE = 20 ms, FA = 71°, field of view (FOV) = 220 × 220 mm, 29 axial slices with 4 mm thickness (1 mm gap), inplane voxel size = 3.75 × 3.75 mm.
Image Analysis
Supplemental Figure 3 depicts steps of the analysis pipeline.
Preprocessing
The Analysis of Functional Neuroimages (AFNI 19 ) and Functional Magnetic Resonance Imaging of the Brain (FMRIB) Software Library (FSL 20 ) software packages were used for image analysis. Preprocessing of all functional data included slice time correction, despiking, and motion correction by registering each run to the volume with the smallest absolute deviation from its median. A Gaussian smoothing kernel of 4 mm full-width at half-maximum was applied to the functional data to increase signal-to-noise ratio, and voxel time courses were converted to percent signal change.
Anatomical T1 images, and lesion masks drawn on these, were aligned to the base volume used for motion correction for each functional run. These aligned structural images were used to extract mean functional time series for white matter, cerebrospinal fluid, and the lesion. To remove artifact from the signal, these time series data were included as nuisance regressors in a general linear model along with 6 motion regressors from the registration. Volumes with ≥3 mm or 3° of displacement and the first 4 volumes of each run were censored (removed from statistical analysis) to reduce noise and minimize artifacts. We used AFNI’s 3dTproject to apply a general linear model (removing the noise components as well as stimuli-related signal in the case of the observation and imitation runs). For each functional run, we aligned the structural imaging data to a template in standard space and then used the inverse transformation to align a standard anatomical atlas to the functional data. This permitted identification of anatomical regions in native space (ie, the space in which the fMRI data were acquired). Details of this alignment can be found in the Supplemental Material.
Functional Connectivity
Using the aligned anatomical atlas, we extracted the average time series from each of 34 cortical and 7 subcortical regions per hemisphere (82 total regions; group parcellation based on FreeSurfer Desikan-Killiany Atlas 21 ) for each of the 165 imaging runs included in the analysis (ie, for each of the 3 conditions under which data were acquired at every time point for each of the 12 subjects). We excluded voxels containing only CSF from within individual lesion masks to limit artificial reduction of signal within a region while still capturing potential hemodynamic activity in damaged brain tissue and controlling for partial volume effects. Given the coarse parcellation used (68 total cortical regions), we found no region that was completely excluded from the analysis for any participant. Each of the 165 time series was separately mean-centered; these data were then used to construct 165 unique correlation matrices. Each correlation matrix, interpreted as a connectivity graph, was reshaped as a vector of 3321 weights for unique undirected edges connecting the 82 nodes (duplicates and self-loops removed).
To reduce interindividual heterogeneity within our sample, we performed multiple linear regression using four independent variables that could impact functional connectivity measures (age, months post onset, lesion size, and aphasia severity as indicated by the Aphasia Quotient of the Western Aphasia Battery–Revised 22 ; see values in Table 1). Details are included in the Supplemental Material. Residuals from this regression (ie, data “cleaned” of the effects of these variables) were used as inputs for machine learning classification following scaling to unit variance.
We repeated this process using only the right (uninjured) or the left (injured) hemisphere. Each hemisphere included all 41 regions in each hemisphere (cortical and subcortical) connected by 820 unique undirected edges.
Machine Learning Classification
Support vector machines (SVMs) are algorithms used in machine learning. SVMs implement supervised learning, in that training is accomplished by “teaching” the machine with sample data and their correct classifications. To prevent overfitting, training is first performed on a subset of the overall data set and subsequently tested on a different subset (cross-validation). SVMs perform well in high-dimensional classification problems, such as the large number of features (edges) versus samples (scans) in our data set. 23 We performed 3 separate analyses to determine whether using only the “cleaned” whole brain functional connectivity vectors would permit accurate identification of imaging runs based on (1) trait (the participant who was scanned), (2) state (the task being performed), and (3) experience (i.e., time point; whether the scan was acquired before or after therapy). For the analysis of experience (pre- vs posttherapy), we excluded the fourth scan, which occurred in the middle of therapy, leaving 143 imaging runs. We trained an SVM using the python scikit-learn package 24 (linear kernel; regularization = 0.01) on 90% of the data (148 [trait, state] or 128 runs [experience]) and tested the accuracy of its predictive labeling of the remaining 10% 25 (17 [trait,state] or 15 runs [experience]). This process was cross-validated 10 000 times with randomized splits of the data, stratified to preserve proportional representation by class to avoid biasing the classifier or completely omitting a class for which there were fewer runs than the size of the testing set (eg, all the data for a single subject).
Separate analyses were performed using only the functional connectivity vectors derived from the right or left hemisphere as inputs to train and test the SVM classifier.
Statistical Analysis
As described, the current study was designed to compare systematic variations in functional connectivity on the basis of participant (trait), task (state), and therapeutic intervention (experience) for a sample of individuals with poststroke aphasia. We report the mean score for the 10 000 random splits of the data set for each classification performed (whole brain, right hemisphere, left hemisphere). To test the statistical significance of our cross-validation, we also performed 10 000 repetitions of our classification analysis with random permutations of the labels for the data set. We compared the mean performance of our classifier to the probability distribution of the permutation testing by dividing (number of times the permutation score met/exceeded the mean classifier score + 1) by (total number of permutations + 1) to establish statistical significance. 26 We used an alpha criterion of P < .05 to determine statistical significance.
Follow-up Analyses
A follow-up analysis on trait stability is described in the Supplemental Material. This analysis tested whether participants could be reliably identified during observation/imitation tasks based solely on resting state data. We also examined experience-dependent plasticity by identifying characteristics of edges that (1) best discriminated between pre- and posttherapy functional connectivity and (2) changed significantly with outcomes on 2 language tasks (behavioral variables reported in Table 1).
Data Availability
Data supporting the findings of this study are available from the corresponding author on reasonable request. Per the terms under which the data were acquired, access will require research collaboration and ethics approval.
Results
Whole Brain
The SVM classified whole brain functional connectivity vectors with accuracy significantly above chance to identify subject (87.1%; P < .0001), task performed (68.1%; P = .002), and time point (pre- vs posttherapy; 72.1%; P = .015). Figure 1 shows results of these analyses compared with permutation testing. Figure 2 shows confusion (error) matrices for these results.
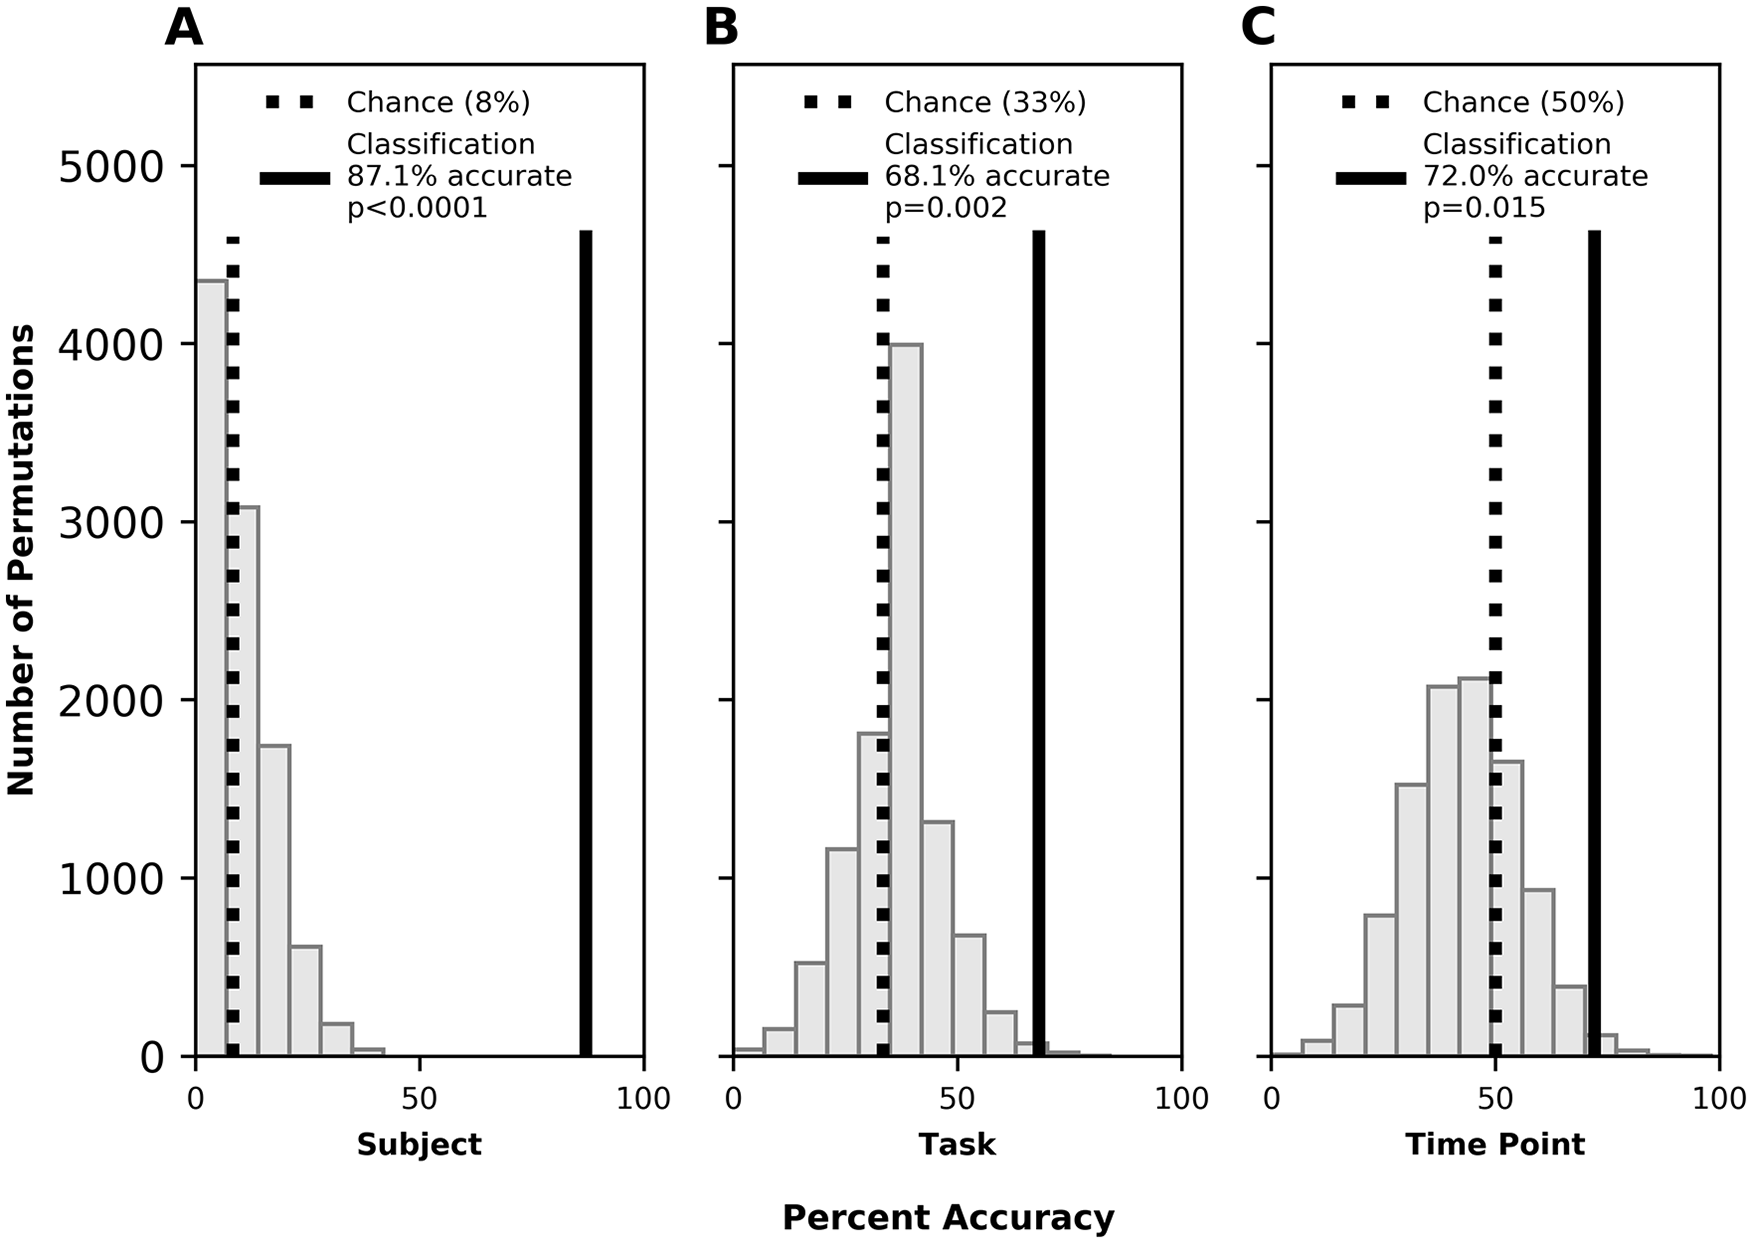
Whole brain classification accuracy for participant [trait] (A), task [state] (B), and time point [experience] (C). Histogram shows results of permutation testing (ie, the percent accuracy with which the labels were classified when randomly reassigned to the data). Dotted black line indicates accuracy expected by chance (ie, 100% ÷ 12 participants ≈ 8%; 100% ÷ 3 tasks ≈ 33%; 100% ÷ 2 time points = 50%). Solid black line indicates accuracy achieved by the machine learning classifier.
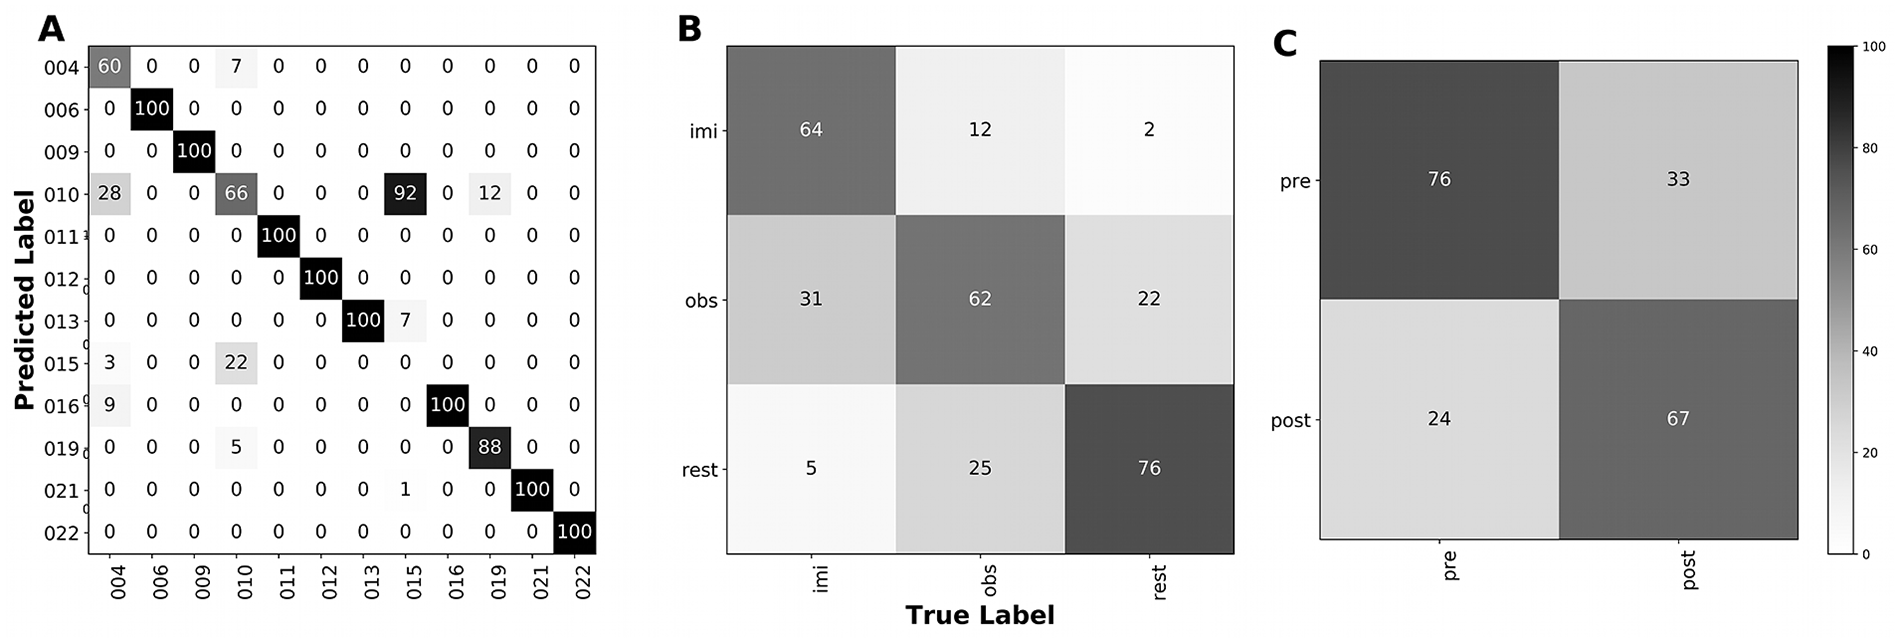
Whole brain confusion matrices for classifications by participant [trait] (A), task [state] (B), and time point [experience] (C). Values along the diagonal represent correct classifications; off-diagonal values indicate errors in prediction, with correct label on the x-axis and incorrectly assigned label on the y-axis. Participant identifiers in (A) are as in Table 1. Tasks in (B) include imitation (imi), observation (obs), and rest. Time points in (C) refer to pre- and posttherapy. Figures indicate percentages; therefore, each column sums to 100 while rows may sum to any value.
Right Hemisphere
The SVM classified right (uninjured) hemisphere functional connectivity vectors with accuracy significantly above chance to identify subject (79.9%; P < .0001), task performed (64.8%; P < .001), and time point (pre- vs posttherapy; 66.7%; P = .020). Permutation testing results are shown in Figure 3 and confusion matrices are shown in Supplemental Figure 4.
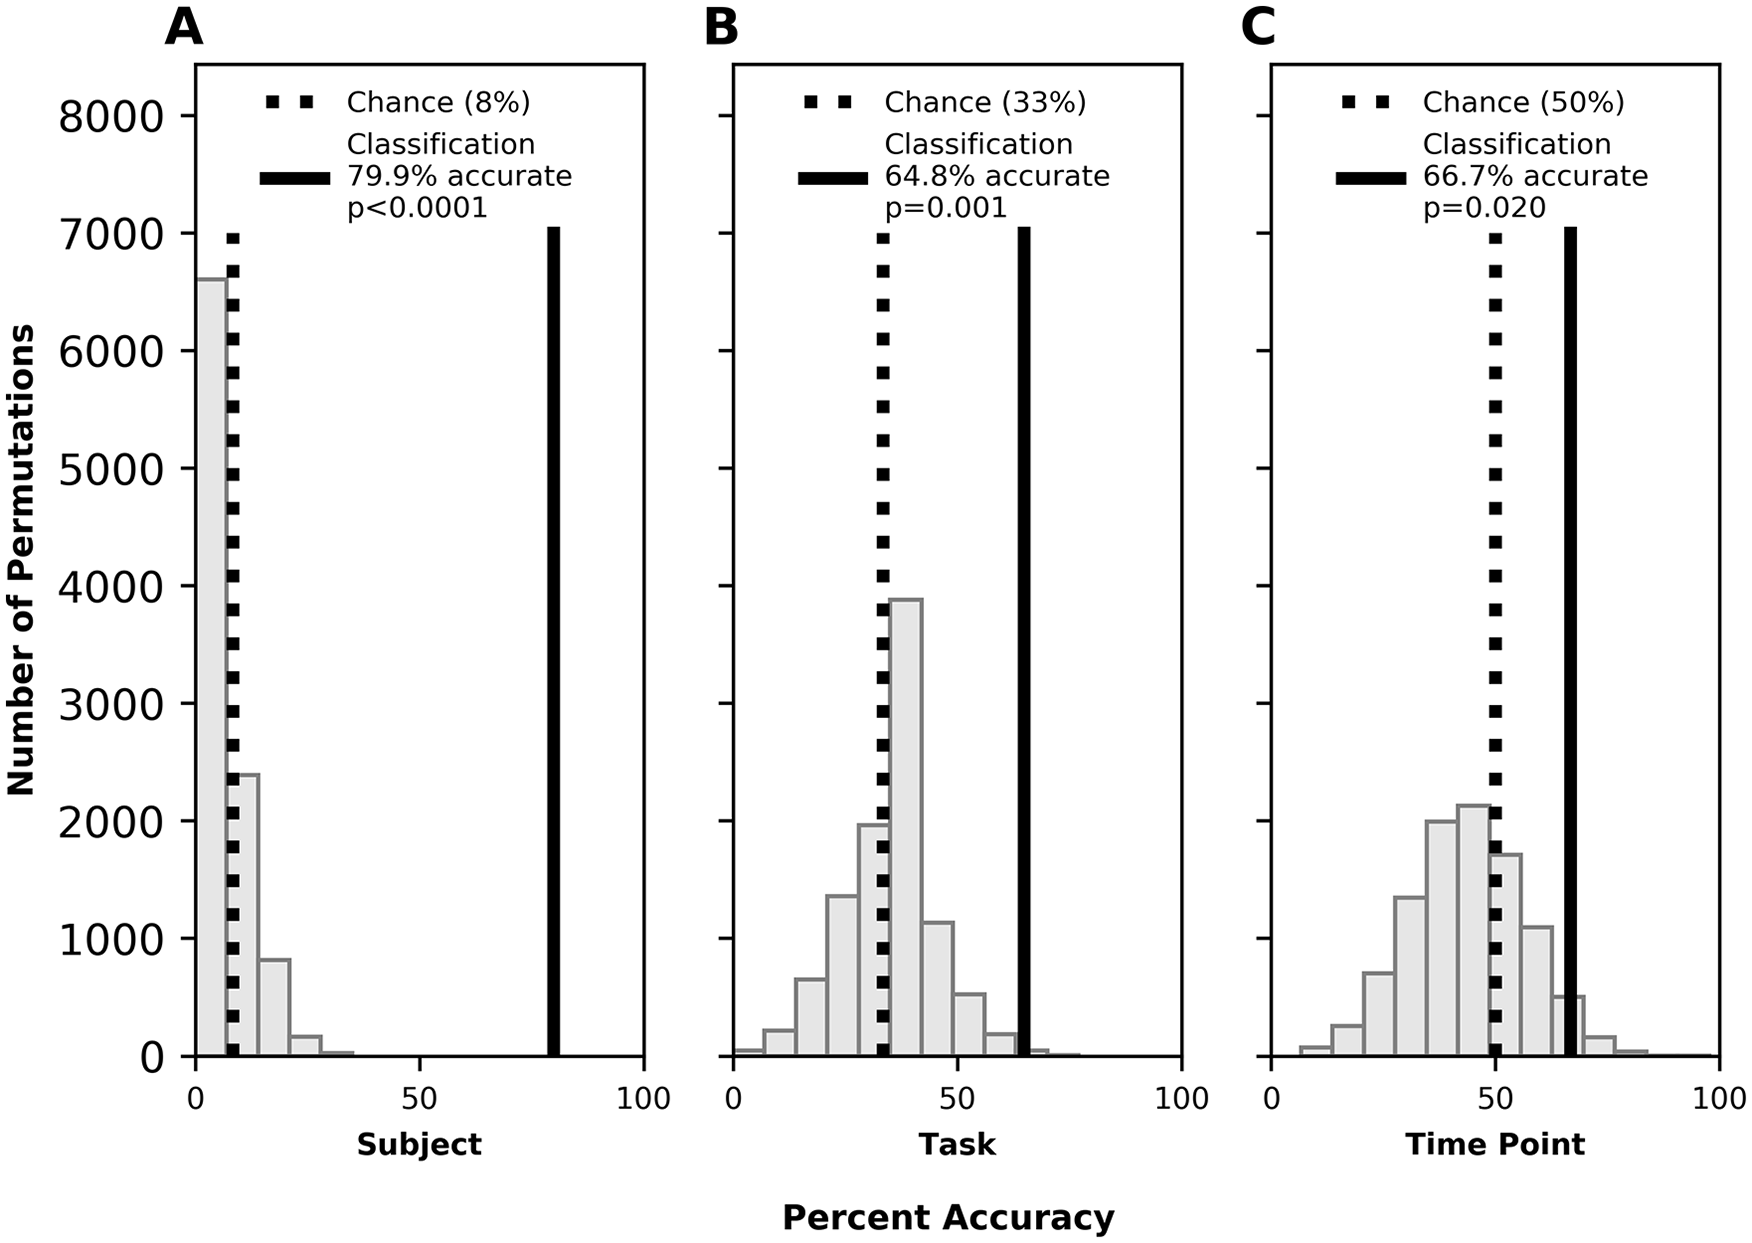
Right hemisphere classification accuracy by subject for subject [trait] (A), task [state] (B), and time point [experience] (C). Legend as in Figure 1.
Left Hemisphere
The SVM classified left (injured) hemisphere functional connectivity vectors with accuracy significantly above chance to identify subject (82.9%; P < .0001) and task performed (61.8%; P = .006). Classification on the basis of experience (pre- vs. posttherapy) did not reach statistical significance (64.9%; P = .155). Permutation testing results are shown in Figure 4 and confusion matrices are shown in Supplemental Figure 5.
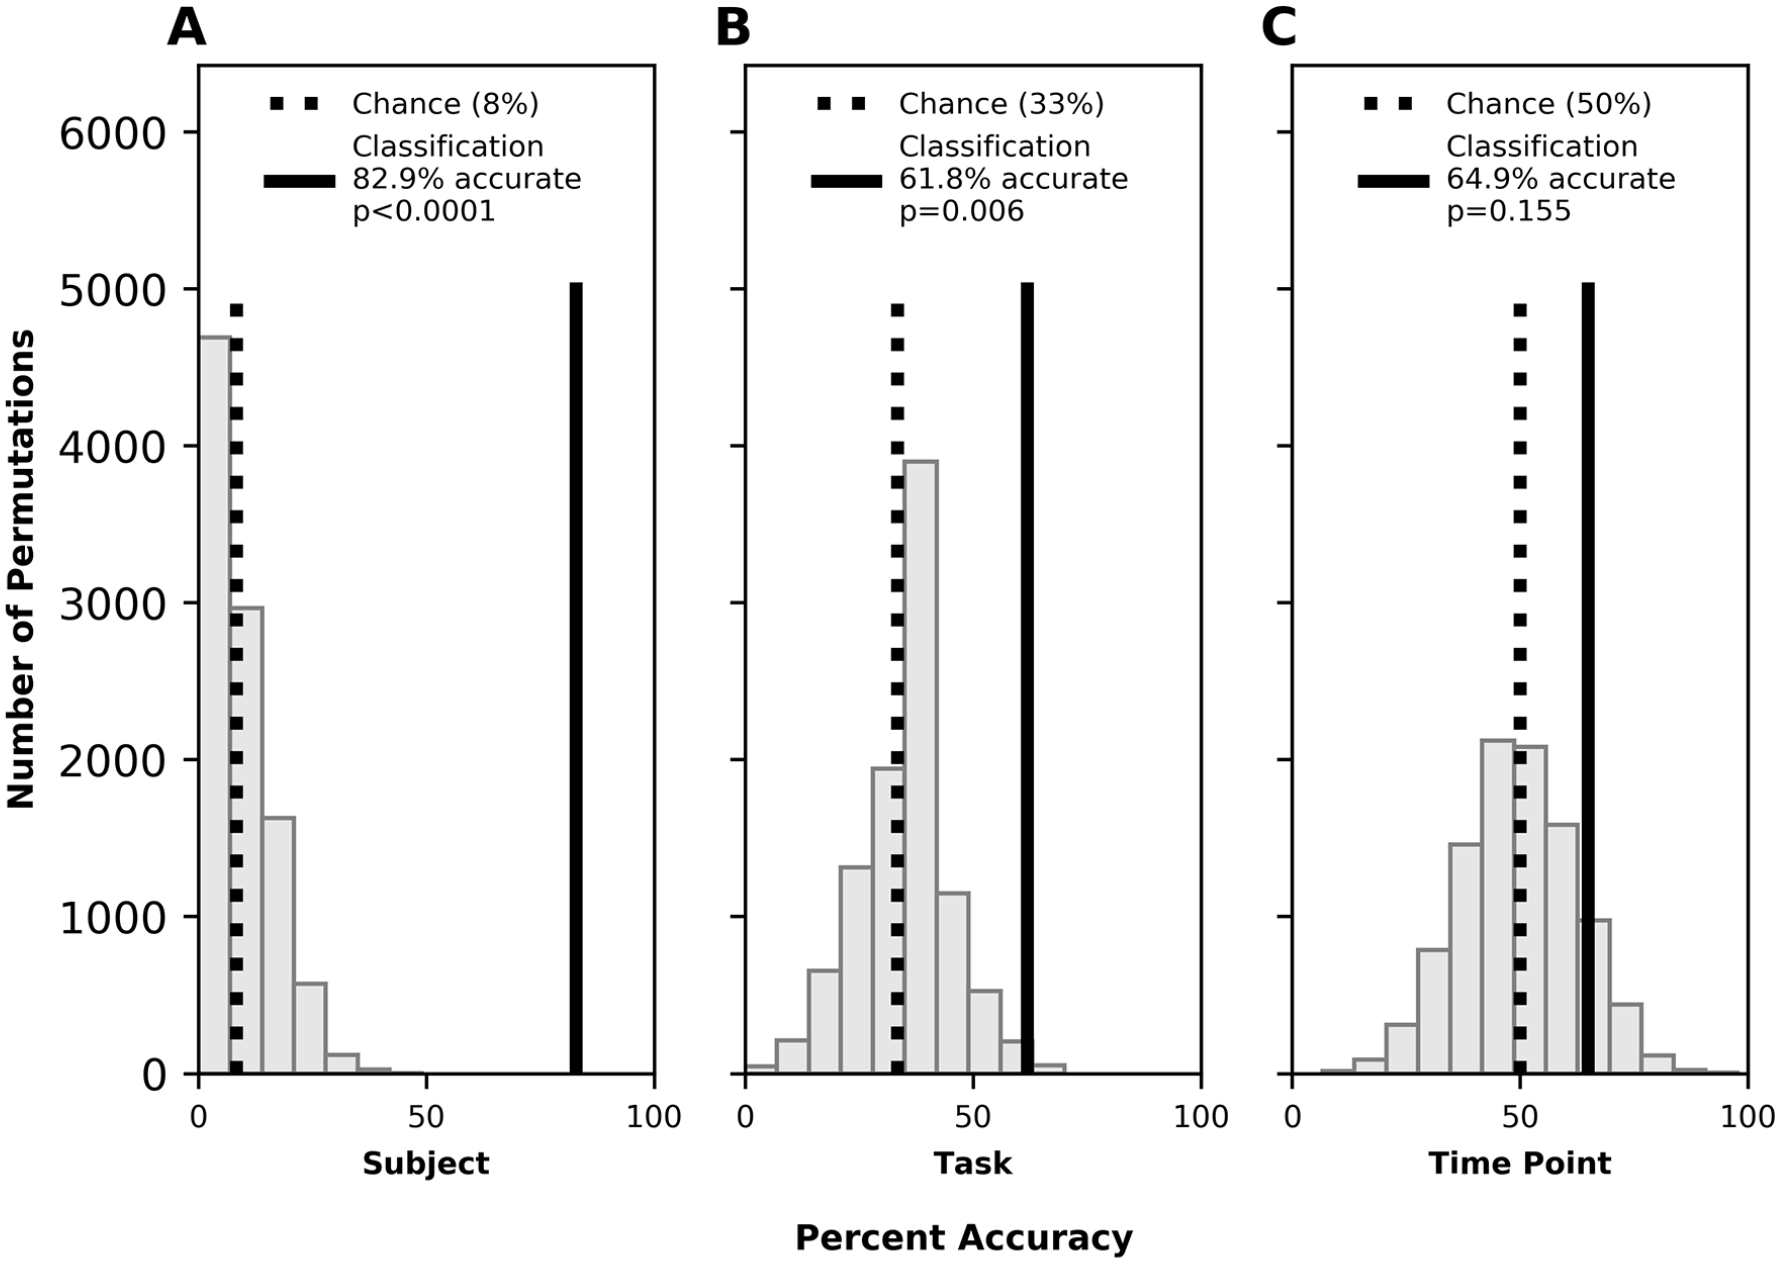
Left hemisphere classification accuracy by subject for subject [trait] (A), task [state] (B), and time point [experience] (C). Legend as in Figure 1.
Follow-up Analyses
Trait Stability
Classification by subject using only resting state data as the training set and task data as the testing set was significantly better than chance (66.0%; P < .0001).
Experience-Dependent Plasticity
Results for analyses of experience-dependent plasticity were grouped into (1) networks with strong roles in language processing and (2) networks with more supportive roles in language processing, as described in the Supplemental Material, where statistical findings are also included.
Within the top 5% of edges (166) distinguishing pre- from posttherapy scans, there were significantly fewer language-predominant edges and more language nonspecific edges than expected based on chance. In general, the language-predominant network represented within these top edges had more intrahemispheric connections, and these were strongly left-lateralized. Language nonspecific regions, conversely, displayed a nonsignificant trend toward greater connectivity between than within hemispheres. Overall, connectivity became significantly more negative following therapy, apparently driven by decreased connectivity of right-lateralized intrahemispheric edges.
Thirty-four whole-brain edges (~1%) were significantly correlated with change in language performance, as described in the Supplemental Material. Within these 34 edges, regions were equally represented, independent of language-predominant network status. However, edges within the language-predominant network were significantly more positively correlated with outcomes, while connections between the other regions had more negative correlations. This suggests that increased functional connectivity of language regions was associated with better outcomes, while stronger functional connectivity outside this network was potentially maladaptive. There were significantly more intrahemispheric than interhemispheric connections represented in the language nonspecific networks, and these were equivalently distributed between the 2 hemispheres.
Discussion
This study addresses the relative contributions of trait, state, and experience to functional connectivity in a group of individuals with poststroke speech and language deficits. We find that trait (ie, the stable individual nature of region-based functional connectivity) can be classified with a high level of accuracy, and that differences on the basis of state (ie, the task in which individuals were engaged) can also be identified. This is the case regardless of whether the whole brain, right (uninjured) hemisphere, or left (injured) hemisphere is used for classification. These sources of greater variance risk at least partially eclipsing effects that might be present on the basis of experience (ie, participation in the therapy program).
These analyses highlight the profound interindividual variability in functional connectivity in individuals with stroke, similar to prior results in healthy subjects. By training a support vector machine on functional connectivity matrices from data acquired at different time points and during different tasks, we were consistently able to identify the scans of individual participants. These findings suggest that individual differences bear strong consideration in fMRI studies of people with stroke.
Collapsed across time points and tasks, participants could be accurately classified on an individual basis using data not only from the whole brain or lesioned left hemisphere but also from functional connectivity matrices constructed solely from the contralesional hemisphere. As our analysis did not include healthy controls, the present study does not bear on the similarity of these “intact” hemispheres to those of healthy subjects. However, given the differences in activation reported previously in the right hemisphere of individuals with aphasia during language tasks, 27 and given the similarity, on an individual basis, between resting state and language tasks reported here, it is probable that such differences would also be reflected in functional connectivity during rest. For both the whole brain and the separate hemispheres, individual differences resulting from poststroke plasticity likely yielded increased subject classification accuracy compared with healthy individuals. Such questions will be explored in future analyses.
Our machine learning classification method was also able to identify whether subjects were quietly resting or performing 1 of 2 different tasks (observation or imitation of speech). While accuracy of task identification was more modest than classification of individual participants, it suggests that there are reliable task-related differences in functional connectivity even when specific task-induced hemodynamic responses are removed, as has been found in healthy individuals. 28 When the classifier was trained exclusively on resting state data, it still classified individual correlation matrices obtained during task-based fMRI with statistical significance. These findings suggest that, despite the existence of identifiable distinctions, functional connectivity during rest is predictive of functional connectivity during task, and information gleaned from resting state may be informative about the brain networks underlying task performance. We have previously found that when band-pass filtering is applied to identify the low-frequency fluctuations typically of interest in resting state fMRI analyses, strong individual differences persist, while different tasks can no longer be distinguished. 29
One of our a priori hypotheses was that we would be able to distinguish data acquired prior to therapy from data acquired following the treatment period (ie, that there would be systematic reorganization across subjects induced by the completion of the intensive aphasia protocol). This was supported by analyses of the whole brain and the right hemisphere. However, we were not able to identify such differences using the left hemisphere alone. This is of particular interest as many models and studies of aphasia recovery focus on left hemispheric reorganization. Had the left hemisphere been our sole focus, we would have missed detectable effects of intervention that were nevertheless captured when including interhemispheric and right-lateralized intrahemispheric connections.
Further investigation of edges significantly correlated with performance on our 2 language tasks suggested that increased functional connectivity of language regions supported improvement. Outside of language-predominant regions, decreased connectivity appeared to be more adaptive for behavior. Despite our finding that left hemisphere connectivity did not identify whether scans were acquired before or after therapy, we did not find improvement-based lateralization differences between the hemispheres, although the nonspecific networks did have more intrahemispheric than interhemispheric edges, while connections among language-predominant regions were more balanced. However, we acknowledge that this is a rather gross approach to characterizing network connectivity (and not the primary motivation of this study) and call for more anatomically targeted analyses (eg, focus on specific networks) as well as measures suitable to identifying more nuanced patterns of change (such as graph theoretical metrics) in future studies. Still, the main contribution of the present work is to underscore the need to conduct such analyses at an individual level, with consideration of the significant variability among individuals and the potentially idiosyncratic relationship of behavioral improvement to brain changes.
Limitations of the present study include the small sample size, as well as the heterogeneous nature of the sample, particularly in the range of ages, lesions, time post onset, and behavioral phenotype (ie, aphasia severity), which we addressed by removing contributions of these variables from our data on an edgewise basis using linear regression. It is noteworthy, and unexpected, that the identity of the individual with the largest lesion (#15) was rarely accurately classified, typically being incorrectly identified by our SVM as the individual with the second largest lesion (#10). This individual had a similar aphasia profile but differed considerably in other features, including sex, age, and chronicity. Although 165 imaging runs were included in our analysis, this scarcely approaches the “big data” scale to which such machine learning algorithms are typically applied, and these data were acquired from only 12 individuals. Varying numbers of scans were included for each participant, and the imitation task, in particular, was underrepresented compared with the other tasks. While SVMs are not impacted by the presence of additional data points beyond the margins that separate classes, the number of features (edges) outweighed the number of samples (individual scans) by a factor of 20 for the whole brain analysis, and by a factor of 5 for each hemisphere. Additionally, our brain parcellation atlas was somewhat coarse, ensuring that no region was completely excluded in any participant due to stroke, but leading to large regional averages that could have obscured nuances of functional activation. While this should not affect our findings of overall strong interindividual differences, it is possible that the classification of task, as well as time point relative to therapy, would have become even more accurate with a finer parcellation scheme. Furthermore, the analysis of experience (particularly in the left hemisphere) may have been diminished by the limited effects of the therapy, as reported elsewhere, 17 which were statistically significant but with low effect size (similar to other therapies used in research and/or practice). It is also uncertain whether similar post-therapy changes in functional connectivity would have been identified with different therapy approaches, especially the relatively strong representation of occipital cortices given the visual orientation of the imitation therapy. Finally, the use of a matched control group could have helped identify the extent to which our observations were specific to poststroke participants or how they may have differed from healthy brains. While our findings are in line with past studies using neurologically intact subjects, future studies would benefit from direct comparisons.
The present study calls into question the nature and origin (but not the validity) of functional connectivity changes in response to aphasia therapy (eg, Marcotte et al30,31 and van Hees et al 32 ). Our analysis strongly suggests stability of whole brain functional connectivity on an individual basis. While this does not, in principle, preclude changes associated with therapy, it is perhaps surprising that individuals remained uniquely identifiable in comparison to others in the same cohort, despite observable common changes occurring on a group level. To reconcile these 2 sets of findings, we propose 2 distinct lines of reasoning.
One possible explanation is that only a few regions (eg, those of interest) change in activity or connectivity following therapy. In this case, to maintain overall network stability, the other regions would have to maintain pre-therapy connectivity to override the changes in interregional correlations that would necessarily occur by having a few regions significantly changing in activation or connectivity. This could occur if changes occurred only within a subnetwork that was initially minimally correlated with other regions (ie, with strong segregation) and remained minimally correlated with regions outside the subnetwork following treatment (ie, still segregated), even in the context of some (limited) changes.
A second explanation is that brain remodeling is taking place across a far broader network than is typically thought, with maintenance of the relative balance among regions despite changes in particular regions of interest (or those that survive an arbitrarily selected threshold). The essential difference between these 2 perspectives is the degree to which changes in regions or subnetworks occur in relative isolation, or whether the entire network (ie, the whole brain) changes in tandem with those regions or subnetworks of interest, all of which reconfigure to such an extent that the original interregional correlations are generally preserved and remain uniquely identifiable. We believe our findings of posttherapy change in functional connectivity across myriad regions in both hemispheres—independent of their putative roles in language function—support this second proposal. Future studies in brain connectivity will further elucidate the complex nature of the changes that occur in response to treatment of stroke and its behavioral sequelae such as aphasia, and which support functional recovery. Such studies will include those involving external manipulation of the brain through noninvasive stimulation, of growing interest in treatment of chronic stroke,33-40 which may affect the stability of an individual’s whole brain functional connectivity.
Conclusions/Implications
This study suggests that poststroke functional connectivity is impacted by trait (individual differences), state (task differences), and experience (therapeutic intervention). That individual differences in functional connectivity were strongly identifiable across tasks and time points emphasizes the need for individualized approaches. It also suggests that resting state data may be practically relevant to inform study of the recovering brain after stroke, especially given the challenges of task performance and motion artifacts associated with people who have brain injuries. 41 The considerable influences of both trait and state merit consideration when seeking to identify and understand the effects of experience. Understanding the ways in which individual differences account for variability in functional connectivity will allow us to hone our techniques and better characterize changes associated with behavioral improvement, which will in turn enable us to promote adaptive forms of plasticity through behavioral therapy and other forms of intervention, including pharmacology and noninvasive brain stimulation. This work moves us closer to development of personalized approaches to optimize treatments for patients with chronic stroke and aphasia, consistent with the objectives of precision medicine.
Supplemental Material
sj-docx-1-nnr-10.1177_1545968320981953 – Supplemental material for Identifiable Patterns of Trait, State, and Experience in Chronic Stroke Recovery
Supplemental material, sj-docx-1-nnr-10.1177_1545968320981953 for Identifiable Patterns of Trait, State, and Experience in Chronic Stroke Recovery by E. Susan Duncan, A. Duke Shereen, Thanos Gentimis and Steven L. Small in Neurorehabilitation and Neural Repair
Footnotes
Acknowledgements
We gratefully acknowledge the contributions of the research team, as well as the participating patients and families.
Supplementary material for this article is available on the Neurorehabilitation & Neural Repair website along with the online version of this article.
Declaration of Conflicting Interests
The author(s) declared no potential conflicts of interest with respect to the research, authorship, and/or publication of this article.
Funding
The author(s) disclosed receipt of the following financial support for the research, authorship, and/or publication of this article: This work was supported by the National Institute on Deafness and other Communication Disorders (NIDCD) of the National Institutes of Health (NIH) (grants R01-DC007488 and R33-DC008638); the James S. McDonnell Foundation under a grant to the Brain Network Recovery Group (A.R. McIntosh, PI); Mr William Rosing, Esq, and the Louisiana Board of Regents (LEQSF(2017-20)-RD-A-03).
References
Supplementary Material
Please find the following supplemental material available below.
For Open Access articles published under a Creative Commons License, all supplemental material carries the same license as the article it is associated with.
For non-Open Access articles published, all supplemental material carries a non-exclusive license, and permission requests for re-use of supplemental material or any part of supplemental material shall be sent directly to the copyright owner as specified in the copyright notice associated with the article.