
Abstract
Despite negative association in cognition and memory, mice harboring Val66Met BDNF SNP (BDNFM/M) exhibit enhanced motor recovery accompanied by elevated excitatory synaptic markers VGLUT1 and VGLUT2 in striatum contralateral to unilateral ischemic stroke. The cortico-striatal pathway is a critical gateway for plasticity of motor/gait function. We hypothesized that enhanced excitability of the cortico-striatal pathway, especially of the contralateral hemisphere, underlies improved motor recovery. To test this hypothesis, we examined the key molecules involving excitatory synaptogenesis: Thrombospondins (TSP1/2) and their neuronal receptor α2δ-1. In WT brains, stroke induced expressions of TSP1/2-mRNA. The contralateral hemisphere of BDNFM/M mice showed heightened TSP2 and α2δ-1 mRNA and protein specifically at 6 months post-stroke. Immunoreactivities of TSPs and α2δ-1 were increased in cortical layers 1/2 of stroked BDNFM/M animals compared with BDNFM/M sham brains at this time. Areal densities of excitatory synapses in cortical layer 1 and striatum were also increased in stroked BDNFM/M brains, relative to stroked WT brains. Notably, the frequency of GABAergic synapses was greatly reduced along distal dendrites in cortical layer 1 in BDNFM/M brains, whether or not stroked, compared with WT brains. There was no effect of genotype or treatment on the density of GABAergic synapses onto striatal medium spiny neurons. The study identified molecular and synaptic substrates in the contralateral hemisphere of BDNFM/M mice, especially in cortical layers 1/2, which indicates selective region-related synaptic plasticity. The study suggests that an increase in excitatory-to-inhibitory synaptic balance along the contralateral cortico-striatal pathway underlies the enhanced functional recovery of BDNFM/M mice.
Introduction
Genetic variants contribute to injury-induced structural plasticity and behavioral adaptation. However, the underlying mechanisms by which genetic variants affect recovery in stroke are not well understood. Brain-derived neurotrophic factor (BDNF) is a widely expressed neurotrophin in the central nervous system (CNS) and plays an important role in synaptic plasticity, memory, and cognition.1,2 A variant of the BDNF gene with a single nucleotide polymorphism (SNP) at codon 66 has been identified in humans. The presence of this SNP is negatively associated with cognition and memory and reduces activity-dependent BDNF secretion. 3 The effects of Val66Met SNP on stroke outcome and rehabilitation remains to be fully elucidated. 4 Earlier studies in stroke patients indicate a primarily maladaptive role with Met carriers, based on worse functional outcomes.5,6 Other studies indicated that Val66Met SNP is associated with worse outcomes at early but not at later time points.7,8 Moreover, under certain conditions, it can promote improved outcomes. 9
Mice harboring the human BDNF Val66Met at both alleles (BDNFM/M) display an anxiety phenotype and memory deficit, recapitulating traits in humans who carry the SNP. Previously, we reported that BDNFM/M mice exhibit greater acute motor deficits but unexpected enhancement of motor/gait function during the subacute and long-term recovery phase following stroke. 10 The enhanced functional recovery in BDNFM/M was pronounced in the ipsilesional limbs, suggesting the involvement of contralateral hemisphere. The elevated expressions of excitatory synaptic markers VGLUT1/2 in the contralateral striatum suggested a link between excitatory synaptic substrates and superior stroke recovery.
Thrombospondins (TSPs) are large oligomeric extracellular glycoproteins that engage in cell-matrix interactions and are implicated in multiple pathophysiological states. 11 They play a major role in tissue remodeling and regulate synaptogenesis in the CNS.12,13 Secreted by astrocytes, TSP1/2 are considered to be essential signals for excitatory synapse formation.13,14 The formation of excitatory synapses is mediated through the binding of TSPs to the α2δ-1, an auxiliary subunit of calcium channel. α2δ-1 was identified as the neuronal TSP receptors responsible for the formation of CNS excitatory synapses. 15 Overexpression of α2δ-1 increases excitatory connections, while the loss of α2δ-1 profoundly reduces the number of excitatory synapses.16,17 This indicates the role of TSPs/α2δ-1 interactions in excitatory synaptogenesis.
Functional recovery from stroke and repair of other CNS injuries requires enhanced synaptic plasticity.18,19 A shift in synaptic balance toward excitation, either by elevating excitatory markers or reducing inhibitory signals, has been implicated in the improvement of stroke recovery.10,20 Given the fact that TSPs expressions increase in post-stroke brains,21,22 and that the TSPs/α2δ-1 interaction contributes to excitatory synaptic formation, we sought to determine whether TSPs/α2δ-1 are the molecular and synaptic substrates that account for the superior recovery in BDNFM/M mice. We hypothesized that improved motor recovery of BDNFM/M mice is due to increases in the expressions of TSPs and α2δ-1 at excitatory synapses in the contralateral hemispheres, which enhances excitatory-to-inhibitory balance at synapses of the cortico-striatal pathway in the post-stroke brain. Here we show that, indeed, stroke increases excitatory synaptic markers and synapses and reduces inhibitory synapses in the contralateral cortico-striatal pathway of BDNFM/M mice. Moreover, we demonstrate that layers 1/2 of contralateral cortex is a site of synaptic plasticity.
Methods
Animals
Procedures for the use of animals were approved by the Institutional Animal Care and Use Committee (IACUC) of Weill Cornell Medicine, National Institutes of Health, and ARRIVE (Animal Research: Reporting of In Vivo Experiments) guidelines. C57bl/6, BDNF+/+ (wild type, WT) and BDNFM/M male mice (3-4 months) were used. We used BDNF+/+ and BDNFM/M littermates from respective 12x heterozygote mating to match the genetic background within a given experiment for the controlled preclinical studies described. 3 The facility monitors and maintains temperature, humidity, and a 12-hour light/dark cycle. Because of the nature of a long-term study, mice were given a code (either tattoo or ear tag) at the beginning of the study. Surgeons who performed sham or transient middle cerebral artery occlusion (MCAO) were blinded to the animals. Animals’ identity was also blinded to the persons who cryo-sectioned, vibratome-sectioned, or ultrathin-sectioned and evaluated outcomes. Sample size for stroke outcome measurements was calculated a priori to be a minimum 10 by predicting detectable differences to reach a power of 0.80 at a significance level of <.05, assuming a 40% difference in mean and a 30% standard deviation 23 at the 95% confidence level.
MCAO and Chronic Recovery Model
Male WT and BDNFM/M mice at 3 to 4 months of age were randomly assigned to undergo sham or MCAO by using 6-0 Teflon-coated monofilament surgical sutures (Doccol Co) for 30 minutes as previously described.24,25 Sham surgery consisted of exposure of the right carotid artery at its bifurcation without occlusion under the same duration of anesthesia. The transient MCAO perturbed blood flow in the striatum, thalamus, and the cortex unilaterally with the striatum as the structure most affected by the occlusion. Body temperature was maintained at 37°C ± 0.5°C before, during, reperfusion phases as well as 45 minutes of post-stroke recovery period. A sizable infarction of around 35 mm3 (~20% ipsilesional hemisphere) in the MCA territory was produced at 3 days post-stroke, 24 which was accompanied by acute motor and gait impairment, but with substantial spontaneous recovery by 2 weeks. Prior to returning to home cages, mice were placed in a recovery cage while maintaining body temperature 37°C ± 0.5°C until the animal regained consciousness and resumed activity. Animals that exhibited both cerebral blood flow (CBF) reduction of more than 80% during MCAO and CBF recovery of more than 80% by 10 minutes after reperfusion were included in the study. Saline was subcutaneously administered daily and Hydrogel (ClearH2O) was given to prevent dehydration during the first week of the post-stroke period twice a day. Mice typically started to regain body weight around days 5 to 6 and continued to recover from stroke.
Tissue Preparation for Molecular Analyses
As reported in a previous study, 26 sections were collected for each hemisphere to perform molecular analyses at indicated time points from the brain regions spanning about 7 mm rostrocaudal (+2.8 to −3.8mm from bregma covering entire infarct region), including both cortex and striatum.
TSP1/2, α2δ-1, and PSD-95 mRNA Measurement
mRNA levels were quantified with real-time reverse transcription–polymerase chain reaction (RT-PCR) using fluorescent TaqMan technology as described previously.27,28 PCR primers and probes specific for the genes in this study were obtained as TaqMan predeveloped assay reagents for gene expression (Life Technologies, Foster City, CA). Primers used were TSP1 (Mm01335418_m1), TSP2 (Mm01279240_m1), α2δ-1(Mm00486607_m1), PSD-95 (Mm00492193_m1), and β-actin (Mm00607939_s1). β-Actin was used as an internal control for normalization of samples. The PCR was performed in 20 μL total volume using FastStart Universal Probe Master Mix (Roche, Indianapolis, IN) by incubating at 95°C for 10 minutes followed by 40 cycles of 15 seconds at 95°C and 1 minute at 60°C. The results were analyzed using 7500 Fast Real-Time PCR System software (Life Technologies, Grand Island, NY).
α2δ-1 Protein Measurement
Brain sections were homogenized in CelLytic buffer (Sigma, MO) containing protease inhibitors (Roche). Fifty micrograms of protein were loaded on a NuPAGE 4% to 12% Bis-Tris Gel (Life Technologies) and transferred onto a polyvinylidene fluoride membrane (Bio-Rad, Hercules, CA). Briefly, the membrane was incubated at 4°C with α2δ-1 (D219, 1:1,000 Sigma) or β-actin (sc-1615, 1:10,000, Santa Cruz Biotechnology) antibody overnight. Membranes were incubated with secondary antibodies conjugated with Alexa Fluor 680 (A 21088, Life Technologies), or IRDye 680RD (926-68071, Li-cor). Each protein’s specific band was visualized using the Odyssey Imaging System (Li-cor).
Tissue Preparation for Light and Electron Microscopy (LM and EM)
Three- to 4-month-old BDNF+/+ and BDNFM/M mice underwent either sham or MCAO. Six months after, animals were anesthetized and transcardially perfused with a fixative consisting of 4% paraformaldehyde buffered by 0.1 M phosphate buffer. Brains were postfixed for a minimum of 3 days before preparing coronal sections using a vibrating microtome set at a thickness of 50 µm. Sections were allocated across three staining procedures: LM-immunocytochemistry (LM-ICC) to measure regional densities of α2δ-1; EM-ICC to detect areal frequencies of inhibitory synapses formed by axon terminals immunoreactive for the GABAergic marker, glutamic acid decarboxylase (GAD); and EM without ICC to quantify the areal density of excitatory axo-spinous synapses formed onto pyramidal neurons in cortex and medium spiny neurons (MSN) in striatum, so identified based on the morphology of the synapses as asymmetric and with thick postsynaptic densities (PSDs), formed on dendritic spine heads.
LM-ICC Detection of TSP1/2, α2δ-1
One section containing the cortico-striatal path was chosen randomly from a collection of 50 µm vibratome sections of each animal. Briefly, free-floating sections were incubated with mouse anti-thrombospondins (1:100, Abcam ab1823), or mouse anti-α2δ-1 (1:100, Sigma D219) and secondary antibody (1:2000, Alexa Fluor 594). The negative control sample was treated with the absence of primary antibody. Images were obtained all at once using an inverted Nikon Eclipse Ti-U confocal microscope.
LM-ICC Detection of α2δ-1 With Silver-Intensified Gold (SIG) and Quantification
Specificity of the α2δ-1 antibody (Sigma D219) was previously validated. 29 One section containing the cortico-striatal path was packed randomly from a collection of vibratome sections of each animals. Briefly, free-floating sections were incubated with mouse anti-α2δ-1 (1:100, Sigma D219). Immunoreactivity was detected by the SIG procedure using goat anti-mouse IgG conjugated to 0.8-nm colloidal gold (1:100, EMSciences Cat No. 25121), as described previously. 30 All sections were scanned at once, using VS120 (Olympus) at a magnification of 2× and 10×. Auto-corrections were turned off to avoid introducing interanimal variabilities arising from the image capturing step. The gray values ranged from 0 to 255, with higher values indicating less labeling. The background gray values were measured from tissue that underwent the identical ICC procedure 30 in parallel but for which the initial incubation was performed in the absence of primary antibody. The difference in the measured greyscale values from the background values was plotted using reversed gray scale, whereby the background was equal to zero.
EM Detection of Axospinous Synapses and Quantification
Two brain subregions were analyzed: Layer 1 of cerebral cortex for the analysis of excitatory axo-spinous synapses onto apical dendritic tuft spines of pyramidal neurons, and dorsolateral striatum for the analysis of excitatory axo-spinous synapses onto MSN. The sample size per brain region per animal was equalized across animals. Excitatory axo-spinous synapses were identified using criteria used previously 31 by the presence of thick PSDs within spines that were devoid of mitochondria, gathering of small clear vesicles in axon terminals, and parallel alignment of the plasma membrane of the axon terminal facing the spine plasma membrane associated with the PSD. The electron microscopists capturing images were kept blind about the treatment and genotype of animals from which the tissue was derived.
EM-ICC Detection of GAD and Quantification of GABAergic Synapses
Specificity of the antibody used to detect GAD65 and GAD67 isoforms (AB1511, Chemicon,) was established previously.32,33 The procedure for EM-ICC and quantification of GABAergic synapses was performed as described previously using HRP-DAB (horseradish peroxidase–3,3′-diaminobenzidine) as the immunolabel. 33 EM samples were imaged strictly in the order of encounter from portions of the ultrathin sections showing the tissue-to-plastic transition, so as to ensure random sampling from a portion of the vibratome section that was nearest to the surface where access to immunoreagents would be the greatest. The sample size per brain region per animal was equalized. For the assessment of the proportion of layer 5 pyramidal cell body plasma membrane contacted GABAergic axosomatic synapse lengths, 5 cell bodies per brain region per animal were analyzed. To assess the proportion of the plasma membrane of spiny dendrites in layer 1 and dorsal striatum that were contacted by GABAergic axon terminals, 10 dendritic profiles were sampled from each brain, using electron micrographs that were captured at a magnification of 25 000×. All quantifications were performed while kept blind of the treatment and genotype.
Statistical Analyses
mRNA levels were expressed as mean ± standard error of the mean (mean ± SEM) and statistical comparison were made using 1-way analysis of variance followed by post hoc tests for multiple comparison and the Student’s t test for 2 groups. For LM and EM studies, the Kruskal-Wallis nonparametric test was used, followed by uncorrected Dunn’s test for multiple comparisons to identify genotype and treatment effects. Differences were considered statistically significant at P < .05.
Results
TSP2 Expression in Brain Is Elevated in BDNFM/M Mice at 6 Months After Stroke
Stroke increases the expressions of TSPs in acute and subacute phases of stroke. 21 To address changes of TSP genes during stroke recovery, their expressions were measured in the brains of WT mice between 2 weeks to 6 months post-stroke. The hemisphere contralateral to unilateral ischemic stroke showed a moderate but significant elevation of TSP1-, but not TSP2-mRNA levels, compared with pre-stroke levels (Figure 1A and B). There were significant upregulations of TSP1 and 2 in the stroke hemisphere at 2 weeks and 2 months after stroke. The chronic upregulation of TSPs in both hemispheres suggests a contributing role of TSPs to continual tissue remodeling in both hemispheres following stroke.
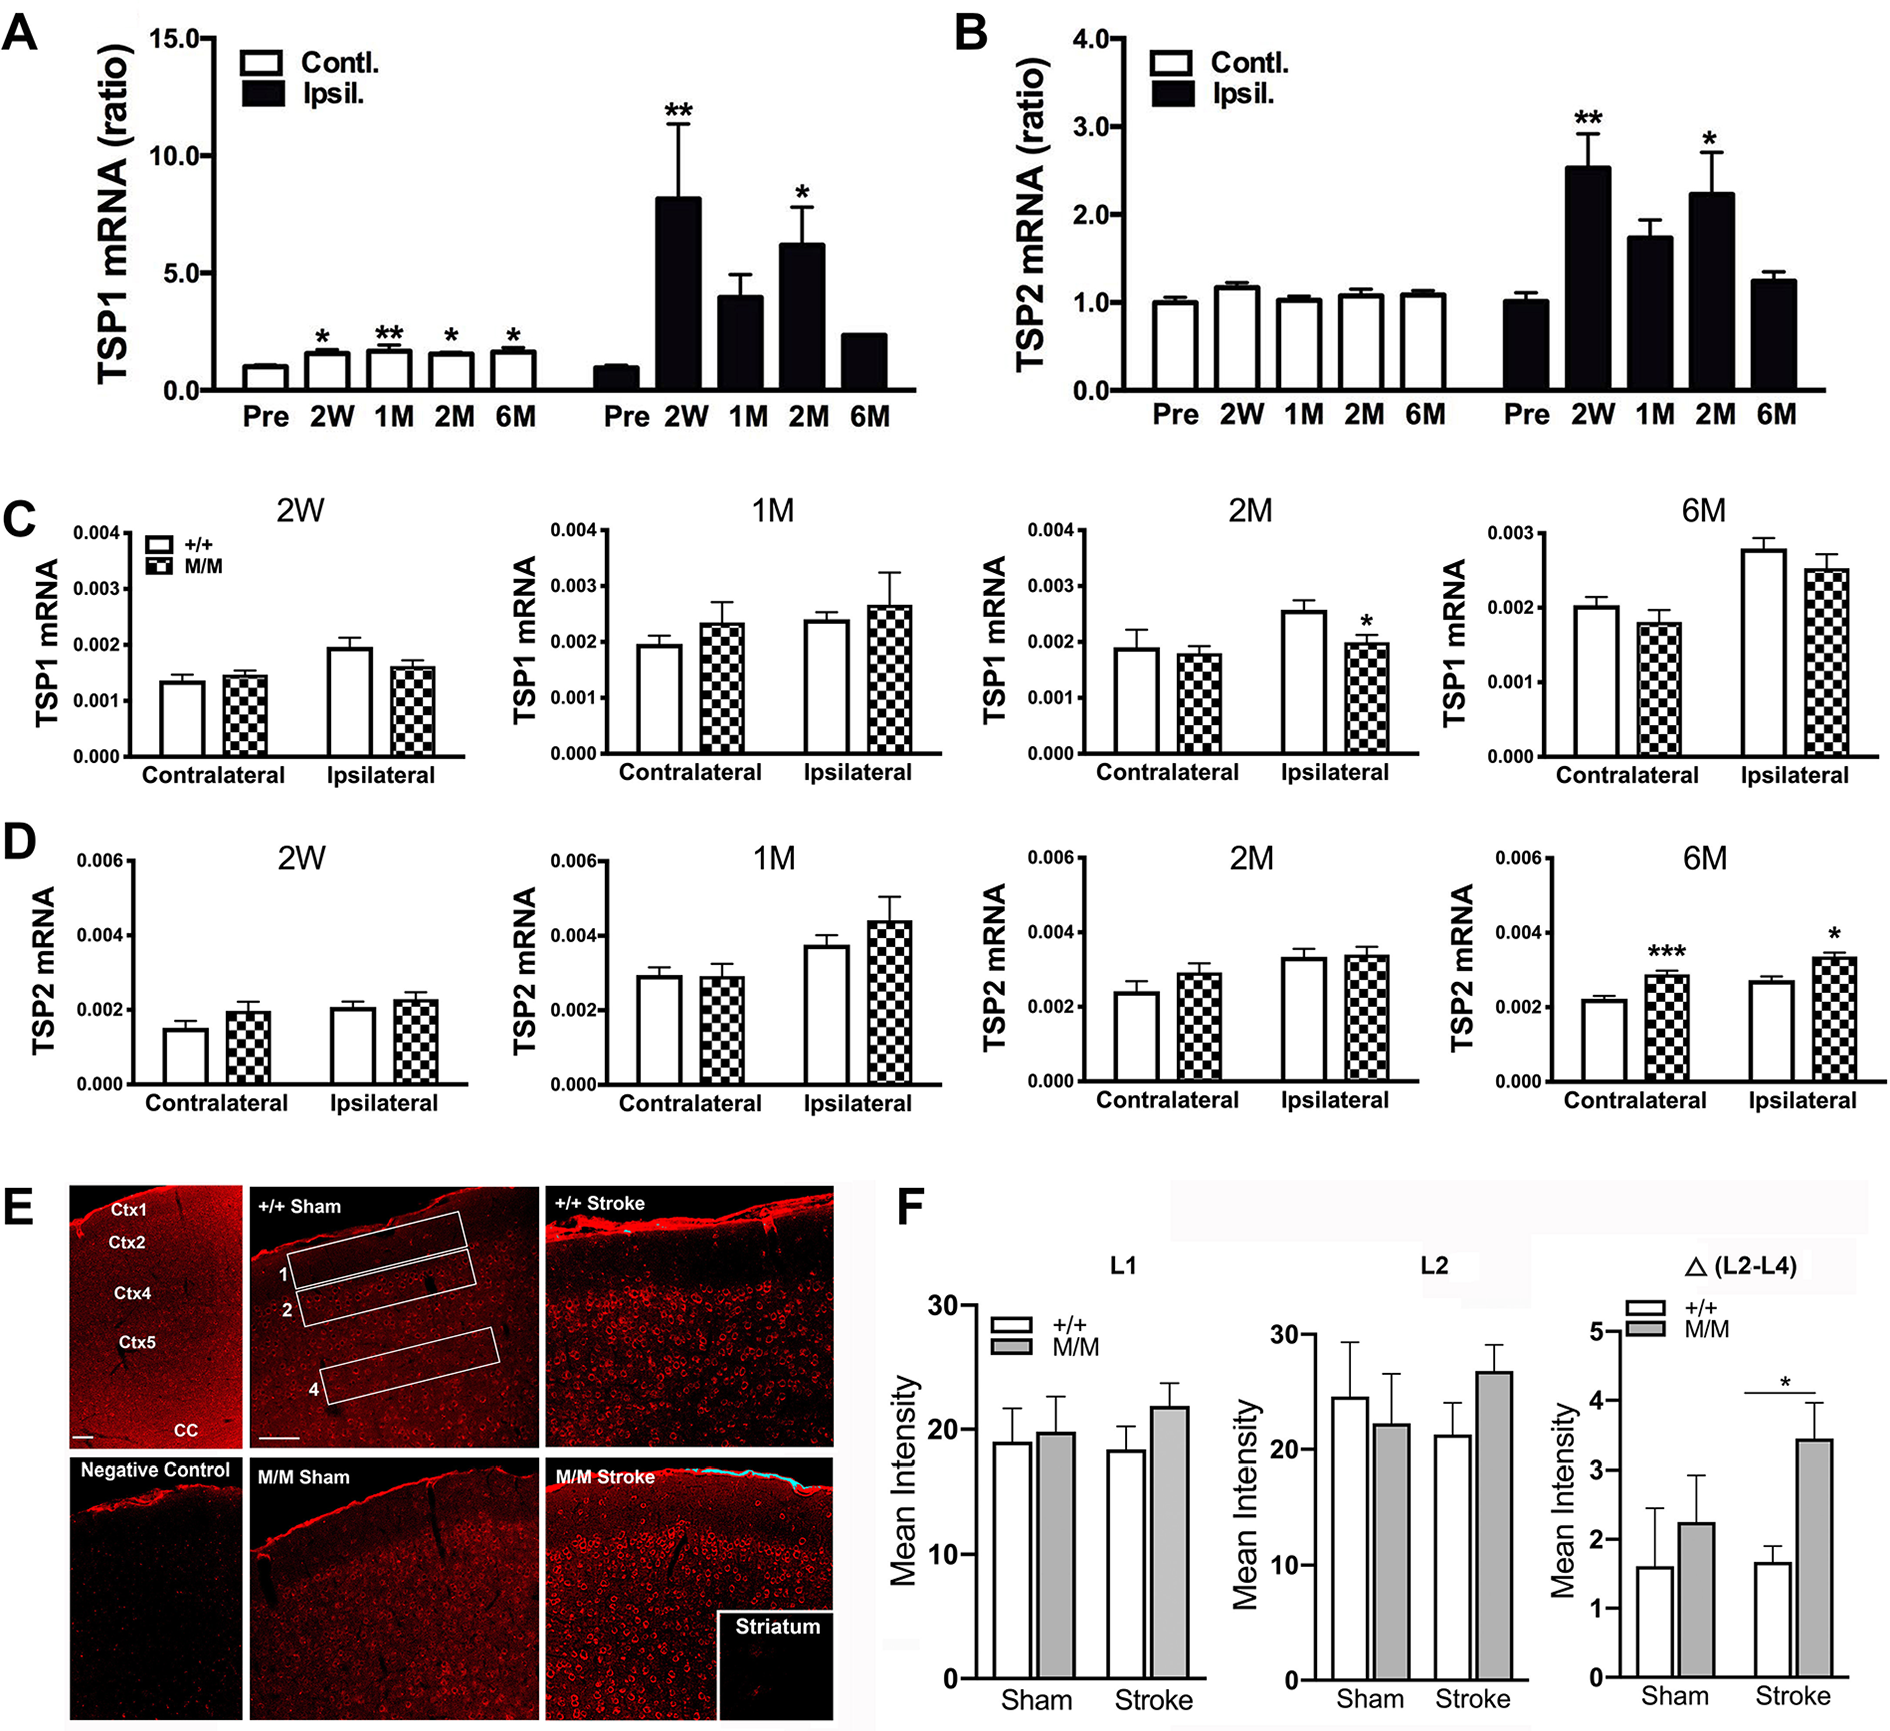
TSP1 and TSP2 genes (TSP, thrombospondin) expressions in BDNF+/+ (wild type, WT) and BDNFM/M (BDNF, brain-derived neurotrophic factor) mice. Panels A and B: Temporal gene profiles of TSP1 (A) and TSP2 (B) in the brain following middle cerebral artery occlusion (MCAO) in WT mice. mRNA levels were measured in tissue (+2.8 to −3.8mm from bregma that covered an infarct region) from the contralateral and ipsilateral hemisphere in BDNF+/+ mice prior to stroke (Pre) and during stroke recovery phase (2 weeks to 6 months) and normalized by actin. Y-axis represents ratios of TSP1 and TSP2 mRNA levels compared with baseline (pre) value. N = 4-5/group, one-way analysis of variance, Post hoc comparison. *P < .05, **P < .01 versus Pre. W, weeks; M, months. Panels C and D: TSP1 and TSP2 genes expressions in BDNF+/+ and BDNFM/M mice during the stroke recovery period. mRNA levels of TSP1 (C) and TSP2 (D) at 2 weeks (W), 1, 2, and 6 months (M) after stroke. N = 6-7/genotype, Student’s t test *P < .05, ***P < .001, +/+ (WT) vs M/M, BDNFM/M. E: Confocal microscopic assessment of TSP immunoreactivity in the cerebral cortex of WT and BDNFM/M mice 6 months after stroke. Representative micrographs containing cerebral cortex layers 1, 2/3, and 4 of a contralateral hemisphere of age-matched WT and BDNFM/M sham and stroke mice. Identical immunolabeling procedure without the primary antibody served as a negative control (not shown). Two images of the cerebral cortex that included layers 1 to 4 were captured at 20× (water objective) for each animal while their identities were blinded. A composite of all the pictures was created and adjusted in Photoshop simultaneously. Scale bar = 100 µm. F: Mean optical densities of the defined rectangular areas in the cortex were assessed using Image J. Mean intensity of L1 and L2 was determined for each group, then the difference between the mean densities of L2 and L4 was calculated. Mean optical intensity in cerebral cortex was expressed as mean ± SEM (standard error of the mean) for TSP immunoreactivity. Ctx, cortex; CC, corpus callosum. Statistical analysis was performed using 2-way analysis of variance for the effect of genotype and stroke and post hoc Fisher’s LSD (least significant difference) test. N = 5 animals for M/M-sham and +/+-sham (N = 5 each), M/M-stroke (N = 6) and +/+- stroke (N = 7). From each animal, one randomly picked section underwent the immunohistochemical procedure.
Prompted by a previous finding of increased striatal volume and in the contralateral hemisphere in BDNFM/M mice at 6 months post-stroke, 10 we sought to determine the effect of a BDNF SNP on stroke-induced TSPs expressions. Compared with WT mice, there was no noticeable increase in TSP1 mRNA levels in the BDNFM/M mice after stroke, where TSP1 mRNA shows a significant reduction in the ipsilateral hemisphere (Figure 1C). However, TSP2 gene expression was significantly increased in both hemispheres of BDNFM/M mice at 6 months after stroke, but not at earlier time points (Figure 1D). The upregulation of TSP2 gene expression was more pronounced in the contralateral hemispheres. The immunoreactivity of TSP1/2 revealed a widespread expression in cerebral cortex with stronger immunoreactivity in layer 2 of cerebral cortex (Figure 1E), and much less immunoreactivity in striatum (inset). Mean optical intensities of TSP in cortical layers 1 and 2 show a trend of increase in BDNFM/M stroke animals compared to BDNF+/+ stroke mice (Figure 1F). However, TSP immunoreactivity in layer 2 in BDNFM/M stroke mice showed significantly higher intensity than BDNF+/+-stroke mice when immunoreactivity in layer 4 was subtracted as the internal background (P < .05).
Increased α2δ-1 Expression in the Contralateral Hemisphere of BDNFM/M Mice 6 Months After Stroke
The gene expression profiles of α2δ-1, a neuronal receptor for TSPs, and PSD-95, an excitatory postsynaptic marker, were determined. Unlike TSPs, stroke-induced attenuation in the genes’ expressions of α2δ-1 and PSD-95 throughout the recovery phase spanning from 2 weeks to 6 months after stroke (Figure 2A and B). We found no significant differences in the expressions of α2δ-1 and PSD-95 in BDNF+/+ and BDNFM/M brains at early time points (2 weeks and 1 month post-stroke, data not shown). We further determined genotype differences in the expressions of α2δ-1 and PSD-95 at 6 months. In age-matched sham mice, we did not observe a genotype difference. In the stroked animals, α2δ-1 expression in the BDNFM/M mice was significantly elevated only in the contralateral hemisphere while PSD-95 mRNA levels were not differed among sham, post-stroke WT or BDNFM/M brains (Figure 2C and D). Furthermore, α2δ-1 protein expression was also increased only in the contralateral hemisphere at this time (Figure 2E and F), paralleling the α2δ-1 gene upregulation. The selective increase in the expression of α2δ-1 along with elevated TSP2 expression in the contralateral hemisphere suggests a potential shift of synaptic balance toward excitation in this nonstroked hemisphere of BDNFM/M mice.
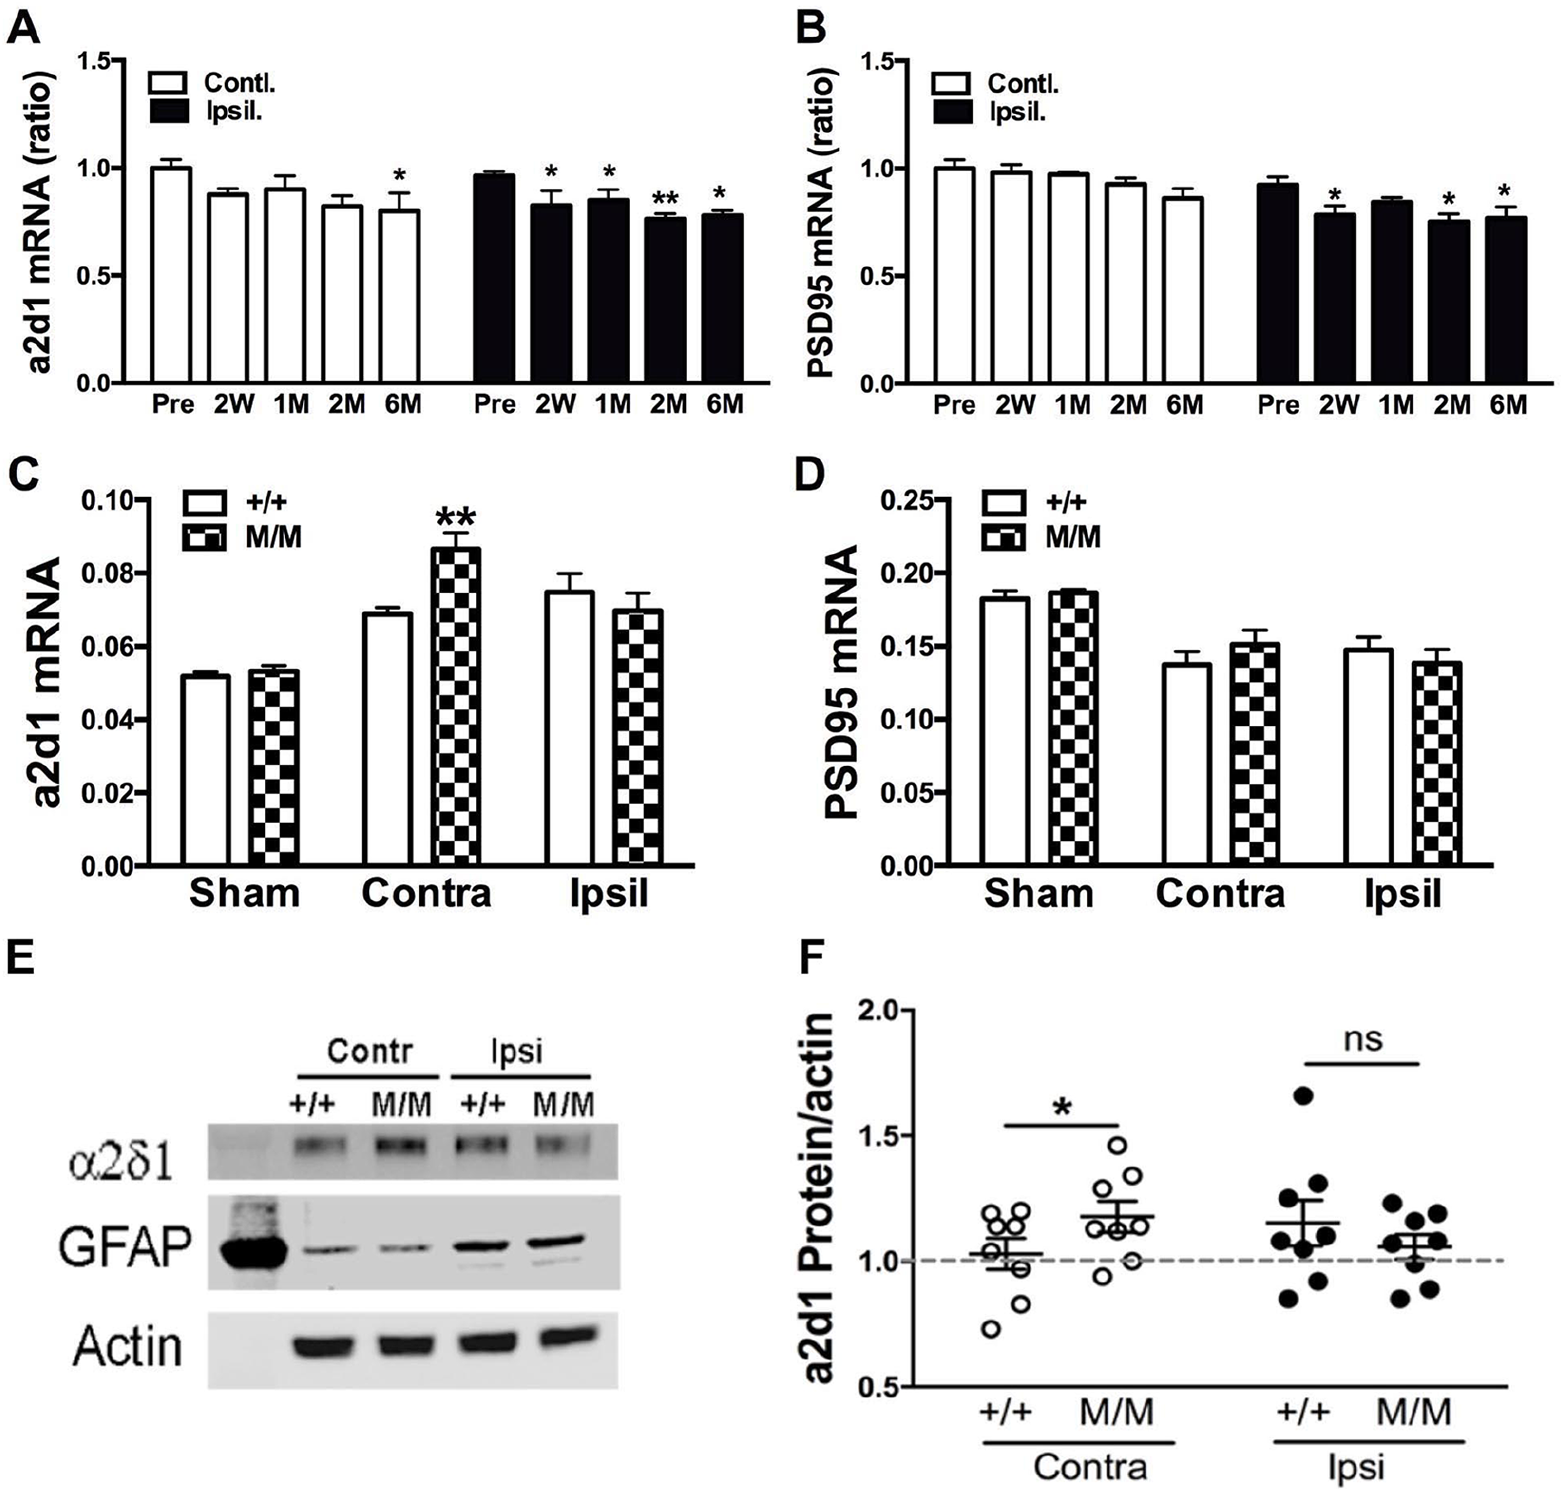
Expressions of α2δ-1 and PSD-95 in sham and post-stroke WT and BDNFM/M (WT, wild type; BDNF, brain-derived neurotrophic factor) mice. Panels A and B: Temporal genes expressions of α2δ-1 (A) and PSD-95 (PSD, postsynaptic density) (B) in the brain following middle cerebral artery occlusion (MCAO). mRNA levels in the contralateral and ipsilateral hemisphere were measured prior to stroke (Pre) and during stroke recovery phase (2 weeks to 6 months) and normalized by actin. Y-axis represents ratios of α2δ-1 and PSD-95 mRNA levels compared with baseline pre value. N = 4-5/time point, Student’s t test *P < .05, **P < .01 versus Pre. Panels C and D: α2δ-1 (C) and PSD-95 (D) mRNA levels in age-matched sham, and stroked WT and BDNFM/M mice 6 months post-stroke. N = 6-7/genotype, Student’s t test *P < .05, ***P < .01 versus +/+ (WT), M/M, BDNFM/M mice. Panels E and F: Expression of α2δ-1 protein in the brain of WT and BDNFM/M mice at 6 months after stroke. Expression was normalized to actin and expressed as ratios to sham (interblot control, indicated by dotted line). To normalize interblot variability, an identical set of samples was loaded in each blot as an internal control and the density of the internal standard sample was used to standardize samples in multiple blots. Wilcoxon, nonparametric test was used for comparison between WT (+/+) and BDNFM/M (M/M) mice. N = 8/genotype, contra, contralateral; Ipsi, ipsilateral.
Selective Increase in α2δ-1 Immunoreactivity in the Contralateral Cortical Layers 1/2 of BDNFM/M Mice
The selectively increased expression of TSP2/α2δ-1 in the contralateral hemisphere led us to determine the subregion specificity. Localization of α2δ-1 protein was assessed in the dorsolateral striatum, medial striatum, layer 5 of somatosensory cortex and layer 1 of somatosensory cortex in the contralateral hemisphere (Figure 3A). Optical density measurements revealed a significant (P = .031, Kruskal-Wallis mean rank difference = 8.943) and robust (101%) increase of α2δ-1 immunoreactivity in layer 1 of cortex of BDNFM/M stroke mice compared to that of BDNFM/M sham (Figure 3B). No difference was found in brain areas of WT mice. Layer 5 of cortex also exhibited an increase in the stroked BDNFM/M brains, relative to sham-treated BDNFM/M (74%) but this increase did not reach statistical significance (P = .07 Kruskal-Wallis mean rank difference = 7.343). Neither the dorsolateral nor the medial sectors of dorsal striatum revealed any genotype or treatment effect. Higher magnification confocal micrographs showed visible α2δ-1 immunofluorescence in layer 1 of cerebral cortex, with strong staining visible in cell bodies of layer 2 (Figure 3C).
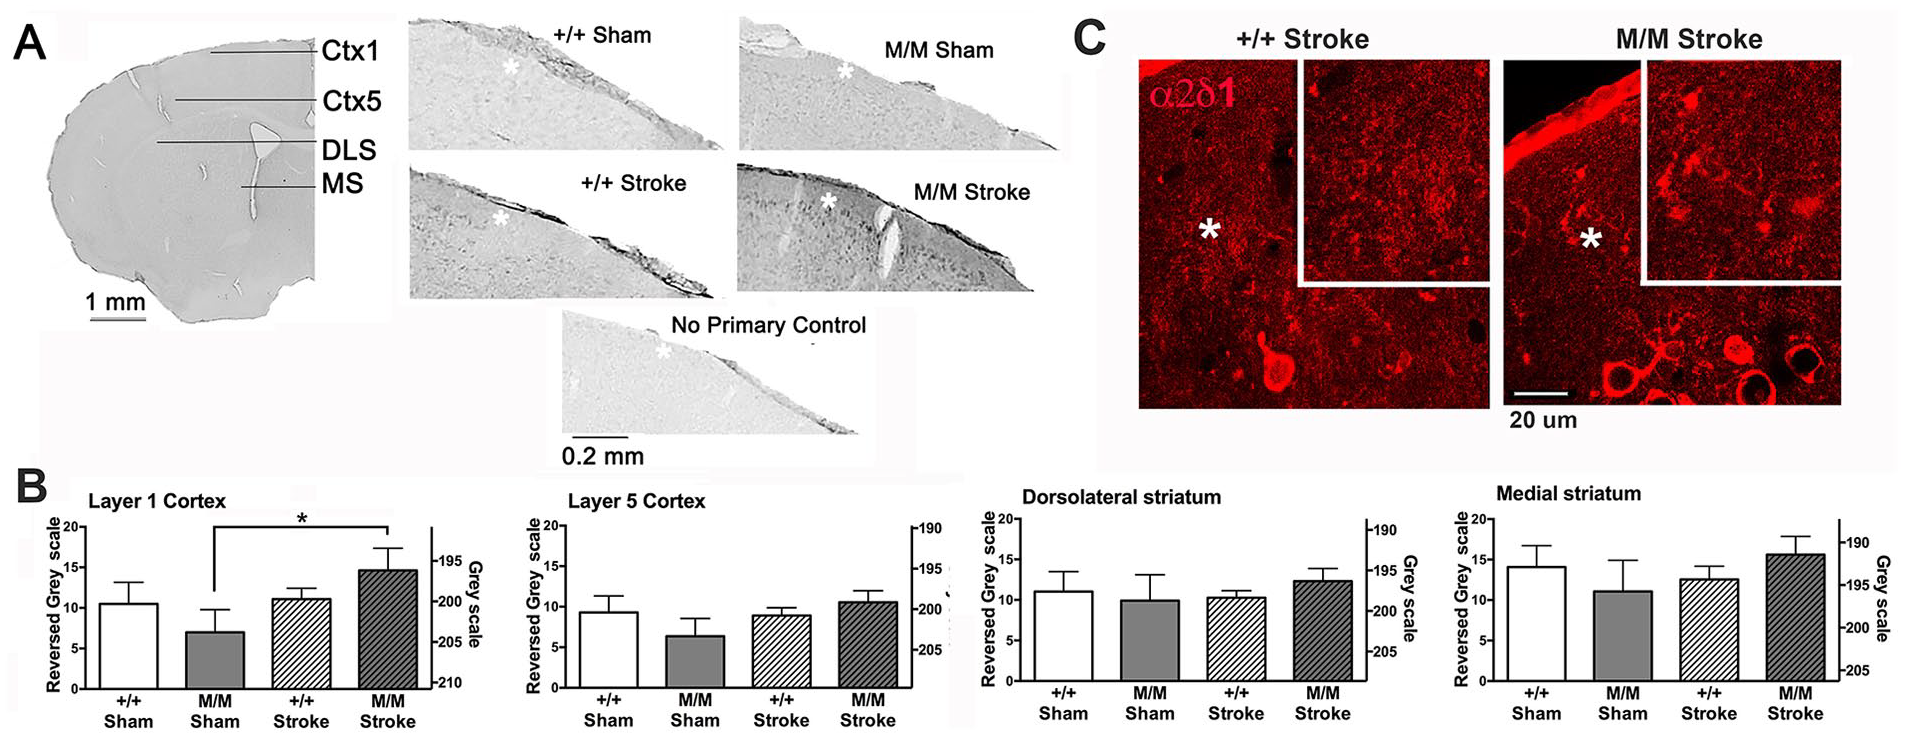
Light microscopic assessment of α2δ-1 immunoreactivity in the different brain regions of contralateral hemisphere in WT and BDNFM/M (WT, wild type; BDNF, brain-derived neurotrophic factor) sham and 6 months post-stroke mice. Panel A: Representative micrographs of a hemisections containing cerebral cortex layers 1 (Ctx1) and 5 (Ctx5), and the dorsolateral and medial striatum (DLS, MS) of a contralateral hemisphere of age-matched WT and BDNFM/M sham and stroke mice immunolabeled for α2δ-1 using silver-intensified gold (SIG) as the immunolabel. Portions of Ctx1 (white asterisks) of representative sections from the 4 groups are also shown. A portion of a section of an M/M sham animal that underwent an identical immunolabeling procedure but with the primary antibody omitted is shown at the bottom. A 100× (oil objective) immunofluorescent image of α2δ-1 in a BDNFM/M (M/M) stroke animal was captured using an inverted Nikon Eclipse Ti-U confocal microscope. The region shown is cortical layers 1 and 2, with cell bodies in layer 2. Panels in B show mean ± SEM (standard error of the mean) values of optical density measurements reflecting α2δ-1 immunoreactivity from each group, based on images detected using SIG as the label. Optical densities of dorsal striatum, medial striatum, layer 1 and layer 5 of overlying cerebral cortex were assessed using Image J’s rectangle selection of area to analyze the mean gray value under the tool, Histogram. Statistical analysis was performed for 4 brain regions separately. Gray scale values (right Y-axis) obtained from each brain region were assessed for each brain. The difference in the measured greyscale values from the background values obtained from primary antibody omitted sections was plotted using reversed gray scale (left Y-axis), whereby the background was set to equal zero. Multiple comparisons revealed a significant effect of BDNFM/M stroke brains in layer 1 of cerebral cortex, relative to BDNFM/M sham brains. No other region showed significant changes evoked by stroke or genotype. N = 5 animals for M/M sham and +/+ sham, N = 7 animals for M/M stroke and +/+ stroke. From each animal, one randomly picked section underwent the immunocytochemical procedure.
Increased Axospinous Excitatory Synapses in the Contralateral Cortex and Dorsal Striatum of BDNFM/M Mice
The increased α2δ-1 immunoreactivity in layers 1/2 of the cortex in BDNFM/M stroke mice led us to investigate potential increases of excitatory synapses in the contralateral hemisphere of BDNF SNP mice. EM quantification of the areal density of excitatory axo-spinous synapses in layer 1 revealed a small but nearly significantly greater spine density for the BDNFM/M tissue than of WTs that was recovering from stroke (8% increase, P = .055) (Figure 4C). Similarly, EM analysis of the areal frequency of axo-spinous excitatory synapses in dorsal striatum revealed a significantly higher spine density in BDNFM/M tissue than of WTs that were recovering from stroke (10% increase, P = .018) (Figure 4D). No genotype difference in the areal density of axo-spinous excitatory synapses was detected among the sham-treated animals.
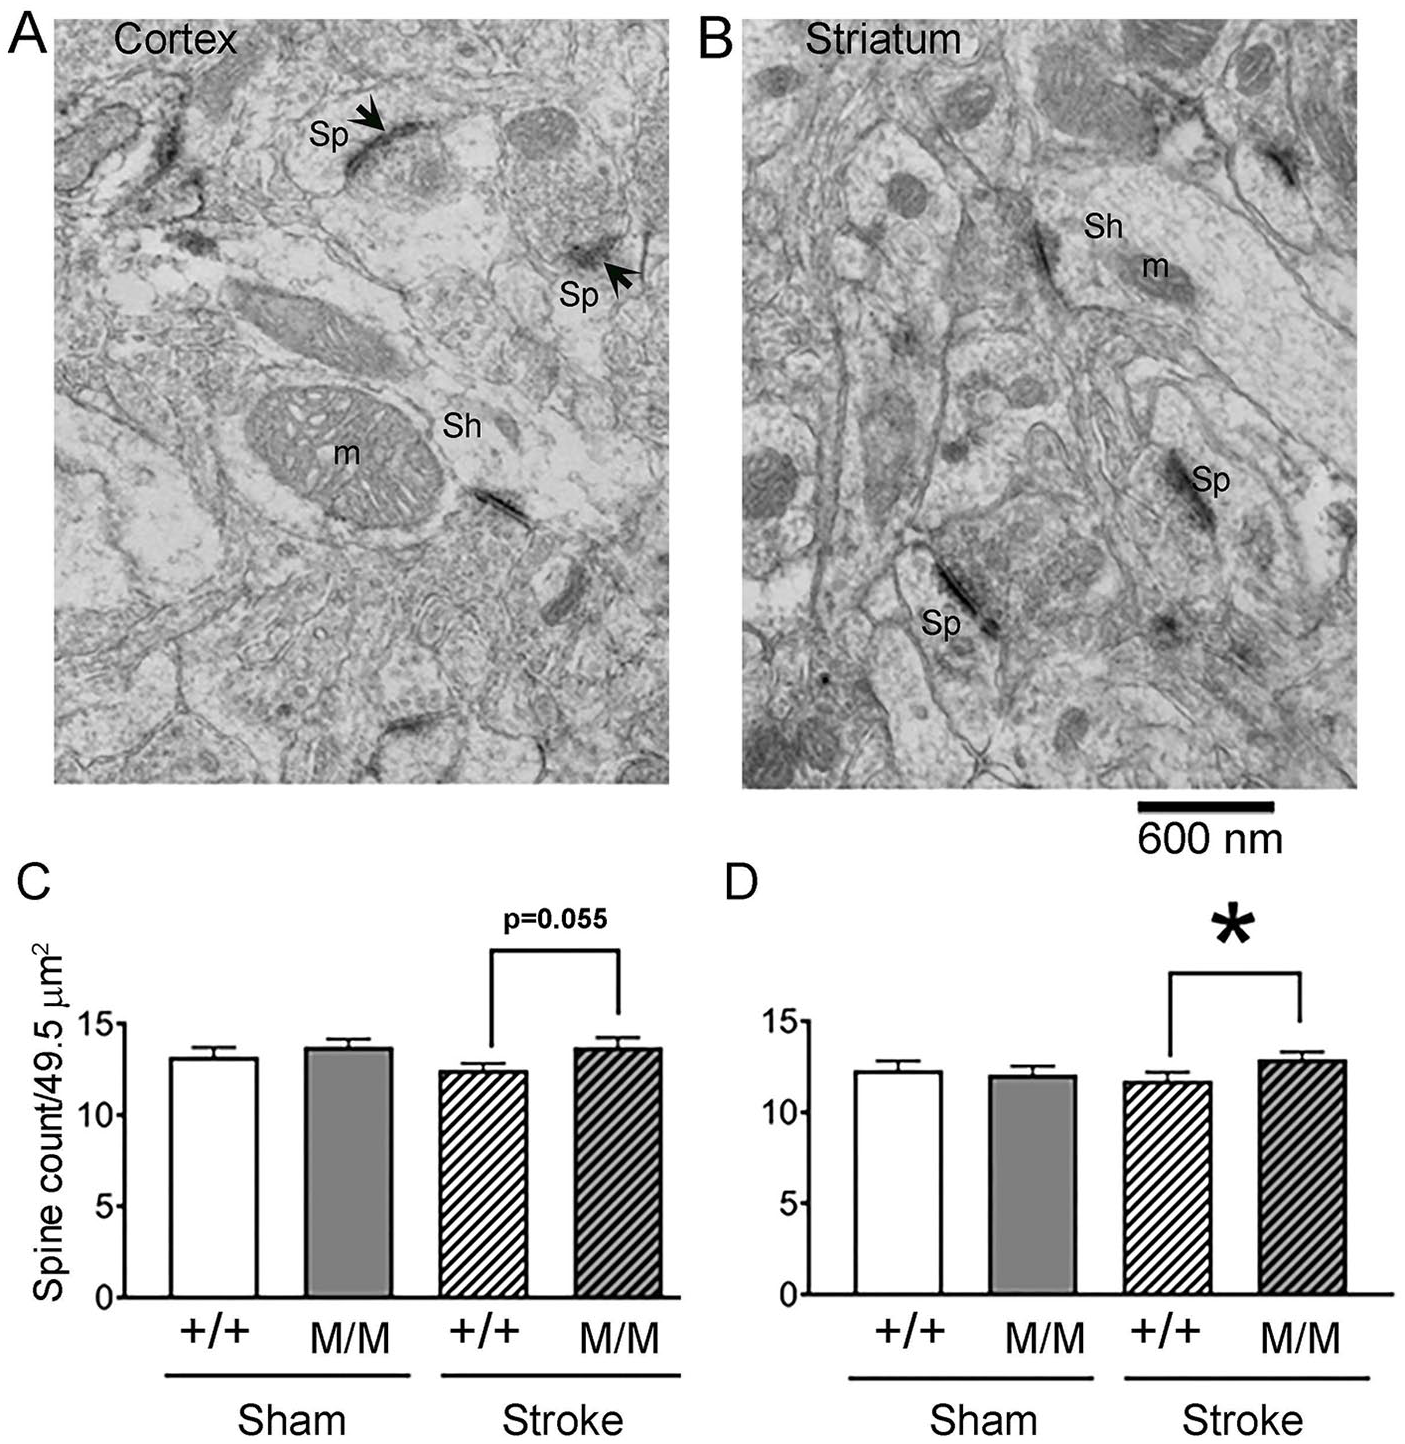
Spine counts per unit area in layer 1 of cortex and striatum. A and B: Representative electron micrographs taken from layer 1 of the cerebral cortex of WT (+/+) and BDNFM/M (M/M) sham or 6 months post-stroke animals. Excitatory synapses formed on spines (Sp) were identified based on thick postsynaptic densities (PSDs, arrows), and absence of mitochondria (m) and presence of presynaptic vesicles. The number of axo-spinous synapses per micrograph was counted. Excitatory synapses formed on shafts (Sh) were distinguished from axo-spinous synapses, based on the presence of mitochondria and were excluded from the quantification. C and D: Quantification of the average number of spines encountered per micrograph in the layer 1 of cerebral cortex (C) and the dorsolateral striatum (D). Areal densities of excitatory axo-spinous synapses, were analyzed in 5 micrographs per brain, each captured at a magnification of 20 000×, spanning a synaptic neuropil equal to 49.5 µm2. The bars represent the mean ± SEM (standard error of the mean) values of the 4 groups consisting of the genotype +/+, M/M and the treatments of sham versus stroke. P = .055 (+/+ stroke vs M/M stroke); asterisk represents P < .05. For both regions, N = 50 for each sham group (10 micrographs/animal × 5 animals) and N = 70 (10 micrographs/animal × 7 animals) for each stroke group.
Reduced GABAergic Innervation of Spiny Dendrites in Layer 1 and Cell Bodies of Layer 5 Pyramidal Neurons in Cortex of BDNFM/M Animals
Excitability of neurons is determined by the balance between inhibition and excitation. To investigate the possibility of enhanced excitability of cerebral cortical neurons due to reduced GABAergic inputs, GABAergic innervation of pyramidal cell bodies in layer 5 of cortex was assessed (Figure 5A-E). BDNFM/M animals showed significant reduction of GABAergic innervation at pyramidal cell bodies following sham, compared with WT sham (P = .0208) and similarly to stroked WT or BDNFM/M brains, indicating that the reduced GABAergic innervation is an intrinsic property associated BDNFM/M phenotype.
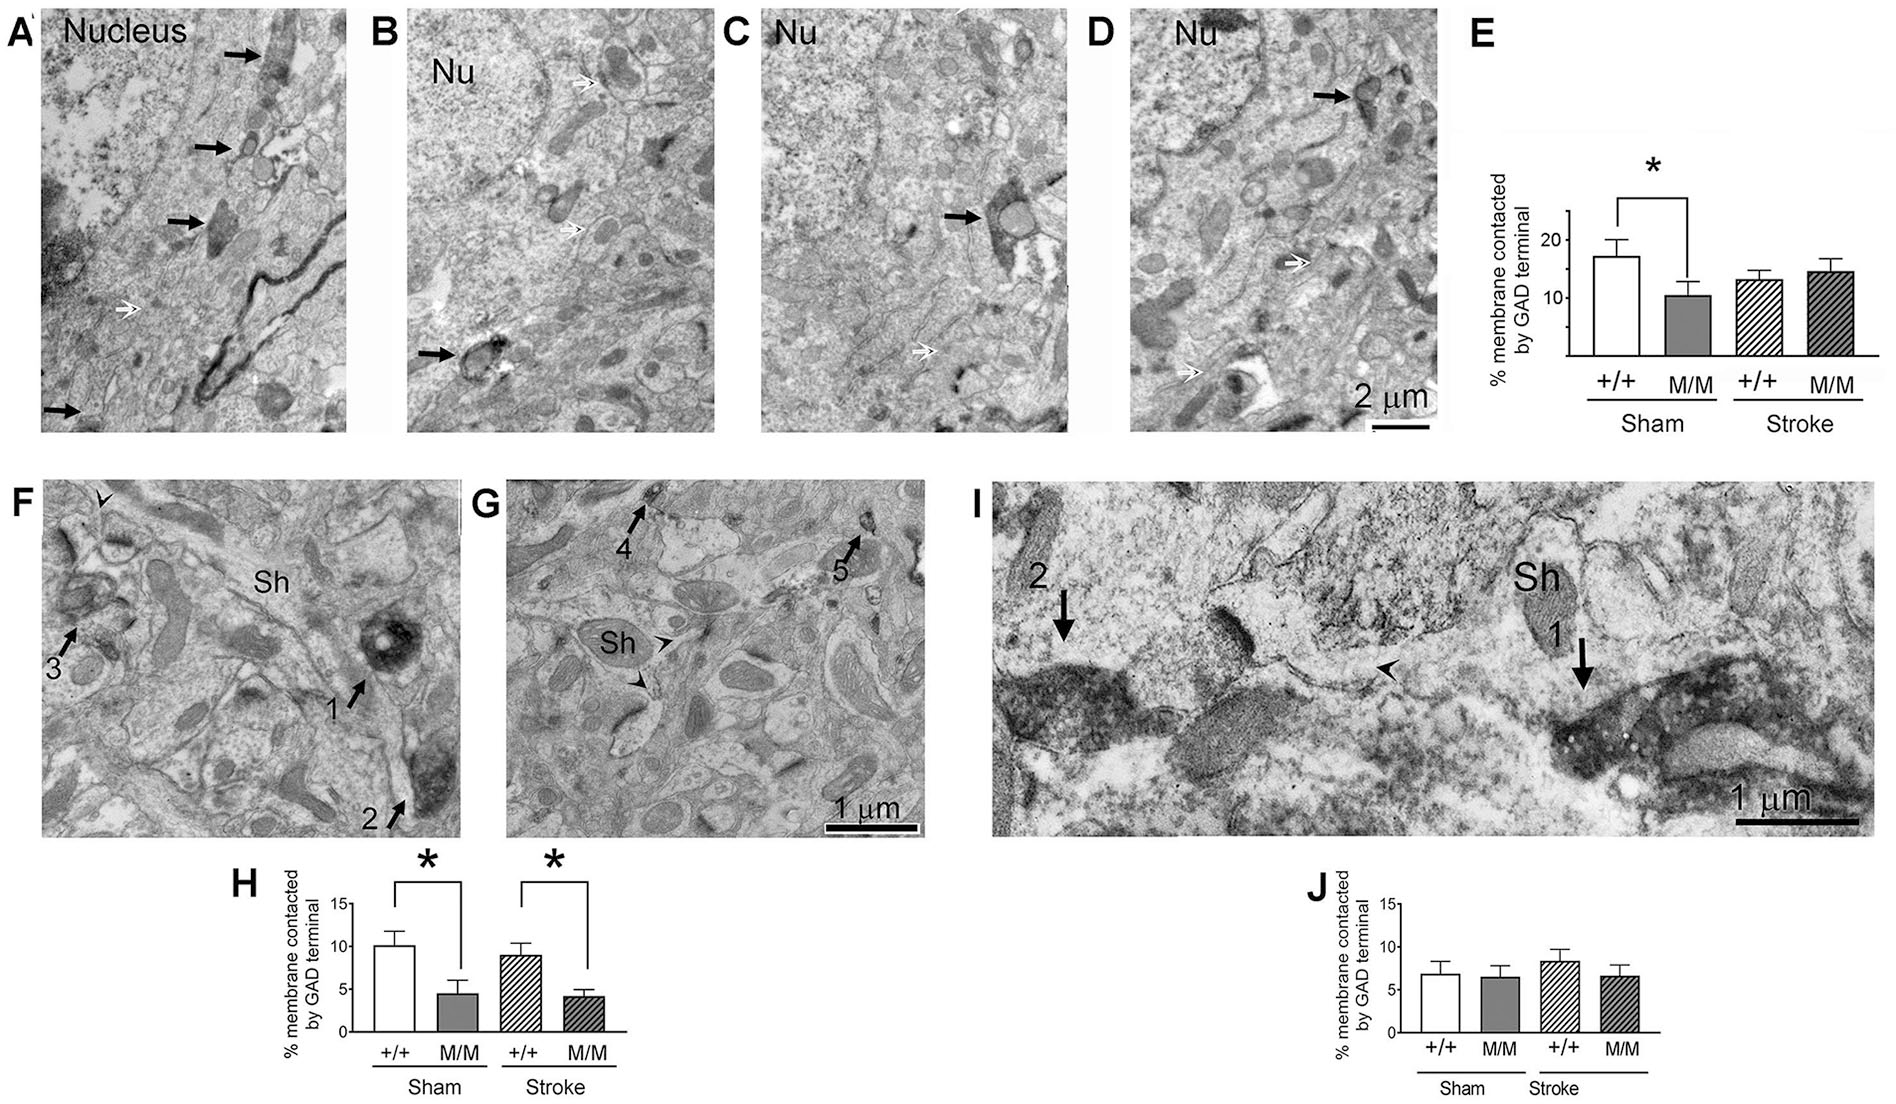
GABAergic (GABA, γ-aminobutyric acid) innervations of excitatory and inhibitory neurons in cortex and striatum were analyzed within brains of WT and BDNFM/M (WT, wild type; BDNF, brain-derived neurotrophic factor) sham and 6 months post-stroke mice. Three brain regions were analyzed: Layer 1 of cerebral cortex (for the analysis of inhibitory synapses onto spiny dendrites of pyramidal neurons), layer 5 of cerebral cortex (for the analysis of inhibitory synapses onto layer 5 pyramidal neurons’ cell bodies), and dorsolateral striatum for the analysis of inhibitory synapses onto medium spiny neurons (MSN). Panels A through D show representative GABAergic innervations of pyramidal cell bodies in layer 5 of cerebral cortex in age-matched WT and BDNFM/M sham and 6 months stroke mice. WT (+/+) sham (A), BDNFM/M (M/M) sham (B), WT stroke (C) and BDNFM/M stroke (D). Black arrows point to the plasma membrane that is postsynaptic to GABAergic terminals, indicated by the HRP-DAB reaction product reflecting immunoreactivity to GAD. Nu = nucleus. White arrows point to portions of the plasma membrane that are not receiving GABAergic synaptic input. Micrographs were taken at a magnification of 10 000×. E: Quantification of the percent of the plasma membrane of cell bodies contacted by GAD terminals in this region. Here and in other graph panels, asterisk indicates significance at *P < .05. The bars represent the mean ± SEM (standard error of the mean) values of the 4 groups consisting of the genotype WT (+/+) or BDNFM/M (M/M) and the treatments of sham versus stroke. N = 19 for WT sham (4 to 5 cell bodies per animal × 4 animals), 18 for M/M sham (4 to 5 cells per animal × 4 animals), 30 for WT stroke (4 to 5 cells per animal × 7 animals), and 31 for M/M stroke (4 to 5 cells per animal × 7 animals). Panels F and G show GABAergic innervation of spiny dendrites in layer 1 of cerebral cortex from WT (+/+, F) and BDNFM/M (M/M, G) 6 months post-stroke animals. Arrowheads indicate the points where spine heads connect to parent dendritic shafts (Sh). Arrows point to GABAergic axon terminals in the field, indicated by the HRP-DAB (horseradish peroxidase–3,3′-diaminobenzidine) reaction product reflecting immunoreactivity to GAD. Arrows 1 and 2 show direct contact between GABAergic terminals and spiny dendrites, while arrows 3, 4, and 5 show GABAergic terminals in the plane of section but without contact with the spiny dendrites. All micrographs were captured at a magnification of 20 000×, spanning an area equaled to 49.5 µm2. H: Quantification of the percent of the plasma membrane of spiny dendrites contacted by GABAergic terminals in this region. N = 50 for +/+ sham (10 dendrites per animal × 5 animals), 50 for M/M sham (10 dendrites per animal × 5 animals), 70 for +/+ stroke (10 dendrites per animal × 7 animals), and 70 for M/M stroke (10 dendrites per animal × 7 animals). Panel I shows a representative MSN from a WT stroke striatum receiving GABAergic innervations. The arrowhead indicates the point where the spine head connects to its parent dendritic shaft (Sh) that has been pseudo-colored light blue to enhance visibility of the MSN’s irregular contour within this electron micrograph. Arrows point to GABAergic terminals in the field, indicated by the HRP-DAB reaction product reflecting immunoreactivity to GAD. Arrow 1 shows direct contact between a GABAergic terminal and the MSN while arrow 2 shows a GABAergic terminal in the plane of the section but without visible contact with the MSN. The electron micrograph was taken at a magnification of 30 000×. Panel J shows quantification of the percent of the plasma membrane of MSNs contacted by GABAergic terminals in striatum. N = 50 for +/+ sham (10 dendrites per animal × 5 animals), 50 for M/M sham (10 dendrites per animal × 5 animals), 70 for +/+ stroke (10 dendrites per animal × 7 animals), and 70 for M/M stroke (10 dendrites per animal × 7 animals). For the assessment of the proportion of layer 5 pyramidal cell body plasma membrane contacted GABAergic axosomatic synapse lengths, 5 cell bodies per brain region per animal were analyzed. To assess the proportion of the plasma membrane of spiny dendrites in layer 1 and dorsal striatum that were contacted by GABAergic axon terminals, 10 dendritic profiles were sampled from each brain, using electron micrographs that were captured at a magnification of 25 000×.
The extent of GABAergic axon terminals forming inhibitory synapses onto dendrites of pyramidal cells was measured by using spines protruding from dendritic shafts to identify pyramidal cell dendrites (Figure 5F-H). There was a significant 45% reduction of the percent of the plasma membrane of spiny dendrites’ shafts contacted by GAD+ axon terminals in layer 1 of BDNFM/M sham mice, relative to WT sham mice (Figure 5H). For the stroke-treated animals, there was also a significant decrease by 47% in the extent of synapses formed by GAD+ axon terminals along dendritic plasma membranes of pyramidal neurons of BDNFM/M tissue, compared with WT tissue. Altogether, the increase of excitatory synapses, combined with the decrease of inhibitory synapses specifically in layer 1 of cortex suggests an overall greater excitability of cortical pyramidal neurons following stroke in BDNFM/M brain compared with WT.
GABAergic Innervation of MSN in Striatum Is Not Affected by the Genotype or Treatment
BDNF is synthesized by cortical neurons projecting to striatum but is not known to be synthesized by neurons in the striatum. As expected, the genotype BDNFM/M showed no effect on GABAergic innervation of MSNs in striatum, all of which arise from local inhibitory neurons or axon collaterals of MSNs located within striatum. Moreover, although the occurrence of excitatory synapses on MSNs was increased by the treatment of stroke of BDNFM/M animals, this treatment had no effect on the extent of GABAergic innervation of MSNs (Figure 5I and J). The increase of excitatory synapses without a change in inhibitory synapses would result in enhanced overall excitability of MSNs of BDNFM/M brains.
Discussion
Stroke induces changes in molecular expression, structural plasticity, and behavioral adaptation at acute, subacute, and long-term recovery phases. The temporal and spatial changes through multiple stages in chronic stroke suggest that a single molecule may exert differential effect(s) during specific stages of recovery, presumably through interaction with different molecules. Our previous study addressed the impact of the genetic variant of bdnf, val66met on stroke. The results showed that mice homozygous for the val66met allele (BDNFM/M) display a biphasic response: greater behavior impairment during the acute phase but better function during recovery phases compared to WT mice. 10 The observed spontaneous motor recovery starting at 2 weeks could be due to reestablishment of the excitatory/inhibitory balance within the direct pathways. On the other hand, reverberating excitatory input through the cortico-striatal-thalamic circuit depicted in Figure 6 may account for superior behavioral adaptation of BDNFM/M mice in the later, chronic phase. Prominent motor/gait improvement in ipsilesional limb during recovery was associated with elevated expression of vesicular glutamate transporters VGLUT1 and 2 and excitatory synaptic molecules in the contralateral striatum. 10 One aim of the current study was to assess whether the superior behavioral adaptation of BDNFM/M mice occurs through the expression of molecules that can boost the function of the excitatory cortico-striatal synaptic pathway within the less affected contralateral hemisphere. The significantly increased expressions of TSP1/2 were shown at 2 weeks and 2 months, but not at 1 month during recovery phase in WT stroke mice. The biphasic profile in the molecular expression within a complete context of stroke stages suggests that the acute neurotoxic and inflammatory milieu induced by stroke is replaced by a more permissive environment that facilitates the repair/recovery processes. Indeed, we demonstrated that BDNFM/M mice express higher TSP2 mRNA and TSP proteins in layer 2 of the contralateral cerebral cortex at 6 months of recovery from stroke, which is consistent with the greater ensheathment of synaptic clefts by astrocytes in layers 2/3. 34 This coincides with the increased expression of mRNA for its neuronal receptor α2δ-1, known to be an excitatory synaptogenesis agent. Moreover, LM- and EM-immunocytochemistry, together, revealed that the protein level is elevated detectably in layers 1/2 of cerebral cortex, which further demonstrates a sustained involvement of TSPs /α2δ-1 in a region-specific manner.
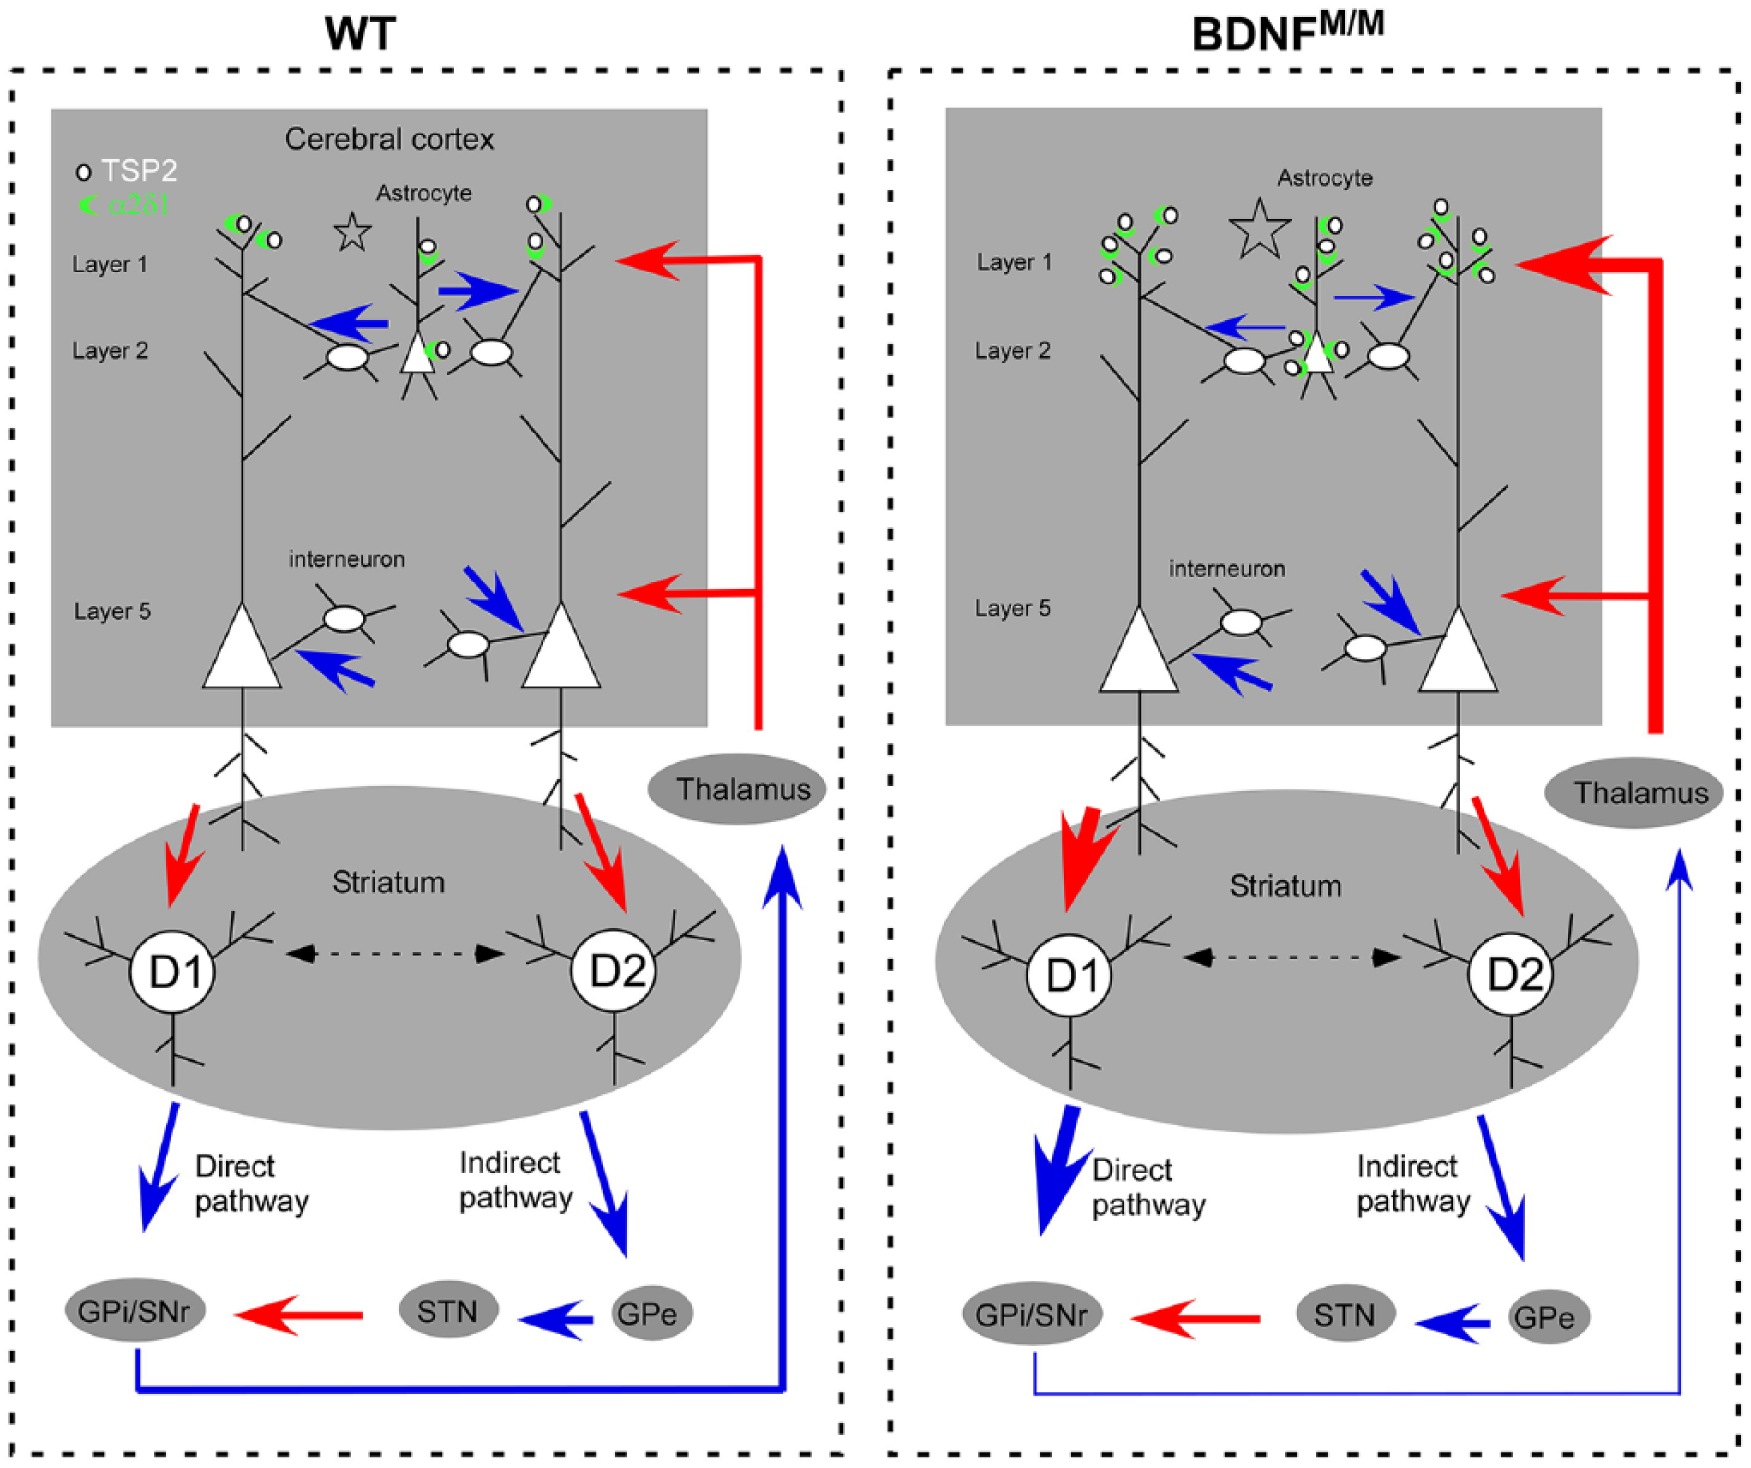
A proposed schematic diagram for the involvement of cortico-striatal pathway for behavioral adaptation during stroke recovery. The contralateral cortico-striatal drive favors a direct pathway in BDNFM/M which contributes to the improved motor function during long-term recovery. The thickness of lines indicates the strength of the connection (red arrow, excitatory glutamatergic; blue arrow, inhibitory GABAergic). Compared with WT mice following stroke, BDNFM/M mice exhibited synaptic changes reflecting decreased inhibition from interneurons (disinhibition, thereby excitation), together with augmented excitatory synaptogenesis in layers 1/2, supported by increased TSP2 expression from astrocytes and increased levels of TSP2 receptor α2δ-1 in layers 1/2 of cerebral cortex. In dorsal striatum, inputs from layer 5 pyramidal neurons form synapses with medium spiny neurons expressing dopamine D1 and D2 receptors, which partakes in the direct and indirect pathways, respectively. Enhanced excitatory input to dorsal striatum favoring the direct pathway which then inhibits inhibitory input to thalamus (disinhibition) could result in reverberating excitation of the circuit comprised of the cortico-basal ganglia-thalamo-cortical loop and promotes motor/gait function in BDNFM/M mice. The ventromedial thalamus relays input from substantia nigra pars reticulate 35 to cortex, specifically targeting layer 1. 36 The combined data demonstrated that the layers 1/2 of cortex as the major subregion for synaptic plasticity.
A second aim of the current study was to characterize the ultrastructural and synaptic bases for the enhanced compensatory motor function in these BDNFM/M mice following chronic stroke. Neuronal activity regulates BDNF secretion, which is important for synaptic plasticity.37-40 The balance between excitation and inhibition at the level of synapses is critical in processing sensory information, synaptogenesis, motor activity, and cognitive function.23,41-43 Imbalance between excitation and inhibition is implicated in neurological disorders44-46 and may be manifested immediately following stroke and during the recovery phase from stroke. In this study, the use of BDNFM/M that exhibits selective impairment of activity-dependent, but not constitutive BDNF bioavailability allowed us to address the role of activity-dependent BDNF release in synaptic plasticity during the delayed recovery phase following stroke. Previous studies showed that activity-dependent bdnf transcription promotes inhibitory synapse maturation and sets the network-level adaptation for synaptic balance.47-49 Thus, BDNFM/M mice with reduced stroke-induced BDNF secretion may have led to the reduction of inhibitory synapses that we detected, yielding a shift toward increased excitatory-to-inhibitory synapse balance onto pyramidal cells in cortex as late as 6 months post-stroke.
Although biochemical and LM analyses of brain regions preclude assessments at the cellular and synaptic levels, our rigorous EM data align well with the biochemical and LM data: indeed, we demonstrated that excitatory synapses onto excitatory pyramidal cells were greater in layer 1 of the cerebral cortex of BDNFM/M mice that underwent stroke, compared with the level seen for WT littermates. This supports the idea that the augmented level of TSP2/α2δ-1 within cortex promoted synaptogenesis following stroke, especially by excitatory pyramidal cells of BDNFM/M cortex. We propose that the overall excitation of the cortico-striatal pathway may underlie enhanced functional recovery in chronic stroke of BDNFM/M mice. The findings indicate that layers 1/2 of cortex is one main site of synaptic plasticity exhibiting shifts in synaptic balance toward greater excitation in the contralateral striatum of BDNFM/M mice at 6 months post-stroke.
A number of studies have shown that somatosensory cortex,50,51 the cerebral cortical region that we analyzed, participates in motor learning in this study. It was demonstrated that the somatosensory cortex of mice plays an important role in forelimb motor adaptation, such as updating motor commands as needed in order to reduce error of an acquired motor skill involving pulling of a joystick. 52 It is likely that the challenge of regaining gait following stroke demands update of motor commands involving synaptic plasticity of the somatosensory cortex that is then propagated to plasticity of the cortico-striatal pathway. In support of this idea, we showed that cell bodies of layer 5 pyramidal neurons, which are the population of pyramidal neurons in somatosensory cortex that project to striatum, receive less GABAergic innervation, indicating increased excitability of these cells and increased cortico-striatal drive.
The striatum is a major subcortical structure for activity-dependent synaptic plasticity 53 and also important for motor learning related to rotarod performance, as the mice lacking the excitatory receptor subunit NMDAR1 in the striatum exhibit disrupted motor learning and synaptic plasticity in the striatum. 54 Therefore, we predicted that striatum would be the subregion that upregulates excitatory markers in the contralateral hemisphere of BDNFM/M mice. However, synaptic plasticity is a basis for alteration of neuronal circuitry and functions, not restricted to discrete brain regions, such as the striatum. The excitatory afferents from cortex and thalamus project to striatal interneurons and MSNs. 55 These striatal neurons form the direct and indirect connections. 53 The direct pathway provides information on movement planning, initiation and motor sequence selection, which facilitates movements. The indirect pathway suppresses movements that would conflict with ongoing selected movements. 56 The enhanced motor/gait function in BDNFM/M mice post-stroke suggests that the direct pathway may be more involved (Figure 6). The enhanced output of inhibitory MSNs in the striatum may exert excitatory motor signal through ventromedial thalamus,35,36 thereby intensifying excitation through the cortico-striatal-thalamic pathway. This view is consistent with the known role of inhibitory basal ganglia circuit for inducing excitatory signal from thalamus to cortex. 57 In particular, since the ventromedial thalamic input to cortex is predominant in layer 1,36,58 the increase specifically in layer 1 of both excitatory synaptogenesis and α2δ-1-immunoreactivity provides further support for the view that the direct pathway from basal ganglia is more involved than the indirect pathway. Future electrophysiology studies will address whether the cellular and molecular changes that we detected indeed reflect enhanced synaptic activity in the direct pathway.
In summary, increased expression of excitatory synaptic markers TSP2 and α2δ-1 in the BDNFM/M mice is associated with superior functional recovery from stroke. Systematic analyses of excitatory and inhibitory synapses in subregions of contralateral hemisphere revealed that stroke increased α2δ-1 immunoreactivity, more excitatory synapses and less inhibitory synapses in layers 1/2 of cortex, indicating layers 1/2 of contralateral cortex to be a main site for synaptic plasticity. In the striatum, there is an increase in excitatory synapses with no changes in the inhibitory synapses, yielding a synaptic circuit that is overall more excitable. An increase in excitatory-to-inhibitory ratio in cortico-basal ganglia pathway may underlie the enhanced functional recovery of ipsilesional limbs in BDNFM/M mice, suggesting the importance of neural circuit for behavior adaptation in recovery function in neurological disorders.
Footnotes
Acknowledgements
We thank E. Ivanova and Structural and Functional Imaging Core at the Burke Neurological Institute for the technical assistance.
Declaration of Conflicting Interests
The authors declared no potential conflicts of interest with respect to the research, authorship, and/or publication of this article.
Funding
The authors disclosed receipt of the following financial support for the research, authorship, and/or publication of this article: Funding sources: National Institute of Health awards, NINDS R01NS077897 (SC), R01NS095359-10 (SC), and the Burke Foundation (SC), R01 DA038616 (CA), R21MH105846 (CA), P30 EY13079 (CA).