
Abstract
Objective. Stroke recovery is a multidimensional process influenced by biological and psychosocial factors. To understand the latter, we mapped the social networks of stroke patients, analyzing their changes and effects on physical function at 3 and 6 months after stroke. Methods. We used a quantitative social network assessment tool to map the structure and health habits embedded in patients’ personal social networks. The physical function outcome was determined using the National Institutes of Health (NIH) Patient-Reported Outcomes Measurement Information System (PROMIS) Physical Function Scale (0-100, mean 50 for US general population). We used mixed-effects models to assess changes in social network metrics. We used multivariable models to test the association between social networks and physical function, independent of demographics, socioeconomic status, clinical characteristics, comorbidities, cognition, and depression. Results. The cohort consisted of 172 patients, with mostly mild motor-predominant stroke (median NIH Stroke Scale of 2) with retention of 149 at 3 months and 139 at 6 months. An average patient’s network over 6 months contracted by 1.25 people and became denser and family oriented. Network composition also became healthier with pruning of ties with people who smoked or did not exercise. The baseline network size, and not density or health habits in the network, was independently associated with 3- and 6-month physical function PROMIS scores. Patients embedded in small kin-based networks reported more negative social interactions. Conclusions. Despite social networks becoming smaller and close-knit after stroke, they also become healthier. Larger baseline social networks are independently associated with better patient-reported physical function after stroke.
Keywords
Introduction
Participating in life’s activities after stroke often depends on a patient’s social milieu. 1 For example, a patient with hemiplegia is more likely to attend community events if he has a large and connected group of social contacts who can coordinate care. Major guidelines such as the International Classification of Functioning, Disability, and Health recognize the important role of the social environment in people’s functioning. 1 Stroke, in particular, can disrupt social life more than other disorders.2,3 Therefore, consideration of social factors in stroke rehabilitation is an unmet need and opportunity.
Here, we build on a biopsychosocial model of stroke recovery. The model highlights the interplay of emotional sustenance, active coping assistance, 4 neuroplasticity, 5 and neuroendocrine and immune functions. 6 At least 30 years of research show that higher levels of social support are linked with better outcomes in cardiovascular disease. 7 In stroke, increased social support is associated with faster and more extensive functional recovery. 8 Conversely, social isolation in stroke survivors had an odds ratio of 1.4 in predicting recurrent stroke, myocardial infarction, or death within 5 years. 9 Basic science studies in animals and humans show that the social environment influences neuroplasticity and neurogenesis, including direct effects on angiogenesis, dendritic remodeling, and inflammatory cascades.5,10,11 These findings support the contention that the social determinants of health are “the most significant opportunities for reducing death and disability from cardiovascular disease.”7(p874)
In this study, we use social network mapping to quantify the social environment of stroke survivors. The mapping procedure identifies the specific persons in a patient’s social world one by one, their links to each other, and health-related characteristics. 12 Both here and in prior studies, we have demonstrated that this protocol may be feasibly deployed in clinical settings.13,14 With a long tradition in the social sciences, where it is known as egocentric network analysis or personal network analysis, 15 this approach is novel to stroke recovery research. Prior work on social factors in stroke have used summative scales to provide a single metric of social support or integration. In contrast, social network mapping produces a visual social network graph with quantitative metrics of the structure, content, and function of social ties.
We used social network mapping to longitudinally characterize stroke survivors’ personal social networks over 6 months. Second, we examined the association of social network metrics to a granular measure of patient-reported physical function. Finally, we analyzed qualitative data to understand the mechanisms of social network dynamics. These findings reveal detailed patterns of social environment evolution and influence in stroke recovery.
Methods
Study Design
The study was a multicenter, prospective, longitudinal cohort study of patients with mostly mild, motor-predominant, first-time ischemic stroke without marked cognitive impairment. The primary aims were to characterize social network changes after stroke and to determine the association of social network variables with physical function at 3 and 6 months. To achieve these aims, we recruited consecutive patients from 2 academic hospitals, Barnes Jewish Hospital in St Louis and Brigham and Women’s Hospital in Boston, between May 2014 and May 2017. We completed in-person clinical and social network evaluations at the time of enrollment. We completed follow-up assessments at 3 and 6 months on the phone to determine social network change and physical function outcomes. We gave small incentives ($20-$40) after each assessment to encourage continued participation.
The institutional review boards at each site approved the study protocol. All patients provided informed consent to participate in the study. Data can be made available on request with a data sharing agreement.
Participants
We enrolled consecutive patients during their hospitalization if they were (1) diagnosed with a first ischemic stroke, (2) 21 years old or older, (3) within 7 days of clinical stroke, and (4) recommended for inpatient rehabilitation or home with services. The 7-day timeframe, instead of weeks to months, was chosen to establish a reasonable baseline before there are effects of the stroke on social networks. Patients were excluded if they had any of the following: (1) prior ischemic or hemorrhagic stroke, (2) National Institutes of Health Stroke Scale (NIHSS) score >21, (3) significant aphasia (score >1 on the language section of the NIHSS), (4) inability to speak English, (5) lack of capacity to consent or participate in the survey interview, or (6) diagnosis of dementia or Short Blessed Test score >6.
We chose this population because they were able to participate in the survey with low anticipated dropout allowing the best chance to measure social networks over time. Patients with hemorrhagic stroke were excluded because of the stroke’s different mechanism of insult that could lead to different recovery trajectories and outcomes. 16 Patients with aphasia were excluded because such patients could not validly and reliably complete the questionnaire. We did not use caregiver proxy because the instrument had not been validated for proxy report. Patients who were included in the study had no history of prior stroke or cognitive deficits that may have affected the social networks prior to enrollment. This allowed better interpretations to be prospectively drawn on stroke, networks, and outcomes. Finally, patients recommended to rehabilitation are a target group who have the capacity to improve.
Social Network Evaluation
A trained study coordinator administered the social network survey in person between the second and fifth day of the stroke hospitalization and then at 3 and 6 months over the phone. The instrument was an adaptation of the General Social Survey, 17 a validated national instrument. The main sections were a name generator, name interrelater, and name interpreter. In the name generator, participants named people with whom they had discussed important matters, socialized, or sought health-related support in the past 3 months. Specifically, we asked the following questions: “1. From time to time, most people discuss important personal matters with other people. Looking back over the last 3 months, who are the adults with whom you discussed an important personal matter? 2. From time to time, people socialize with other people. For instance, they visit each other, go together on a trip or to a dinner. In the last 3 months, who are the adults with whom you usually do these things? 3. Are there any other people not mentioned who do these supportive actions?” “These” referred to social and health supportive actions discussed in a prior question.
In the name interrelater, participants determined the connections among all persons in the network and evaluated the strength of the relationship ties. In the name interpreter section, participants answered questions about the characteristics and health habits of each individual in the network. Specific question forms have been previously published,8,9 and instrument psychometric properties have been described by Burt. 17 This tool was chosen over other summary metrics (eg, Lubben Social Network Scale) because it offered in-depth phenotyping of the social network structure and health milieu surrounding the patient.
Network structure is a quantitative description of the arrangement of social ties in a patient’s social surround. Network size is defined as the number of individuals in the network, excluding the patient. Density is the number of direct actual connections divided by the number of possible direct connections in a network. Similar to density, constraint is the degree to which each network member is connected to the others in the network, with additional benefits of incorporating hierarchies and strength of ties. 18 For example, a patient has a high-constraint network if each network member is strongly connected to all the others, leading to a close-knit social structure. A patient has a low-constraint network if there are subgroups of friends who are not known to the other subgroup and individuals are less familiar with each other. Effective size is the number of nonredundant members in the network, conceptually an inverse metric of constraint. 18 Mean degree is the average number of ties of a network member, excluding the patient, indicating the distribution of ties in the network. Equations to calculate these measures are provided in Supplement 1.
Network composition refers to the mix of characteristics and health habits of the persons in the network. For example, percentage kin is the percentage of persons in the network who are family. The SD of network members’ age reflects the range of ages of people in the network around the patient. The diversity of sex index (or the index of qualitative variation) represents the mix of men and women in the network with a value of 0 meaning all network members are one sex and a value of 1 indicating equal mix of men and women. 19 Likewise, diversity of race is the mix of races in the network, with a value of 0 indicating that all persons were of the same race. The mix of health habits in the network represents the health behavior environment around the patient. For example, the percentage of network members who do not exercise is the number of individuals who do not exercise divided by total number of persons described.
Physical Function Evaluation
The main physical function outcome was a standardized patient-reported outcome of physical function, a measure that has distinct advantages in stroke patients.20,21 Known as the NIH Patient-Reported Outcomes Measurement Information System (PROMIS) Physical Function Scale, it is a nationally validated, computer adaptive testing system to measure self-reported health in patients across a range of chronic diseases and demographics. 22 Scores from the US general population have a normal distribution with a mean score of 50 and SD of 10. The advantages of the PROMIS is that it is a continuous outcome that maps well on traditional categorical stroke metrics (eg, Modified Rankin Scale), but it has better precision, reduced ceiling and floor effects, and less participant burden. We chose it for this study to delineate differences in functional status among mild stroke patients that would be lost by using less-sensitive metrics.
Statistical and Qualitative Analyses
We planned analyses to assess (1) change in network characteristics and contributing factors over 6 months after stroke, (2) relationship of baseline and change of network characteristics to PROMIS scores at 3 and 6 months, and (3) mechanisms from qualitative analysis to explain how and why social networks change after stroke.
For aim (1), we examined the change for each network variable from baseline to 3 months to 6 months. First, we assessed the baseline distributions for each network variable at each time point, and then, we created change scores of the variables for each patient. We assessed statistical significance of change score trends over time by using a Wilcoxon signed-rank test. We also analyzed the turnover of network members with attention to their health habits, examining whether joiners or leavers were the primary drivers of the overall trends.
We adjusted for time from stroke, age, sex, NIHSS score, black race, years of education, marital status, median income, Patient Health Questionnaire (PHQ-9) depression score, Short Blessed Test cognition score, and Charlson Comorbidity Index. These potential covariates were determined based on prior literature describing factors that may influence network change or stroke recovery.18 -21
To account for correlations among repeated measures of outcomes in the same participant, linear mixed models were used to estimate the time trend or slope of network variables over time. 23 The model was based on the repeated option of SAS PROC MIXED with an unstructured correlation structure. The primary covariate was time of follow-up, and the parameter term associated with this covariate signified the slope of each network feature as follows:
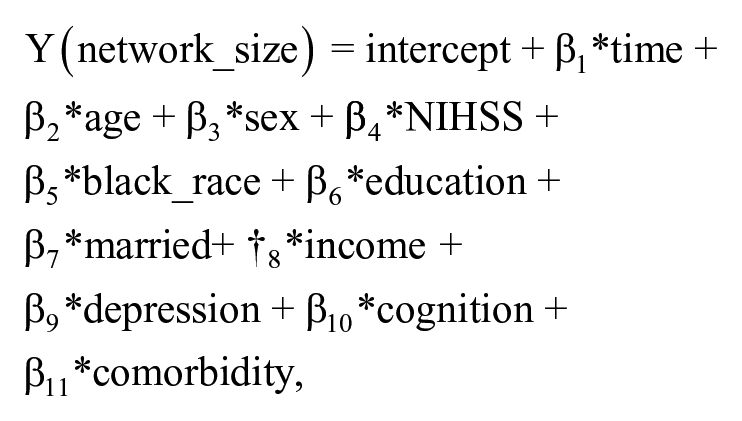
where “Y” is the network size slope after stroke, “time” is the follow-up time, and each of the covariates is described. “β1” Is the estimated change in social network size per month and “β2” through “β11” the estimated change in network score arising from the individual covariate. This procedure was done for each of the network variables. In model building, we sequentially added groups of potential confounders. Each of these blocks was tested one by one to avoid overfitting. Time, age, NIHSS, years of education, income, depression score, cognition score, and comorbidity index were added as centered continuous variables. Sex, race, and marital status were added as categorical variables. We also considered interaction terms among each factor and time in the model. However, none of these was statistically significant, so we report only on the main effects of these characteristics.
For aim (2), the goal was to determine the relationship of network features to PROMIS physical function scores at 3 and 6 months. We hypothesized that network structural features (eg, size, constraint) would be related to physical function independent of typical covariates involved in stroke recovery. To test this hypothesis, we first used Spearman correlation and univariate linear regression to assess the individual correlations of network variables and PROMIS outcomes. Next, we used multivariable analysis and mixed-effects models to determine the association between the strongest social network variables and PROMIS outcomes, after adjusting for the previously mentioned covariates. Finally, we performed sensitivity analyses to assess the impact of the missing data, examining any differences in patients who were retained in the study versus those who were lost to follow-up and also differences by site. All P values were 2-tailed. SAS version 9.3 (SAS Institute, Inc, Cary, NC) and R version 3.3.3 were used for quantitative analyses.
For aim (3), we conducted qualitative analyses to examine mechanisms of the social network trajectory change. All patients who took part in the study were offered the opportunity to participate in the optional qualitative interviews. Participants were given an additional $20 if they agreed. We conducted semistructured interviews to qualitatively examine the social network changes in 25 participants at 3 months and 24 participants at 6 months; 23 participants were from Barnes Jewish Hospital and 2 were from Brigham and Women’s Hospital. All interviews were transcribed. Using the framework method, 24 first, we read and reflected on all interviews; second, we coded recurrent ideas; third, we grouped ideas into themes and formalized these into a framework and coding index; and finally, we applied the agreed-on index to all transcripts. Major themes that emerged were types of social support, positive and negative social interactions, and functions and roles of network members. Finally, we examined the relationship of the qualitative themes with quantitative patterns. Two investigators independently coded transcripts, agreed on the coding index, and discussed any disagreements. Comparison of codes showed high consensus (percentage agreement = 93%).
Results
Participant Characteristics
We enrolled 172 patients and retained 149 (87%) at 3 months and 139 (81%) at 6 months. Figure 1 shows a flow diagram and reasons for dropout; the most common reason was loss of contact after multiple attempts. Importantly, there were no differences in demographic, clinical, or social network features between persons who were lost to follow-up and those retained in the study (Supplement 2).
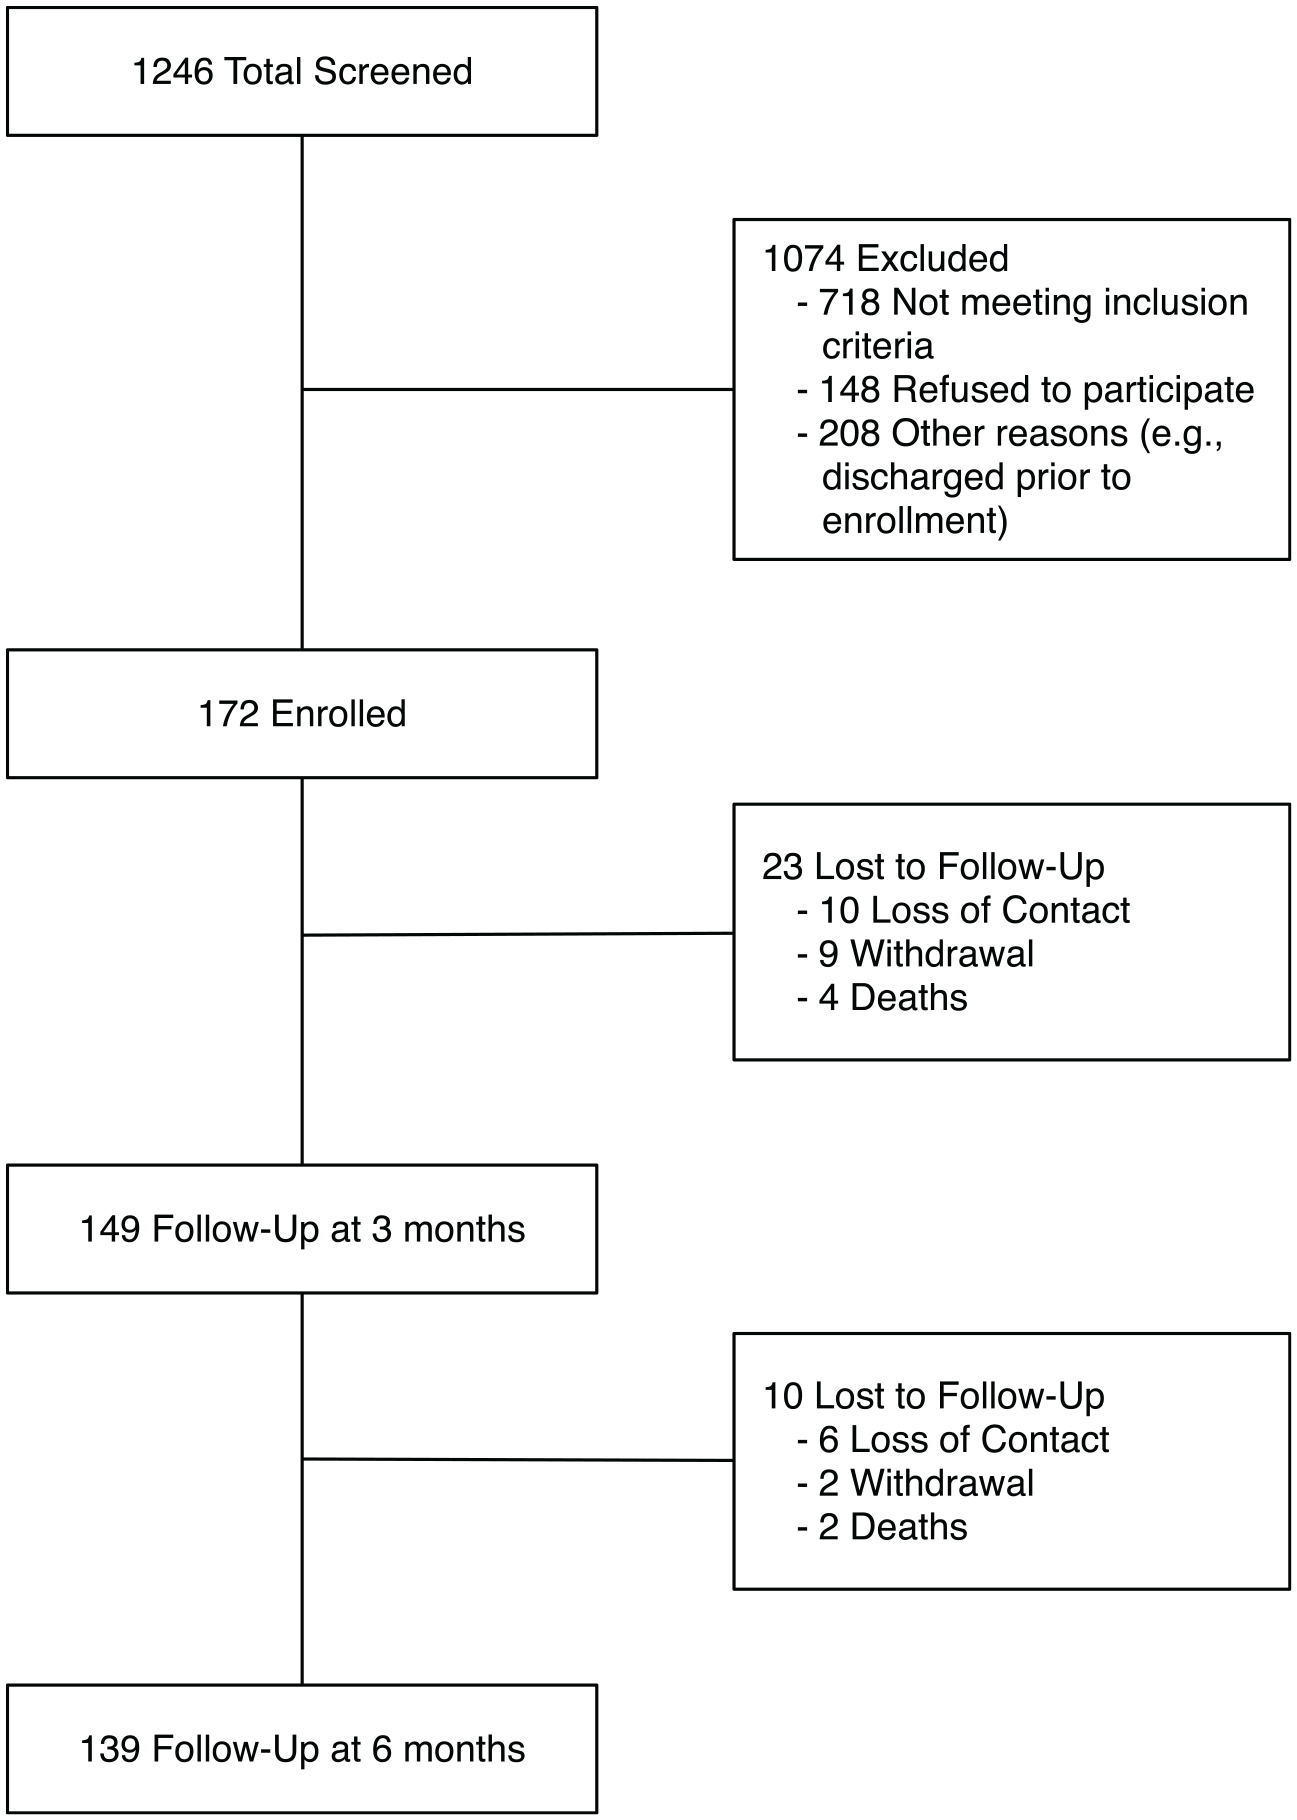
Flow diagram of patients.
At baseline, the cohort was well balanced in gender (49% were male) and race with regard to white and black or African American (66% white and 31% black or African American; Table 1). Although not nationally representative, the distribution of gender and race is consistent with patients who have a stroke in the United States. 25 Clinically, the majority had mild motor-predominant stroke, with median NIHSS equal to 2 (range 0-13); 64% were right hemisphere, 42% were subcortical, and 4% of patients had aphasia. There were low rates of comorbidities, cognitive impairment, and depression, which make preexisting network changes caused by these issues less likely.
Baseline Characteristics of Participants.
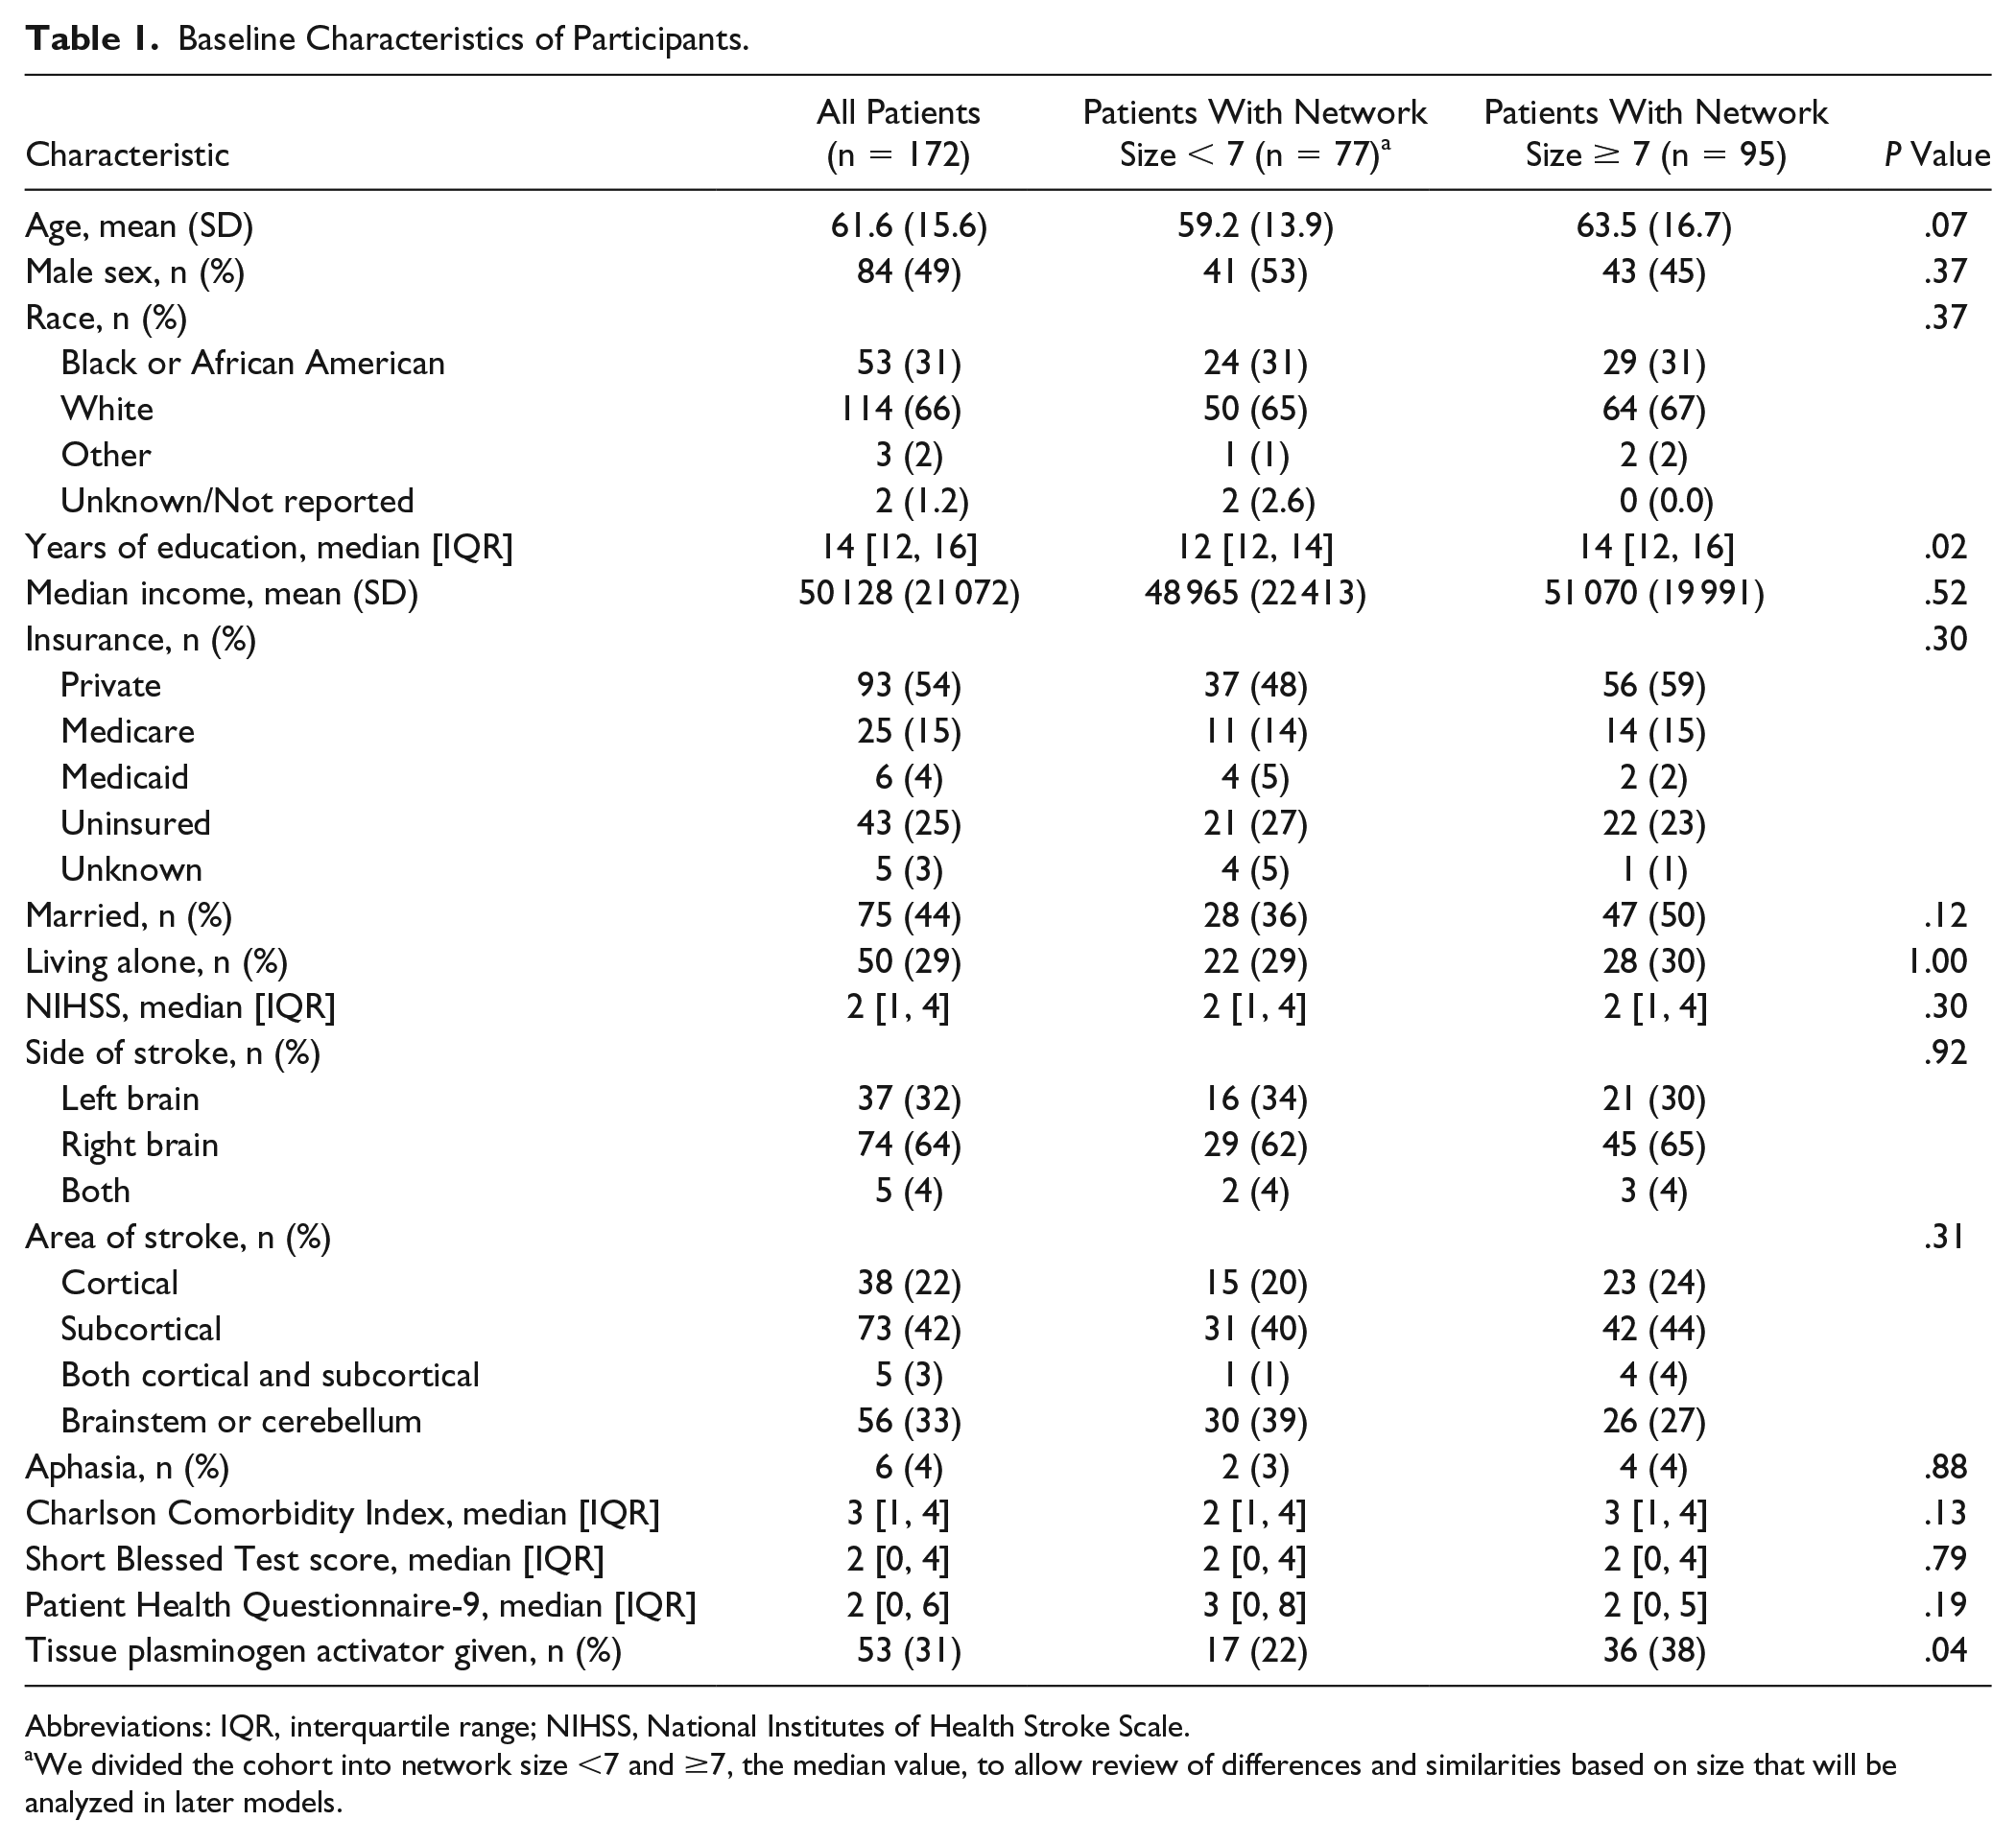
Abbreviations: IQR, interquartile range; NIHSS, National Institutes of Health Stroke Scale.
We divided the cohort into network size <7 and ≥7, the median value, to allow review of differences and similarities based on size that will be analyzed in later models.
Baseline network metrics included average size 7.77, density 0.79, and constraint 51.74. Metrics were similar to a nationwide sample using the same instrument in a younger population. 13
Social Network Change From Baseline to 6 Months
Social networks contracted over time according to both the aggregate mean and the change score per individual (Table 2). The average change per individual was −1.25 people over 6 months (SD = 4.00, P < .001; Table 2; Figure 2). Degree of contraction was related to baseline network size, so that patients with large baseline networks had greater shedding of network members compared with patients with smaller networks (Supplement 3). Network members also became more closely bonded, as measured by an increase in density and constraint over time (6.77 units increase, SD = 20.92, P < .001; Table 2; Figure 2). This close-knit pattern was further supported by decreases in effective size and mean degree, revealing that network members increasingly occupied structurally similar positions with reduced number of connections over 6 months.
Mean Change in Network Characteristics Over Time.
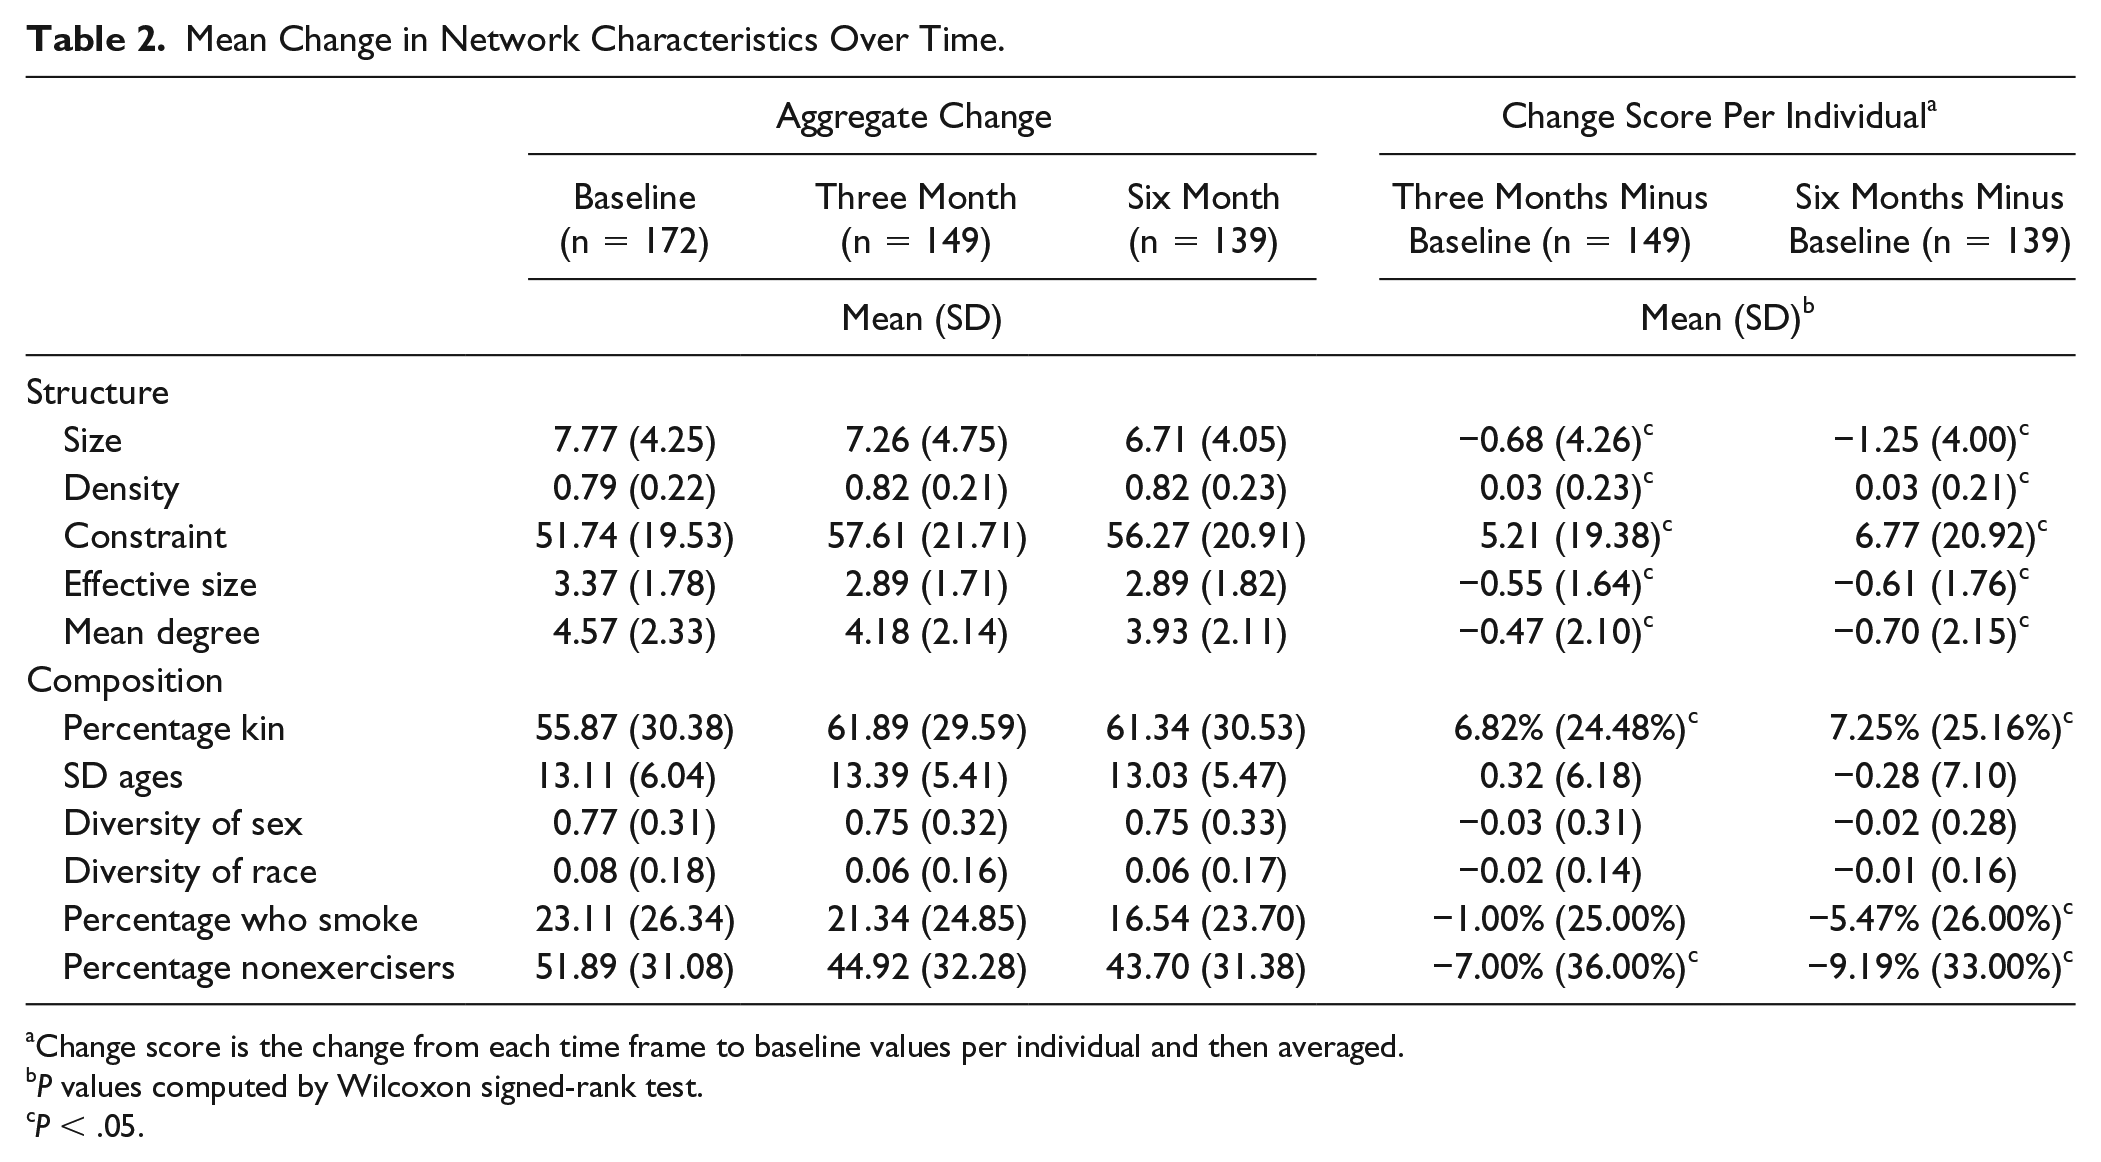
Change score is the change from each time frame to baseline values per individual and then averaged.
P values computed by Wilcoxon signed-rank test.
P < .05.
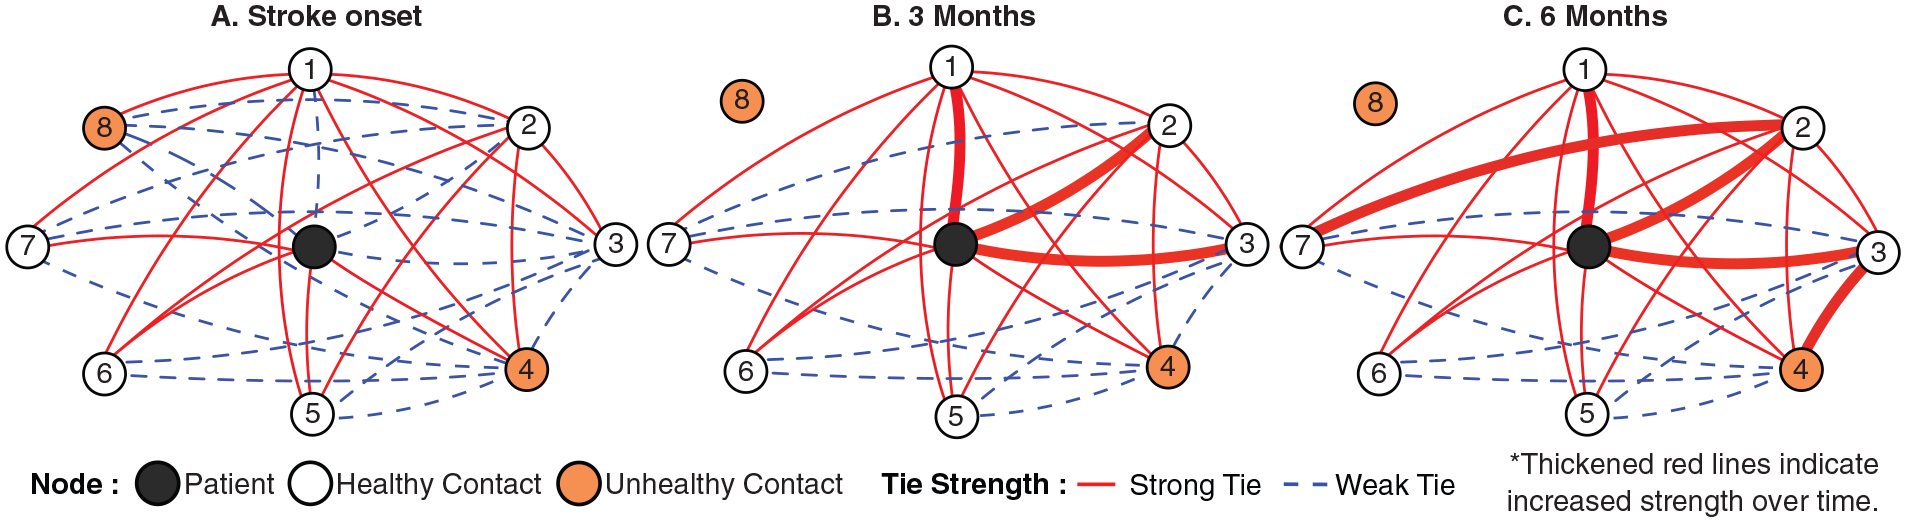
Illustration of major patterns of social network change after stroke. An average patient’s network contracts by 1 person and becomes close knit, with network members more closely connected to each other. Network members with unhealthy habits are not present in the network over time.
The networks also changed compositionally over time, with a 7.25% increase in kin within the network (SD = 25.16; P < .001) but no change in the range of ages or diversity of sex or race in the network. The networks became healthier, with 5.47% reduction in persons who smoke (SD = 26.00; P < .01) and 9.19% reduction in persons who do not exercise (SD = 33.00; P < .01). The increase in the health of networks was a result of joining of persons with healthier habits and shedding of persons with unhealthy habits (Figure 2). The pattern was not a result of change of behaviors in network members who remained constant throughout the period. For example, of people who joined the network by 6 months, 84.6% were nonsmokers and 13.4% were smokers. Conversely, of people who left the network by 6 months, 23.3% were nonsmokers and 76.7% were smokers. Of people who stayed constant, 6.5% changed from being a smoker to a nonsmoker.
Next, we examined the factors related to network size and constraint trends (Supplements 4 and 5). The main effects that influenced network size change were time (Estimate = −0.17; SE = 0.05; P = .0006), years of education (Estimate = 0.38; SE = 0.12; P = .002), and PHQ-9 depression score (Estimate = −0.15; SE = 0.05; P = .006). We found no interactions between any factors and time, suggesting that factors were not related to the slope of change but rather related directly to network size at specific times after stroke. The main effects that influenced constraint (where increasing values indicate more close-knit relations) were time (Estimate = 0.99; SE = 0.25; P = .0001), age (Estimate = −0.24; SE = 0.12; P = .04), years of education (Estimate = −1.36; SE = 0.57; P = .02), and PHQ-9 depression score (Estimate = 0.65; SE = 0.25; P = .01). Again, there were no interactions between any of these factors and time.
Social Network Metrics and Physical Function Outcomes
We examined the relationship of baseline network metrics and their changes to physical function PROMIS scores at 3 and 6 months. There was a strong correlation between baseline network size and physical function scores at each time period (Figure 3). In univariate analysis, the pattern was further supported because baseline network size was related to both 3-month physical function PROMIS score (Estimate = 0.84; SE = 0.20; P < .0001) and 6-month physical function PROMIS score (Estimate = 0.86, SE = 0.23, P = .0003; Supplement 6). Mean degree, the average number of ties to a network member, was also significantly related to physical function PROMIS scores in univariate analysis only. Other network metrics, including connectivity and composition measures, were not associated with physical function.
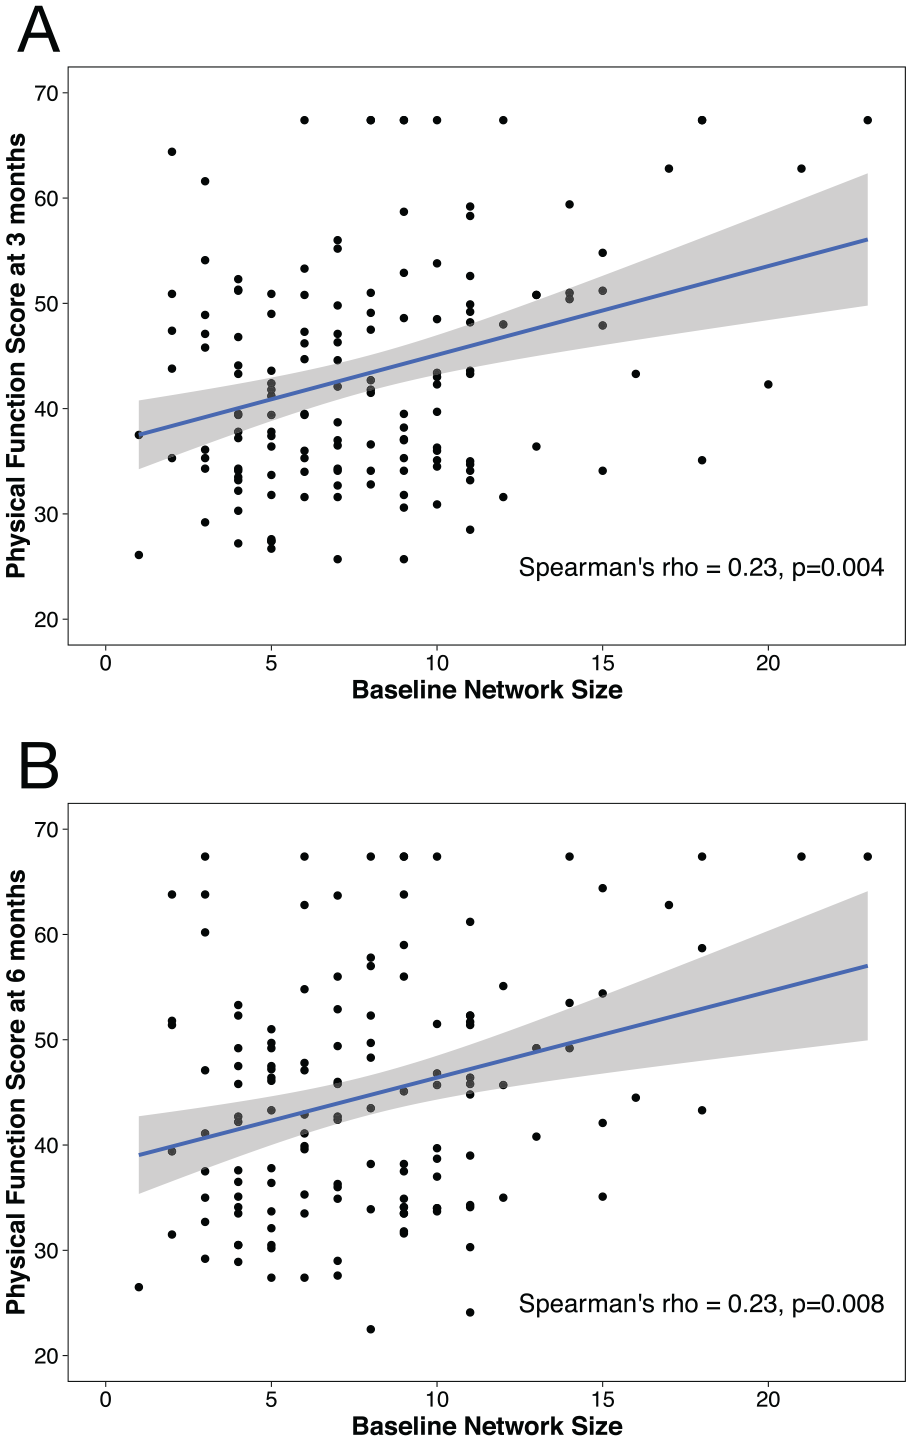
Relationship of baseline network size and physical function at 3 and 6 months after stroke. Baseline network size is positively related to patient-reported physical function at 3 months (A) and 6 months (B).
In multivariable regression where we adjusted for covariates, baseline network size continued to be strongly associated with physical function PROMIS score at 3 months (Estimate = 0.58; SE = 0.20; P = .005) and 6 months (Estimate = 0.66, SE = 0.22, P = .004; Table 3). The change score of the network metrics (eg, change in network size from baseline to 3 months) did not have a significant relationship to 6-month PROMIS score, suggesting that social resources at baseline matter more than the social changes after stroke. Multivariable regression of the other network metrics continued to show no significant association with physical function.
Multivariable Linear Regressions of 3-Month and 6-Month Physical Function PROMIS Score.
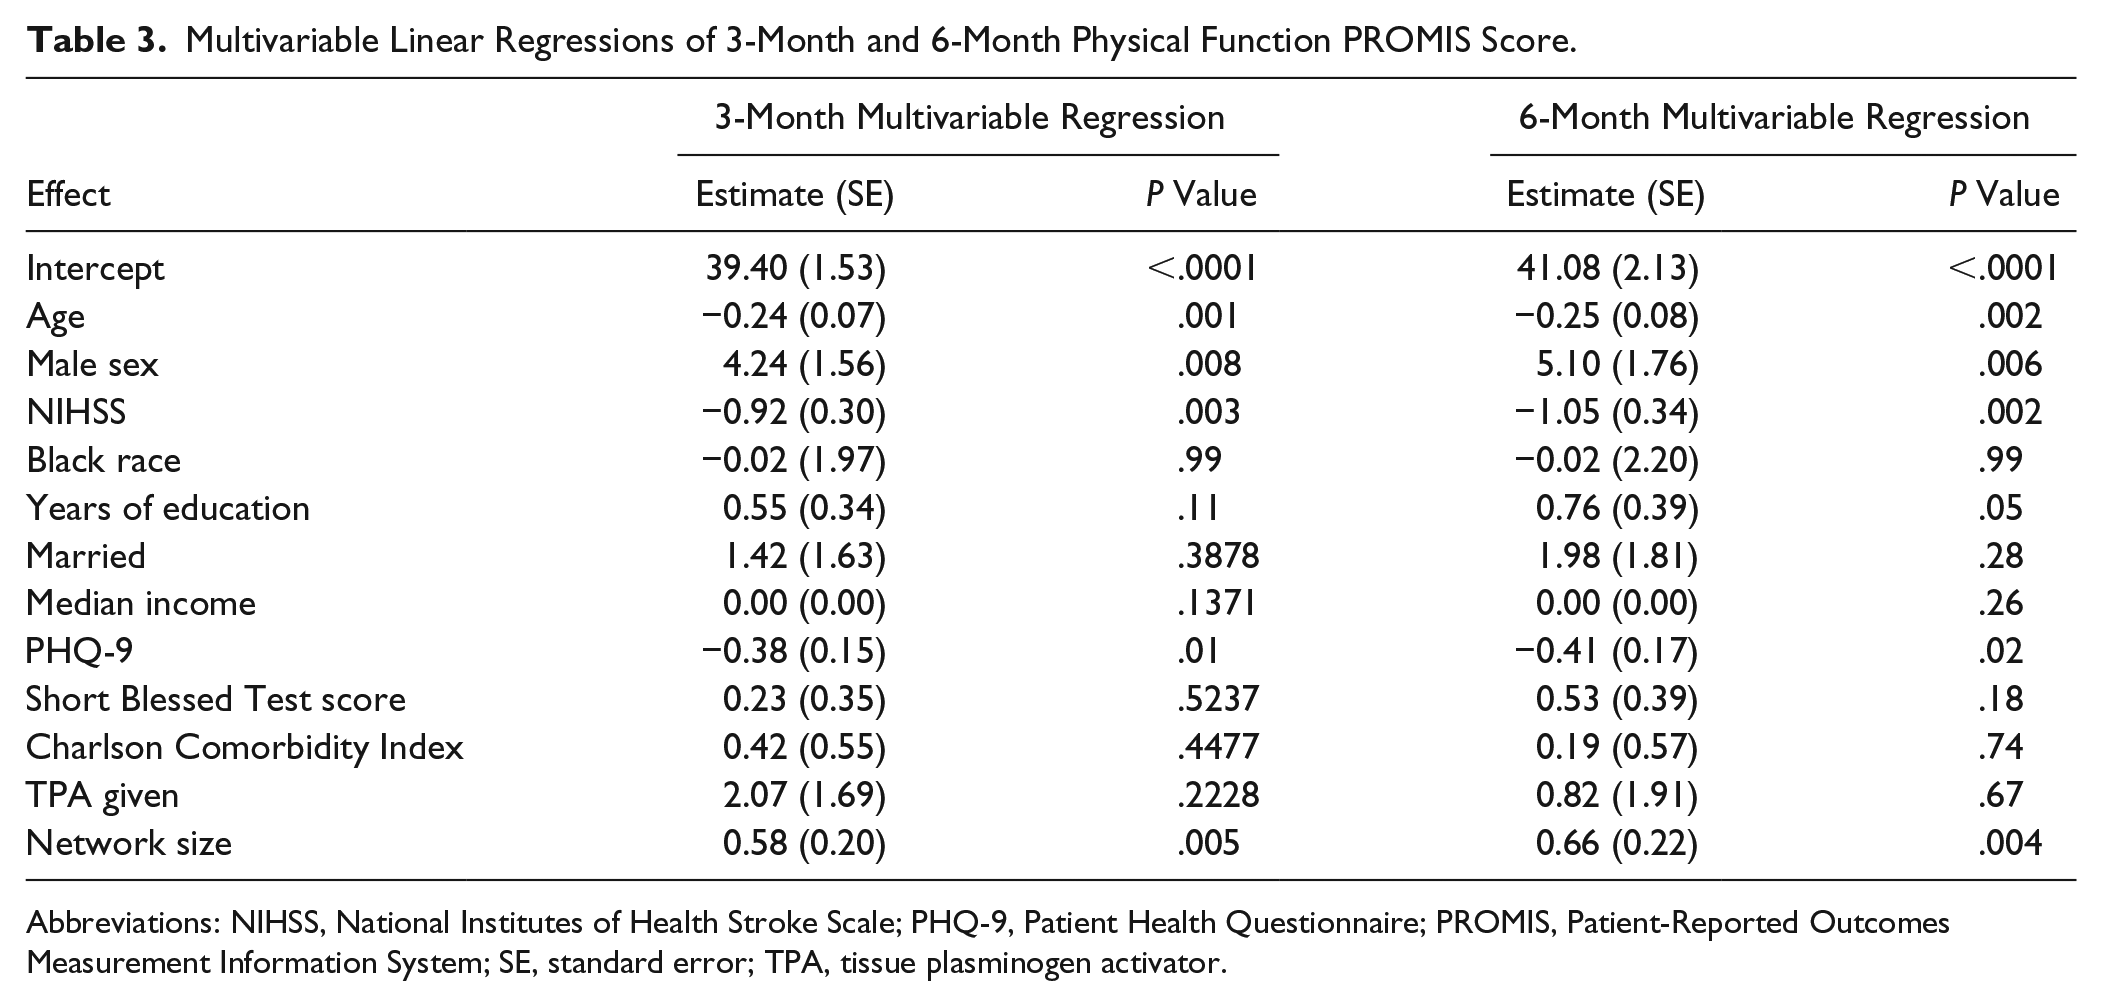
Abbreviations: NIHSS, National Institutes of Health Stroke Scale; PHQ-9, Patient Health Questionnaire; PROMIS, Patient-Reported Outcomes Measurement Information System; SE, standard error; TPA, tissue plasminogen activator.
Mechanisms of Social Network Change
In qualitative analysis, we found 5 categories of social support replicating prior studies: 92% reported instrumental support (ie, transportation and grocery shopping); 88% reported informational support (ie, advice for healthy living); 67% reported emotional support (ie, empathy and love); 58% reported interactional support (ie, engaging with others in activities); and 38% reported appraisal (ie, feedback and validation).
Second, social support organization, meaning the distribution of roles and the involvement of less intimate people, was related to the quality of social interactions reported by the patient. For example, a patient who experienced positive meaningful or fulfilling interactions after stroke described a distribution of responsibilities across the network: “one takes care of my emotional side and the other one takes care of all the cooking and cleaning and laundry.” Patients who had networks without distributed responsibility had more negative quality of interactions: “I don’t want them too close. . . . They’ll be running in and out of your house. . . . They’re complaining, you don’t need to do this or you should do this or you should do that.”
In summary, patients had more positive interactions when a greater variety of relationships were included. This was further supported when looking at the change in network metrics, such as size, density, and percentage kin. Networks that became larger and less close knit, and involved more friends were associated with positive interactions. Conversely, networks that became smaller, dense, and family-based were associated with negative interactions, with more distress and isolation (Supplement 7). The directionality of these effects requires further study.
Sensitivity Analyses
We completed sensitivity analyses to determine differences in patient traits, network traits, or outcomes by study site. There were 150 patients from Barnes Jewish Hospital in St Louis and 22 patients from Brigham and Women’s Hospital in Boston. Although comparisons are limited by imbalance in the groups, we found differences in socioeconomic markers—Barnes Jewish Hospital in St Louis described first as either medians [IQR] or means (SD): baseline years of education, 14 [12-14] versus 16 [12-17.5], P = .014; median income, 46 664 (18 494) versus 73 741 (22 787), P < .001; and private insurance status, 49% versus 86%, P = .003. The only clinical difference was Short Blessed Cognitive scores (2 [0-4] vs 0 [0-2]; P = .007). These baseline characteristics were adjusted for in the main models. Network measures were not different across sites (eg, network size 7 [5, 10] vs 8 [5,11], P = .41). When we added site to the final regression model of social network size predicting physical function at 3 and 6 months, we found no difference for our main result (eg, adjusting for site, network size estimate = 0.61 (0.22), P = .004)
Discussion
We used social network mapping to analyze the change of social networks after stroke and the relationship between networks and patient-reported physical function at 3 and 6 months. Our results inform a biopsychosocial model of stroke recovery. Using a novel technique to quantify and visualize networks, we found that a survivor’s network contracted by an average of 1.25 persons over 6 months with pruning of network members with unhealthy habits. Also, a patient’s baseline network size was associated with physical function at both 3 and 6 months independent of age, stroke severity, socioeconomic state, depression, cognition, and other comorbidities. These results have implications for identifying patients at risk for poor recovery, based on social network characteristics, and creating network interventions to improve stroke outcomes.
Our findings in this stroke cohort replicate previous studies on network change after acute illness and association with functional outcomes. Prior studies demonstrate that sickness of various types causes networks to shrink, but also to become more cohesive as a result of social support surge.26,27 Particularly in older adults, illness causes social networks to contract to core constituents, mostly of family members.28,29 Network members also become increasingly bonded to each other because of caregiving coordination.30,31 These patterns appears to be accentuated in stroke, compared with myocardial infarction for instance, perhaps because of increased physical and cognitive disabilities.3,32 Moreover, as shown in our qualitative data, strongly-knit cohesive networks after stroke can strain relationships and communication. 2 Stroke patients report an increase of negative interactions among close network members because of depression in the patient and close network members, increased duties and responsibilities, and reduced interest in social activities. 2 Our results also replicate prior research showing a robust relationship between social support and positive health outcomes 33 through mechanisms such as emotional sustenance and active coping assistance. 4
Our network mapping approach further explains the change of social life after stroke and the relationship between social networks and functional status by 2 main insights. First, network contraction after stroke involves pruning of negative ties. Patients’ networks shrink after stroke, but the network overall becomes healthier, with fewer people who smoke or do not exercise. This is the result of network members with negative habits leaving the network, and new members with positive habits joining. It is not because people with negative habits change their behaviors. Similar findings have been shown in persons involved in Alcoholics Anonymous. 34 Second, a patient’s baseline network size, and not density of ties or the health habits of network members, is independently related to poststroke physical function outcomes. This means that the number of people available to support is more important than their interpersonal connectivity or cumulative health behaviors. This contrasts with social support literature that suggests that a densely connected cohesive network is best for illness coping and recovery.35,36 We speculate that the reason for our finding is that stroke patients require coordination of care from multiple persons. Also, they are particularly vulnerable to increased relationship strain and reduced social engagement that occur in smaller networks. Such networks lead to fewer chances to practice out-of-home physical activity and cognitively challenging exchanges with acquaintances and strangers.
These patterns lead to ideas for network interventions such as identifying at-risk patients and stimulating social circle growth. The network mapping method is feasible in clinical settings and may be used to rapidly create network diagrams that can themselves promote health behavior change. 37 In mapping the social milieu of patients particularly at the time of stroke, patients with a small network size (<5) could be identified as being at risk of poor recovery. Similar to hypertension or cholesterol, a small social network may be considered a modifiable risk factor. Although social support interventions have had limited success in improving clinical outcomes,38,39 the approach in past studies was individualistic, with a focus on depression treatment. Our results suggest that strategies focused on expansion of a patient’s network have low risk and high reward potential for improving physical function and participation in everyday life activities. Possible components of such an intervention might include (1) caregiver-mediated rehabilitation, 40 in which network members are recruited to be part of physical therapy; (2) partnerships with community organizations, who may adopt and engage patients in social programming; and (3) peer mentorship and online support groups, in which stroke survivors aid each other.
Limitations of our study include limited generalizability. We focused on patients with mild ischemic stroke because they are a target group for physical and social rehabilitation. Future studies will need to study these relationships in patients with moderate or severe strokes, aphasia, hemorrhage, and prior stroke as well as non–English speakers. Such patients could also be targeted for social rehabilitation programs. Patients with aphasia, in particular, represent a group vulnerable to social network decay. We were not able to include this group because we relied on self-report, but future studies could use caregiver proxies or social sensors independent of self-report. An additional limitation is the effect of unmeasured confounders. Although we adjusted for known factors associated with network change and poor functional outcomes (eg, age, stroke severity, depression, and cognitive decline), it is still possible that unmeasured confounders contributed to findings. Finally, nonrandom missing data are a validity threat in longitudinal analyses. Although we found no difference in the characteristics of those who did not complete versus those who did complete the study, bias resulting from attrition is possible.
Conclusion
Stroke recovery is a multidimensional process influenced by biological and psychosocial factors. To complement critical studies on the biological mechanisms of recovery, our study provides a novel approach that quantifies and visualizes social network mechanisms. The results suggest patterns of change, including pruning of negative ties and association with granular physical function outcomes that extend our understanding of stroke recovery. Furthermore, the results suggest that network interventions may represent a new avenue of recovery therapeutics that harnesses the untapped social resources that can maximize patient recuperation.
Supplemental Material
2019-Supplement – Supplemental material for Social Network Mapping and Functional Recovery Within 6 Months of Ischemic Stroke
Supplemental material, 2019-Supplement for Social Network Mapping and Functional Recovery Within 6 Months of Ischemic Stroke by Amar Dhand, Catherine E. Lang, Douglas A. Luke, Angela Kim, Karen Li, Liam McCafferty, Yi Mu, Bernard Rosner, Steven K. Feske and Jin-Moo Lee in Neurorehabilitation and Neural Repair
Footnotes
Authors’ Note
Angela Kim is now affiliated with SUNY Downstate Medical School, Brooklyn, NY, USA.
Declaration of Conflicting Interests
The authors declared no potential conflicts of interest with respect to the research, authorship, and/or publication of this article.
Funding
The authors disclosed receipt of the following financial support for the research, authorship, and/or publication of this article: We were supported by National Center for Medical Rehabilitation Research (K23HD083489, PI: AD), American Heart Association (14CRP20080001, PI: AD), and the National Institute of Neurological Disorders and Stroke (R01NS085419, PI: J-ML).
Supplementary material for this article is available on the Neurorehabilitation & Neural Repair website along with the online version of the article.
References
Supplementary Material
Please find the following supplemental material available below.
For Open Access articles published under a Creative Commons License, all supplemental material carries the same license as the article it is associated with.
For non-Open Access articles published, all supplemental material carries a non-exclusive license, and permission requests for re-use of supplemental material or any part of supplemental material shall be sent directly to the copyright owner as specified in the copyright notice associated with the article.