
Abstract
The loss of independent joint control, clinically referred to as limb synergies, is prevalent in the paretic upper limb of individuals with chronic hemiparetic stroke. To understand the underlying neural mechanisms, we previously reported that an increased overlap of cortical representations of shoulder/elbow could contribute to the abnormal poststroke synergies. However, these previous results were limited to a fixed time window just before the onset of motor tasks. Questions such as (1) how this overlap develops during motor preparation and (2) whether such development is also linked to upper limb synergies, remain unclear. To answer these questions, we investigated cortical overlap during motor preparation of isometric shoulder and elbow torque generation tasks in healthy individuals (n = 8), and individuals with moderate to severe chronic hemiparesis following a subcortical stroke (n = 12). We found a significant group difference in how the cortical overlap developed. In the healthy control and moderately impaired stroke groups, cortical overlap between shoulder and elbow motor tasks decreased during the motor preparation; however, this overlap increased in individuals with severe stroke. Furthermore, the rate of cortical overlap decrease/increase was linked to the upper limb Fugl-Meyer scores and limb synergies. These results demonstrate, for the first time, that the increase in overlap of the cortical activity during motor preparation is associated with the expression of synergies in the paretic upper limb of severely impaired poststroke individuals.
Keywords
Introduction
The loss of independent joint control, clinically referred to as limb synergies, 1 is a prevalent impairment in the paretic upper extremity of individuals with chronic hemiparetic stroke. Specifically, the flexor-synergy, which is expressed as abnormal coupling between shoulder abductor and elbow/wrist and finger flexion, is more prevalent than the extension synergy (ie, the abnormal coupling between shoulder adduction, elbow extension, wrist and finger flexion), and reduces functional reaching distance2-6 and hand opening 7 in individuals with moderate to severe hemiparesis when lifting the paretic arm at the shoulder.
To understand its underlying neural mechanisms, we previously measured the overlapping active area (OAA) to reflect the ratio of the shared (or commonly used) cortical area between 2 motor tasks over the total area of sensorimotor cortices. Our previous results demonstrated that before muscle recruitment, poststroke cortical activities related to the shoulder and elbow tasks were significantly more overlapped compared with healthy control subjects, and such overlapping was associated with the poststroke synergy. 8 Because the previous work only measured OAA from 0.15 to 0.1 seconds before the onset of torque, questions like (1) how this increased cortical overlap develops during motor preparation and (2) whether this overlap development during motor preparation is also linked to poststroke upper synergies, remain unclear.
Various mechanisms may alter the poststroke cortical activity during motor preparation. Stroke often interrupts corticofugal projections and increases the use of residual indirect corticobulbospinal, like corticoreticulospinal, motor pathways.9-11 To use these indirect pathways, cortical activity during the motor preparation may change. Another possibility is that over time the altered sensory feedback from abnormal motor patterns may lead to altered cortical activity related to motor preparation. Finally, there is a clear chance that subcortical lesions could affect the basal ganglia–supplementary motor area–primary motor cortex (ganglia-SMA-M1) loop, thus directly altering cortical activity related to motor preparation. Therefore, we hypothesize that post-stroke cortical activity during motor preparation changes and contributes to the loss of independent joint control following stroke.
Cortical activity during motor preparation in healthy individuals preceding self-initiated finger or hand movements with no or limited visual guidance has been studied for many years. 12 Results demonstrated a cascade of neural activity spreading from basal ganglia to the SMA, then to the primary motor cortex.13-16 Involvement of one or more of the above areas during motor preparation has been confirmed by epi-cortical recordings from epilepsy patients15,17-19 and in animals. 20
Results during motor preparation in stroke individuals are limited. Platz et al 21 showed that electroencephalography (EEG) activity prior to index finger movement of subacute stroke subjects was centered more laterally and frontally on the contralateral hemisphere. Other investigators found an abnormal persistence of short intracortical inhibition in the ipsilesional M1 during motor preparation in well-recovered chronic stroke patients, but not in healthy control subjects. 22 These previous findings demonstrated changes in cortical activity during motor preparation in mildly impaired stroke survivors who can still perform finger movements. Unfortunately, up to 67% of hemiparetic stroke survivors cannot generate volitional hand/finger movements. 23 As a consequence, cortical activity related to motor preparation in this large population has not been well studied yet. In an effort to fill the gap, motor tasks involving shoulder and/or elbow joints have been used. Using 64-channel EEG recordings, a prolonged motor preparation time, 24 and a higher contralesional/lesional activation ratio in poststroke sensorimotor cortices 25 during motor preparation of a reaching task were reported. However, these studies did not investigate the association between the abnormal cortical activities and motor performance. In this article, we investigated not only the features of cortical activity related to shoulder/elbow tasks during motor preparation in individuals with moderate to severe stroke but also its association with the post-stroke abnormal flexion synergy.
Data from subject S14 was newly collected. Other data during a time window from −150 to −100 ms with 0 indicating the onset of the torque have been used in our previous article. 8 In the present study, data from −700 to −100 ms from the same experiments were further analyzed to investigate the development of cortical overlapping in individuals with moderate to severe stroke, which has not been studied before.
Materials and Methods
Subjects
In total, 8 control subjects (age: 50.2 ± 5.6 years, male = 6, female = 2) and 6 moderately (age: 64 ± 10.0 years, male = 4, female = 2), and 8 severely (age: 55.8 ± 8.0 years, male = 4, female = 4) impaired chronic hemiparetic stroke survivors were recruited.
The original inclusion criteria for the stroke participants were the following: (1) age between 22 and 80 years; (2) paresis confined to one side, with Upper Extremity Fugl-Meyer Motor Assessment (UE-FMA) scores in the range of 10 to 45 out of 66; (3) ability to elevate their limb against gravity up to horizontal; and (4) capacity to provide informed consent. Exclusion criteria included (1) any brainstem and/or cerebellar lesions; (2) severe concurrent medical problems (eg, cardiorespiratory impairment, changes in management of hypertension, inflammatory joint disease); (3) a history of neurologic disorder other than stroke; (4) any acute or chronic painful condition in the UE or spine; (5) use of a cardiac pacemaker; (6) history of seizures; (7) having received botulinum toxin injection to any portion of the paretic UE within the past 6 months, or phenol injections <12 months before participation; (8) pregnant or planning to become pregnant; (9) participating in any experimental rehabilitation or drug studies; and (10) other conditions that prevent magnetic resonance imaging (MRI) data collection.
Clinical information regarding the stroke individuals is listed in Table 1. We further exclude subjects with cortical lesion (ie, #2 and #7 marked by dark gray rows in Table 1) to avoid possible impact of lesion on the selection of our regions of interests (see below for definition). All of the remaining stroke individuals sustained subcortical lesions. In this article, cumulative UE-FMA scores between 26 and 45, and between 10 and 25, indicate moderately (light gray rows) and severe (white rows in Table 1) impairments, respectively. All the control subjects were right-hand dominant and did not have a history of neurological injury or impairment. All subjects provided written consent prior to participation in the study that was approved by the Institutional Review Board of Northwestern University and in compliance with the principles of the Declaration of Helsinki.
Lesion Location (MRI Assessment) and UE-FMA Scores for Subjects With Hemiparesis.
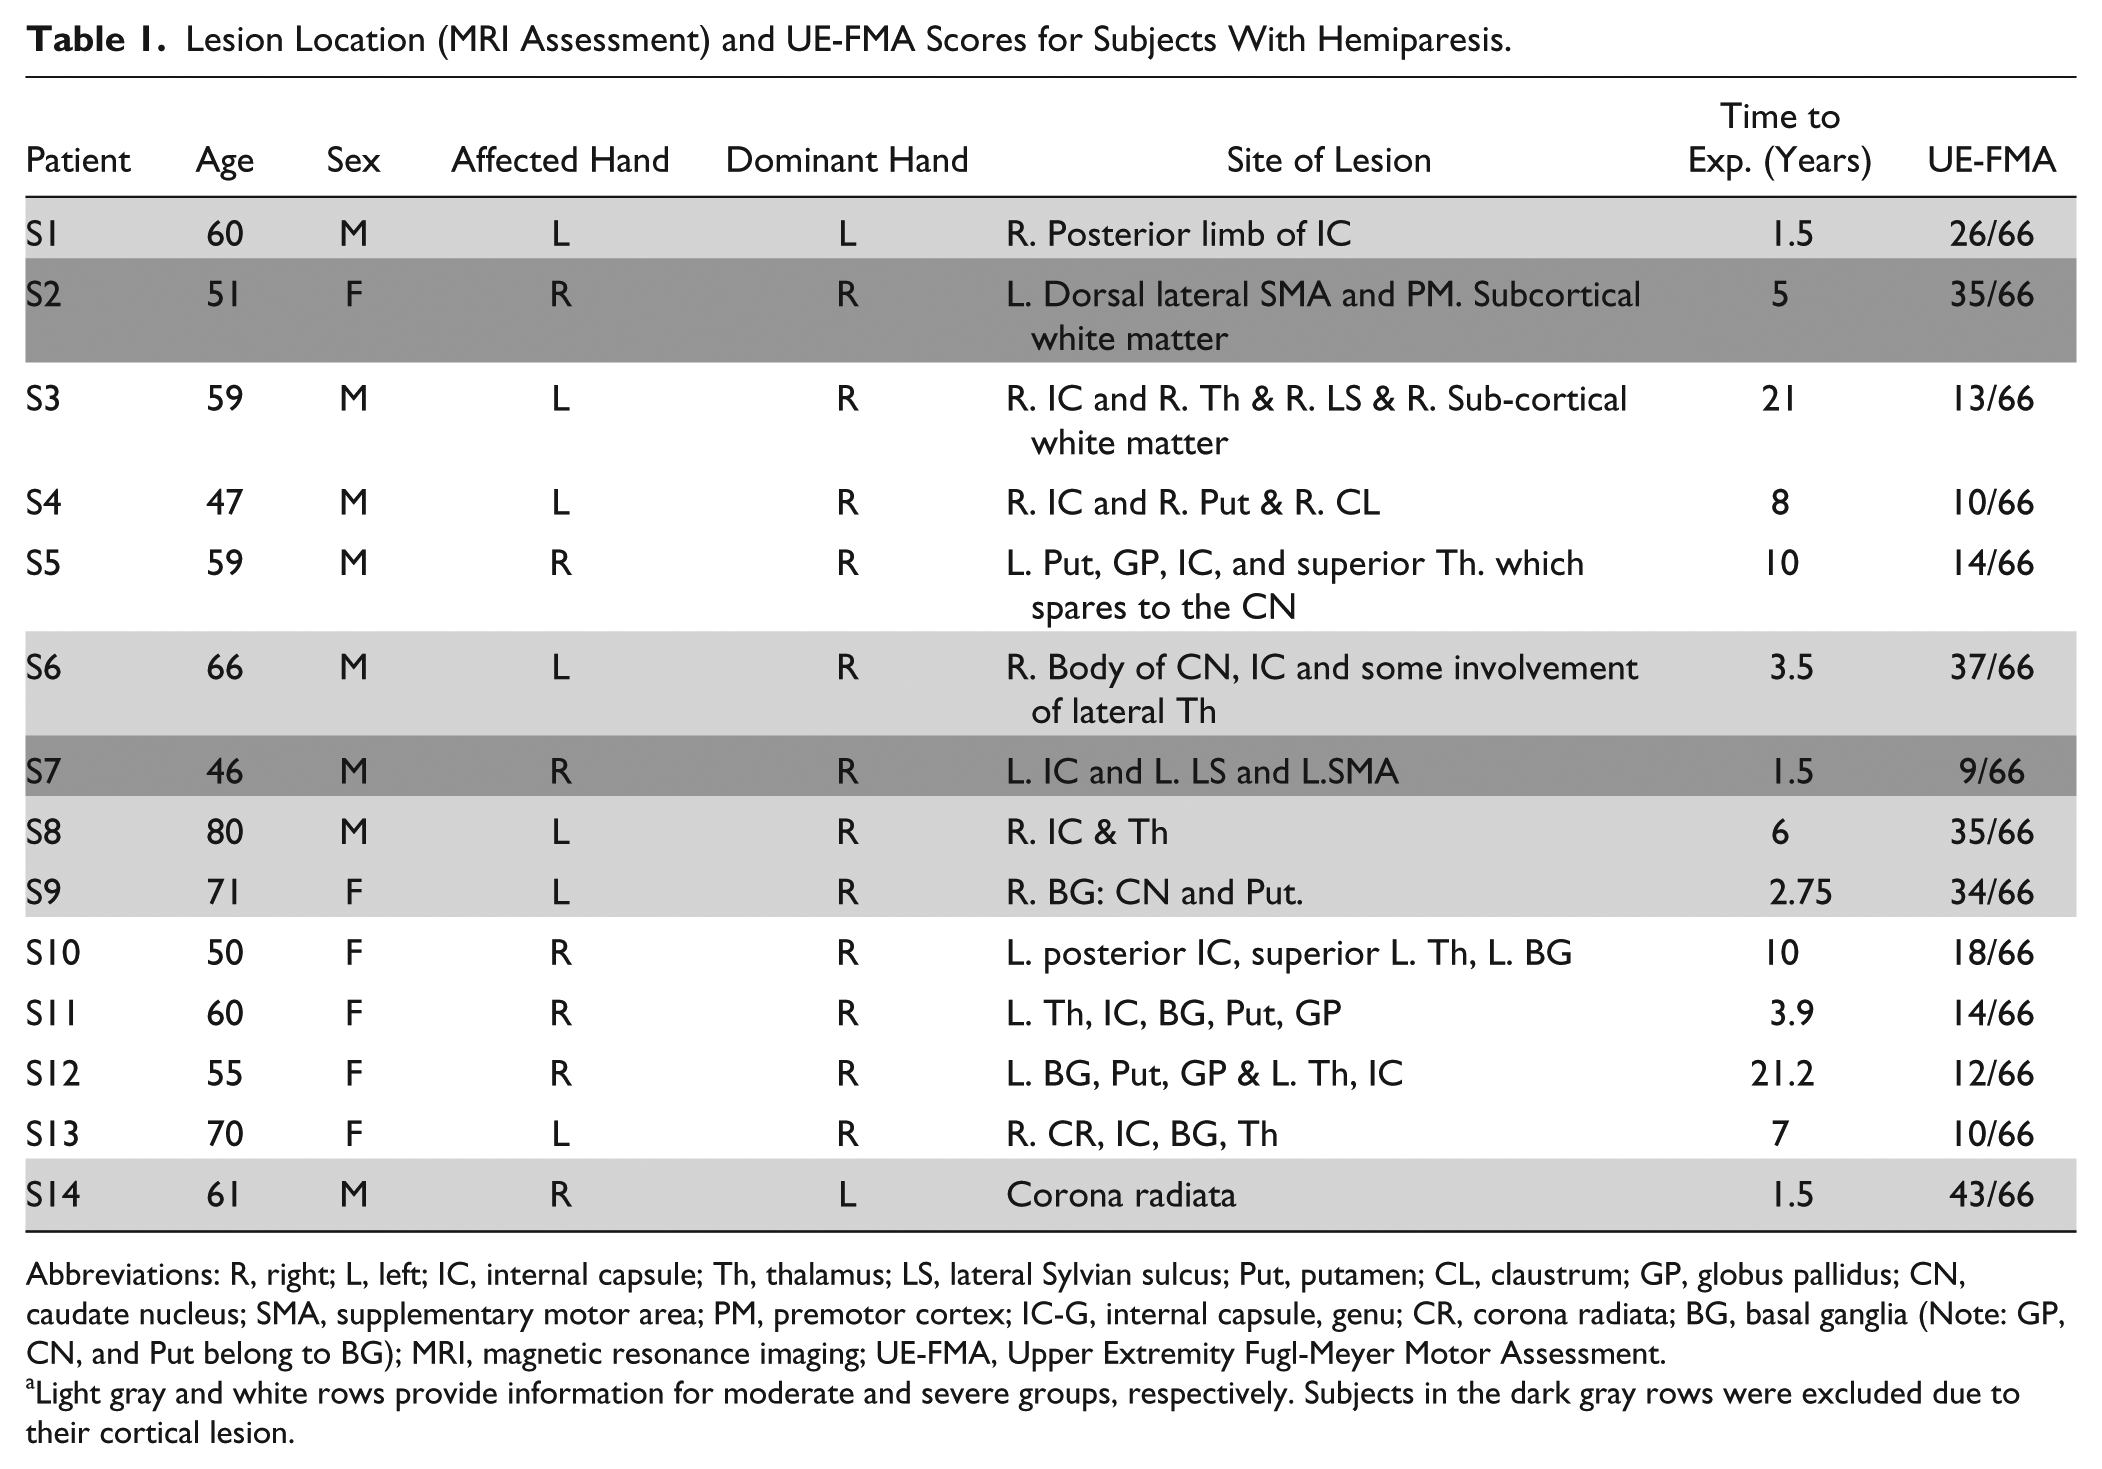
Abbreviations: R, right; L, left; IC, internal capsule; Th, thalamus; LS, lateral Sylvian sulcus; Put, putamen; CL, claustrum; GP, globus pallidus; CN, caudate nucleus; SMA, supplementary motor area; PM, premotor cortex; IC-G, internal capsule, genu; CR, corona radiata; BG, basal ganglia (Note: GP, CN, and Put belong to BG); MRI, magnetic resonance imaging; UE-FMA, Upper Extremity Fugl-Meyer Motor Assessment.
Light gray and white rows provide information for moderate and severe groups, respectively. Subjects in the dark gray rows were excluded due to their cortical lesion.
Experimental Setup and Protocol
Participants sat in a Biodex chair (Biodex Medical Systems, Shirley, NY) that restrained the trunk to the back of chair with straps crossing the chest and abdomen. The subject’s wrist was cast and secured to a 6-degree-of-freedom load cell with the shoulder at 75° abduction, 40° flexion, and the elbow at 90° flexion angle.
All the participants were first trained to get familiar with the protocol. During training, an auditory signal was given to indicate a resting period of 5 to 7 seconds and then to self-initiate a required torque, in the shoulder abduction or elbow flexion direction, from rest to 25% ± 10% of a subject’s maximum voluntary torque (MVT) and then hold the torque for 0.3 seconds. At the end of each trial, oral feedback was given to inform a successful trial or the reason for an unsuccessful trial. Initially during training, visual feedback of the generated torque amplitude was provided. Then subjects were trained to perform the task purely based on posttrial oral feedback. The training session was finished when a participant successfully performed 9 out of 10 successive trials without visual feedback.
During EEG data collection, 3 to 4 trials of MVT generation in the shoulder flexion/extension (SF/E), shoulder abduction/adduction (SABD/ADD), and elbow flexion/extension (EF/E) direction were first recorded in a random order. Subsequently, each participant performed 3 to 5 randomly ordered blocks of 20 to 30 trials of SABD or EF task without visual feedback. This resulted in a total of 90 to 150 trials per required task. Rest periods of about 15 seconds between trials, and about 20 minutes between blocks were provided to avoid fatigue.
Data Collection
A brain anatomical MRI for each of the participants was taken in a 3T magnet scanner (Siemens, Erlangen, Germany) using a T1-weighted gradient echo pulse sequence. Images had a field of view of approximately 231 mm, voxel size of 1.0 × 1.0 mm, and slice thickness of 1.0 mm.
The 160-channel scalp EEG signal was recorded using active electrodes (Biosemi, Inc, Active II, Amsterdam, the Netherlands) that were mounted on a stretchable fabric cap based on a 10/20 system. Positions of EEG electrodes and the landmarks at the nasion and pre-auricular notches were recorded using a 3-dimensional magnetic digitizer (Polhemus, Colchester, VT). This allowed for the co-registration of EEG electrodes with each subject’s anatomical MRI data. Furthermore, torque data were also simultaneously collected using a 6-degree-of-freedom load cell (JR 3 Inc, Woodland, CA). All data were sampled at 1 kHz.
Data Processing
Torque Data Processing
We quantified the synergy using the torque coupling ratio (TCR), 26 defined as
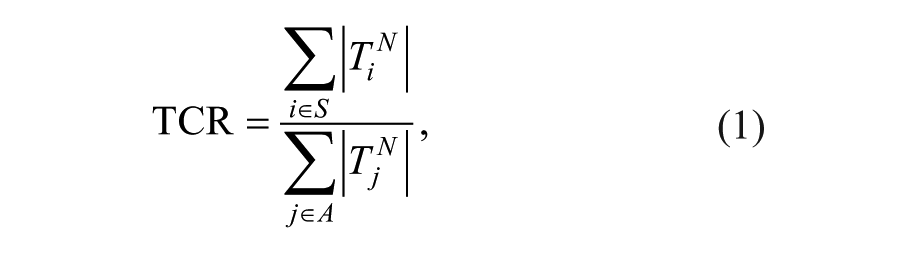
where
EEG Data Preprocessing
The EEG trials that exhibited undesired torque activities or artifacts in EEG signals (eg, eye blinks, sweat potentials, etc) were eliminated from analysis. The remaining EEG trials (mean number of the remaining trials per participant per task = 64.9) were aligned to the onset of torque (marked as time 0), segmented (−2000 to 500 ms), baseline (−2000 to −1800 ms) corrected, and ensemble-averaged.
Cortical Activity Reconstruction
The ensemble-averaged EEG signals were imported into the CURRY V5 software (Compumedics Neuroscan Ltd, El Paso, TX) for reconstructing the cortical activity from −0.7 to −0.1 seconds, using the LORETA (low-resolution brain electromagnetic tomography) method (Lp = 1)27,28 based on a subject-specific boundary element model with the regulation parameter equal to 1/(signal-to-noise ratio). The reconstructed cortical activity distributed in a triangular mesh that covered the cortex (mean ± STD of the side length: 3.66 ± 0.07 mm, without group difference, P > .9). This inverse method outperformed all other available inverse methods in CURRY V4.5 when tested using both simulated EEG data and real somatosensory cortical evoked potentials. 29 Although the inverse calculation was performed over the whole cortex, only the activities in the regions of interest (ROI) were further analyzed.
Regions of Interests
Our ROI consisted of the bilateral sensorimotor cortices, including the premotor (PM), SMA (including both preSMA and SMA proper), primary motor (M1), and primary somatosensory (S1) cortices on the contralateral (marked as cPM, cSMA, cM1, and cS1) and ipsilateral hemispheres (marked as iPM, iSMA, iM1, and iS1). These 8 ROIs were manually marked in CURRY software according to the neurophysiology literature. Using these marks, a custom-made MATLAB (The Mathworks, Inc, Natick, MA) routine automatically created these ROIs (see Figure 2).
Calculating the Time-Spatial Cortical Activity Distribution
To enable the group comparison, we standardized the cortical activity distribution per subject per condition in time-spatial domain using the following 3 steps. Step 1, per triangle grid, the cortical activity in every non-overlapping 50ms window from −0.7 to −0.1 seconds was averaged across time samples. Step 2, per time window per ROI, the time-averaged cortical activity was further averaged across all the triangle grids. These 2 steps resulted in an averaged cortical-distribution over thirteen 50ms time windows (time-domain) for each of the 8 ROIs (location-domain). Step 3, we normalized the averaged cortical-distribution by the maximum activity across all of the time-and-location grids. Finally, we calculated the group mean of the normalized and averaged cortical-distribution per task.
Calculating the Overlapping Active Area
To calculate the overlapping cortical active area (OAA), the time-averaged cortical activity (ie, the result of the step 1 in the previous section) was normalized by the maximum activity across all time and triangular grids, and resulted in
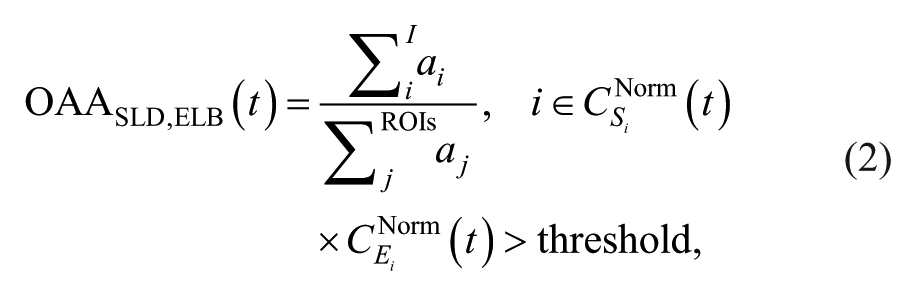
where the overlapping active area,
As the primary measure of this article, we further quantified the “slope of OAA” (sOAA), defined as the slope of the fitted OAA as a linear function of time. A positive sOAA reflects an increasing cortical overlap between SABD and EF tasks during motor preparation, while a negative sOAA reflects a decreasing cortical overlap over time.
Statistical Analysis
A 2-way (task, group) repeated-measures analysis of variance (rANOVA) with mixed model was used to determine the effects of task, group, or their interaction on TCR. A 2-way (time, group) rANOVA with mixed model was used to determine the effects of time, group, or their interaction on OAA. Furthermore, a 1-way (group) ANOVA was used to determine the effect of group on sOAA. When a significant effect was found, a post hoc Bonfferoni test was used to correct the type II error of multiple comparisons. The power of the statistical analysis was also reported. In order to determine the monotonic correlations between 2 measures, a nonparametric Spearman correlation was used, with a rho value of “0.2 to 0.39” and “0.4 to 0.59” representing “weak” and “moderate” relationship, respectively. All statistical significance was chosen for a P value less than .05.
Results
Torque Coupling Ratio
Figure 1 shows the TCR during the holding phases of SABD and EF tasks for each of the groups. A 2-way (tasks and group) rANOVA with mixed model reported significant effects of motor task (P < .0001, power = 99.8%), group (P < .001, power = 97.8%) and task * group (P < .05, power = 62.6%). The Bonferroni post hoc test reported that the TRCs for SABD task in both severe (P < .001) and moderate (P < .05) groups were larger than that in the control group. For EF task, both moderate stroke and control groups have significantly less TRC (P < .05) comparing with the severe stroke group. No other significant difference was reported.
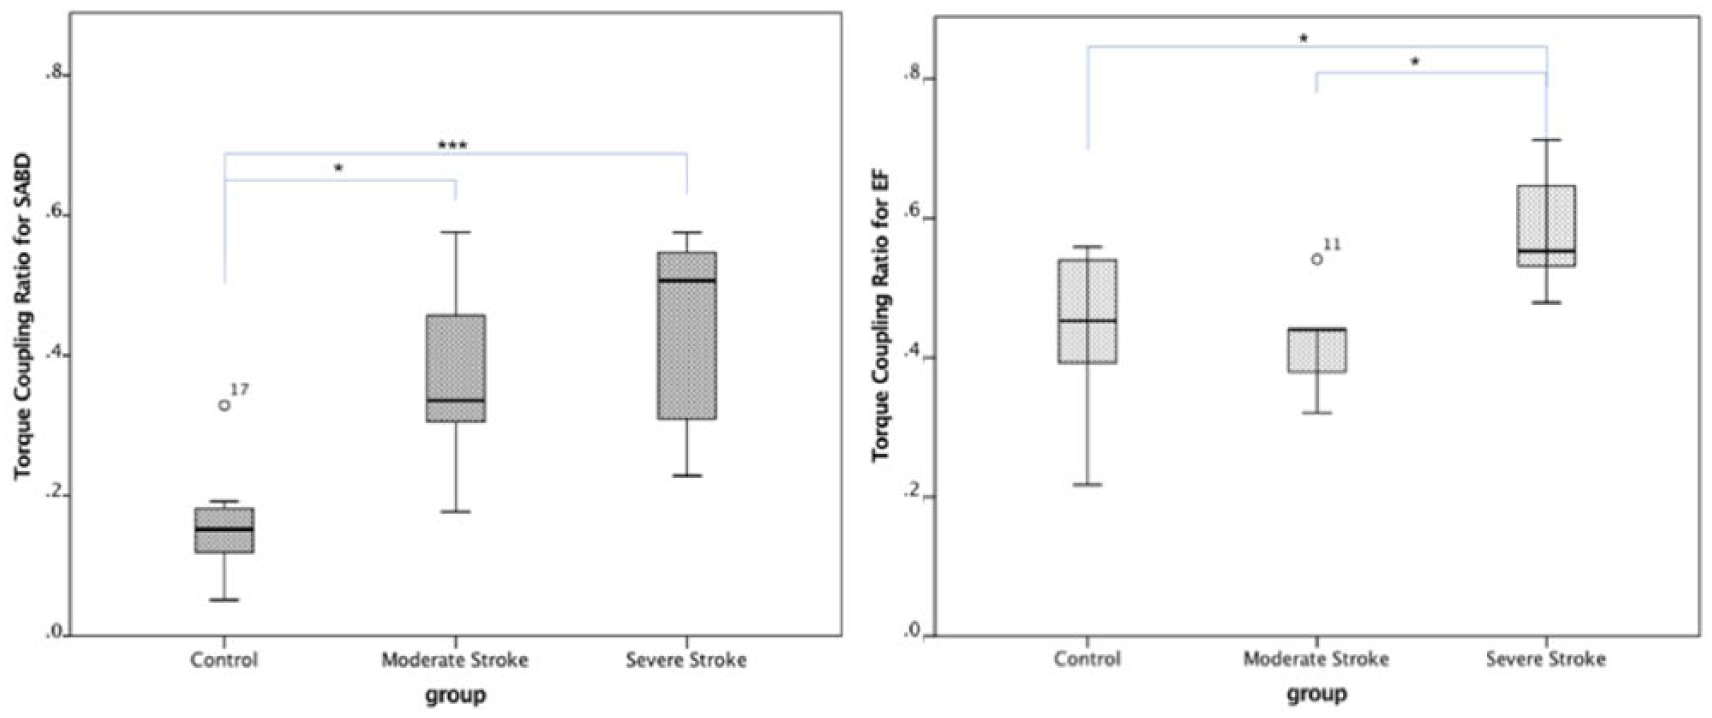
Boxplot of the torque coupling ratio (TCR) during the holding phase of shoulder abduction (SABD) and elbow flexion (EF) tasks for each of the groups. P values for the Bonferroni post hoc test were reported as follows: *P < .05, ***P < .001.
Reconstructed Cortical Activity During Motor Preparation Phase
Figure 2 shows the epoch-averaged EEG data (the second row), and the mean global field power (the thir row) from a typical healthy control subject during the SABD task. One can observe that scalp potentials started to change from baseline about 2 seconds before the torque onset and reached a peak about 0.1 seconds after. These time-domain features are represented in both healthy and stroke individuals. In the top row of Figure 2, we also plotted the reconstructed cortical activities at −0.4, −0.3, and −0.2 seconds in this representative participant, with the central sulcus and 8 ROIs marked on the top-left and top-right plots, respectively.
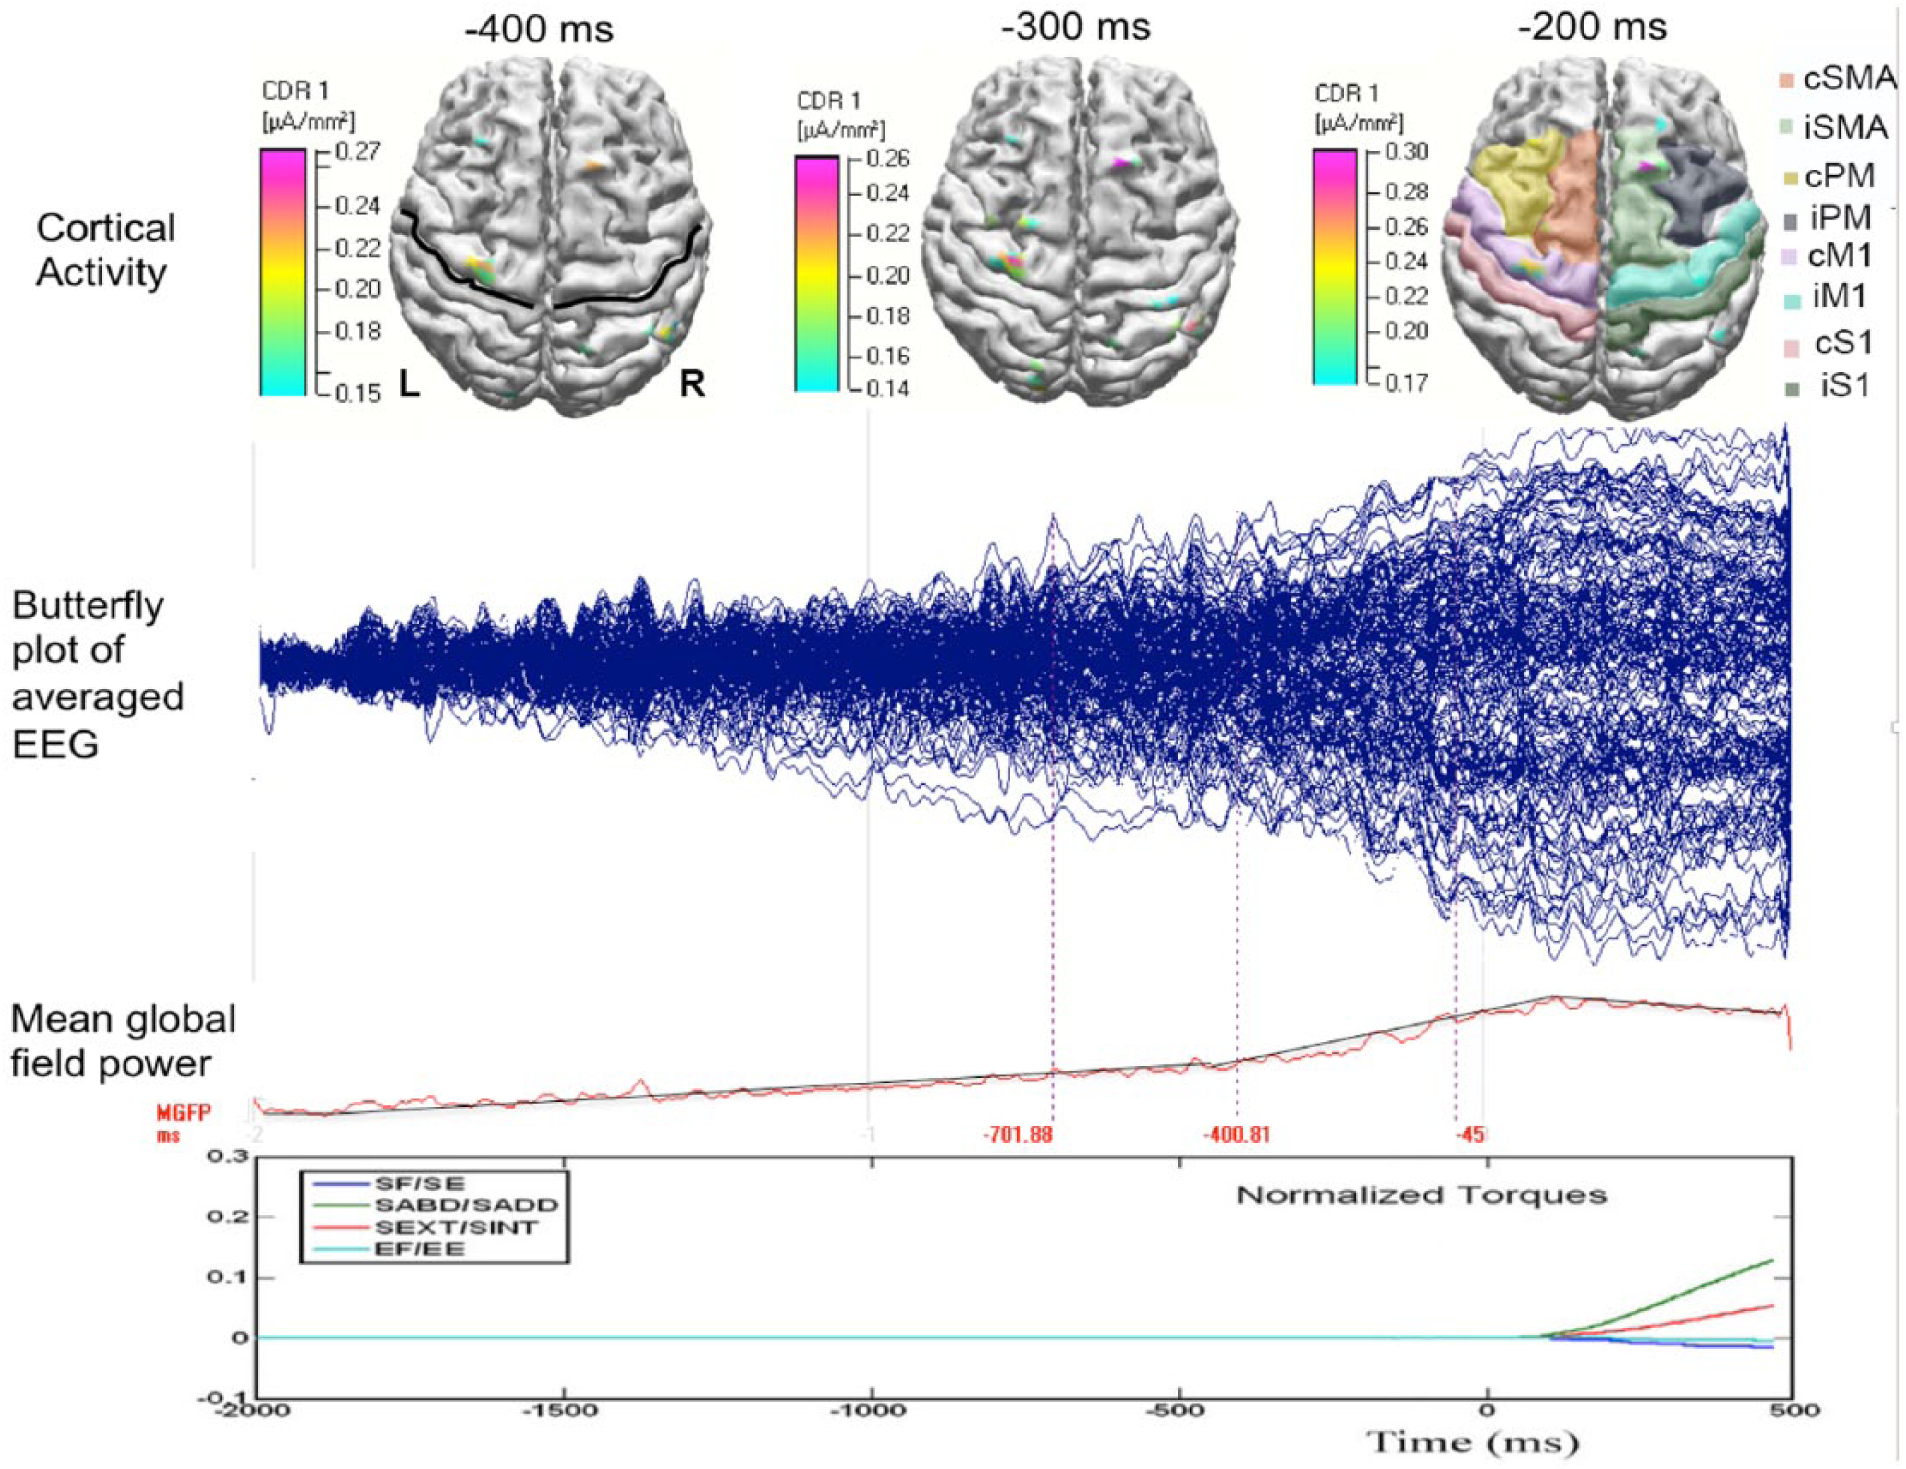
Typical data in a healthy control subject during shoulder abduction (SABD) task. The top row shows the reconstructed cortical activity at −0.4, −0.3, and −0.2 seconds, with regard to the onset of the torque. In the subplots at −0.4 and −0.2 seconds, the central sulcus and the 8 ROIs are marked by a black line and shades with different colors. The second and third rows show the butterfly plot and the mean global field power of the average electroencephalogram (EEG). The last row shows the normalized torques generated at the shoulder and elbow. The torque reaches peak about at 1.2 seconds, which is truncated in this plot.
The group mean of the time-location distribution of the cortical activities per motor task are shown in Figure 3. For the control group (the left column), one observes (1) for the SABD task, a focused cortical activity largely restricted to cM1 and (2) for the EF task, a relatively larger activity on cSMA from −0.4 seconds and then on cM1 after −0.1 seconds. Conversely, in moderately (the middle column) and severely (the right column) impaired stroke groups, group-means of cortical activity show scattered bilateral distributions, primarily due to a large between-subject variance in cortical distribution following stroke.
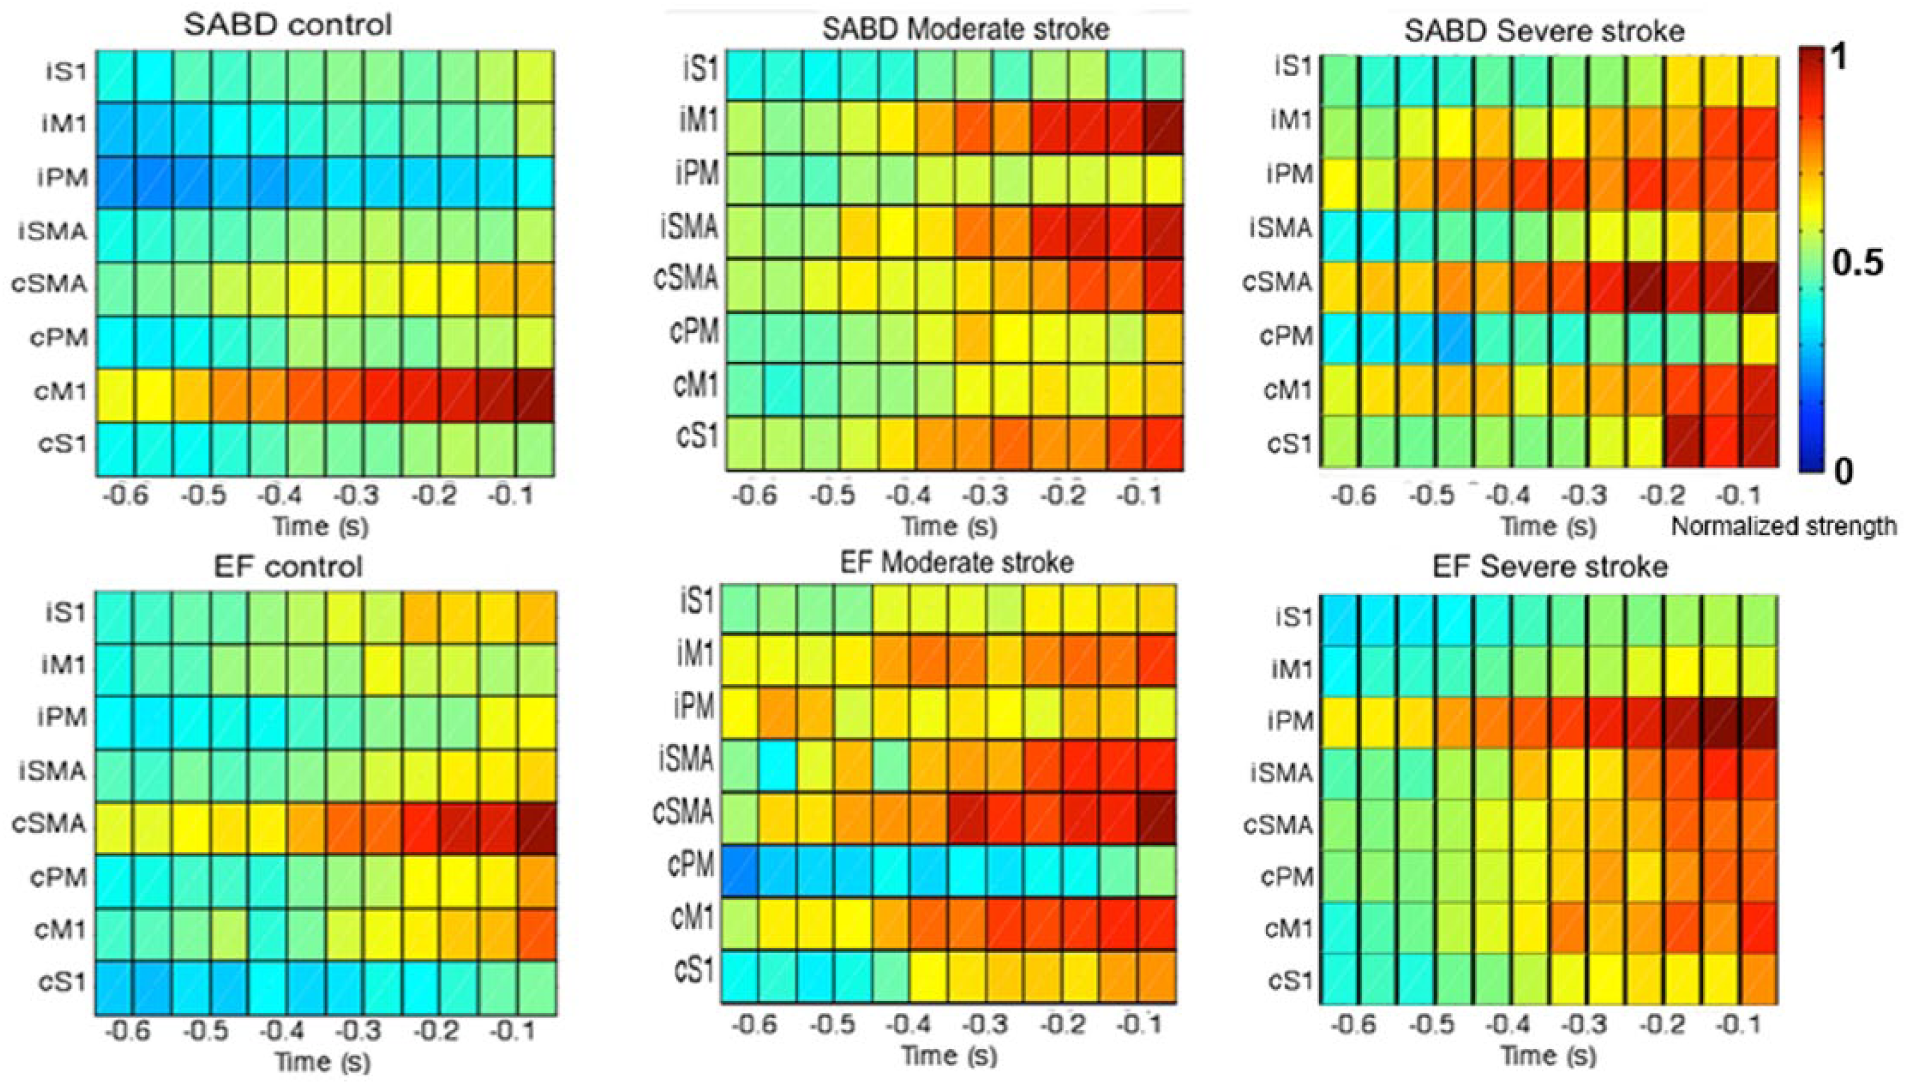
The group mean of the time-location distribution for shoulder abduction (SABD; upper row) and elbow flexion (EF) tasks (lower row). The x-axis is time with 0 representing the onset of torque; the y-axis contains 8 ROIs, from the top to the bottom are ipsilateral S1, M1, PM, and SMA, then contralateral SMA, PM, M1, and S1. The color bar shows the normalized strength of the cortical activity. S1, primary somatosensory cortex; M1, primary motor cortex; PM, premotor area; SMA, supplementary motor area.
The Development of Cortical Overlapping of Joint Representation
The mean and standard error of OAA for per group from −0.7 to −0.1 seconds are shown in Figure 4, with the fitted line, its function OAA(t) = sOAA × t + b, and the resultant R2 value also shown. Over time, one observes decreased OAAs in both moderately impaired stroke (k = −0.025, R2 = 0.67) and healthy control (k = −0.022, R2 = 0.87) groups; however, increased OAAs (k = 0.021, R2 = 0.63) in severely impaired stroke group.
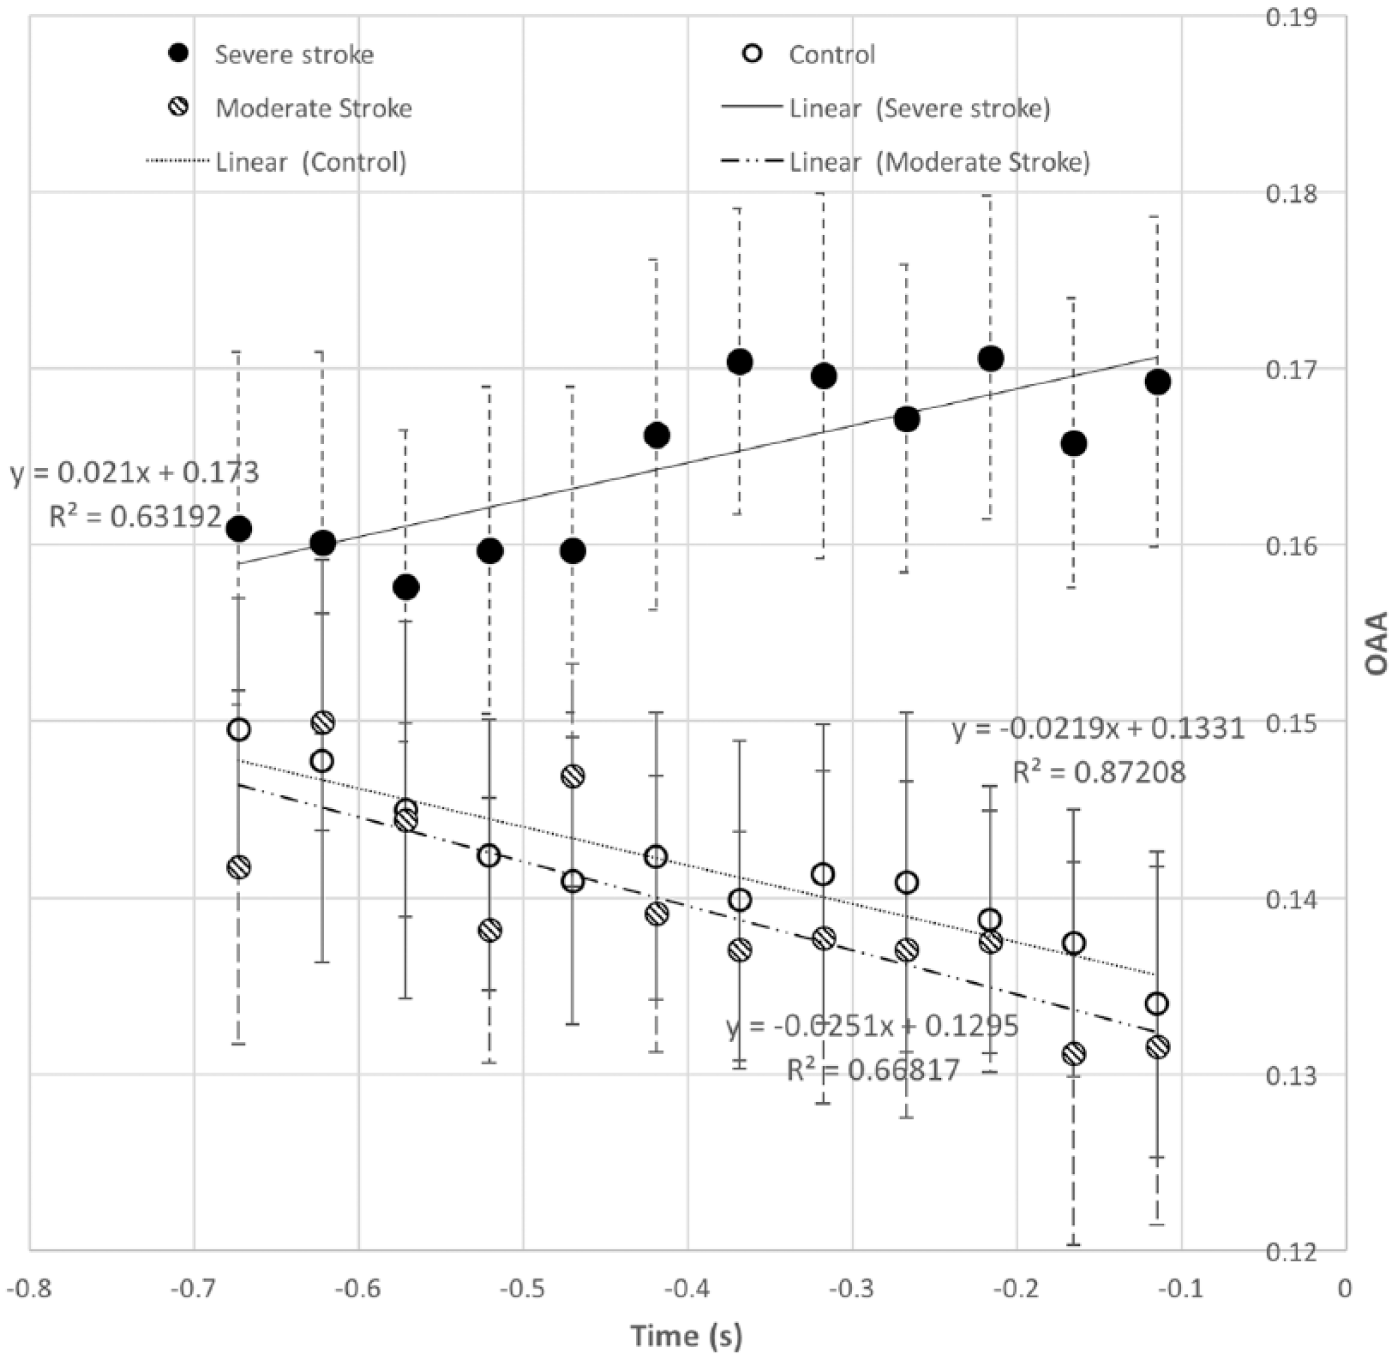
The mean and standard error of the cortical overlap of active area (OAA) for shoulder and elbow tasks over all the regions of interest (ROIs, ie, sensorimotor cortex cortices) from 700 to 150 ms prior to the onset of the motor task in control (open circles) and in moderately impaired stroke (lined circles) and severely impaired stroke (solid circles) subjects.
A 2-factor (time and group) rANOVA with mixed model showed a significant interaction between time and group on OAA (F-ratio = 2.48, P < .001, power = 0.961). A Bonferroni post hoc tests reported the significant effect of group (P < .05, power = 0.717) on OAA at −350 ms, and after −200 ms (power between 0.686 and 0.794), with the severely affected stroke group has a larger OAA than that for moderate (P < .05) and control (P < .05) groups.
The Slope of Cortical Overlap of Active Area
The mean and the standard error of the slope of OAA (sOAA) per group were shown in Figure 5A. A 1-way (factor: group) ANOVA reported a significant effect of group on the sOAA (F-ratio = 9.9, P < .001, power = 0.961). A Bonferroni post hoc test showed that the sOAA for severely impaired stroke group was higher than that for the control (P < .01, power = 0.96) and the moderately impaired stroke groups (P < .01, power = 0.94).
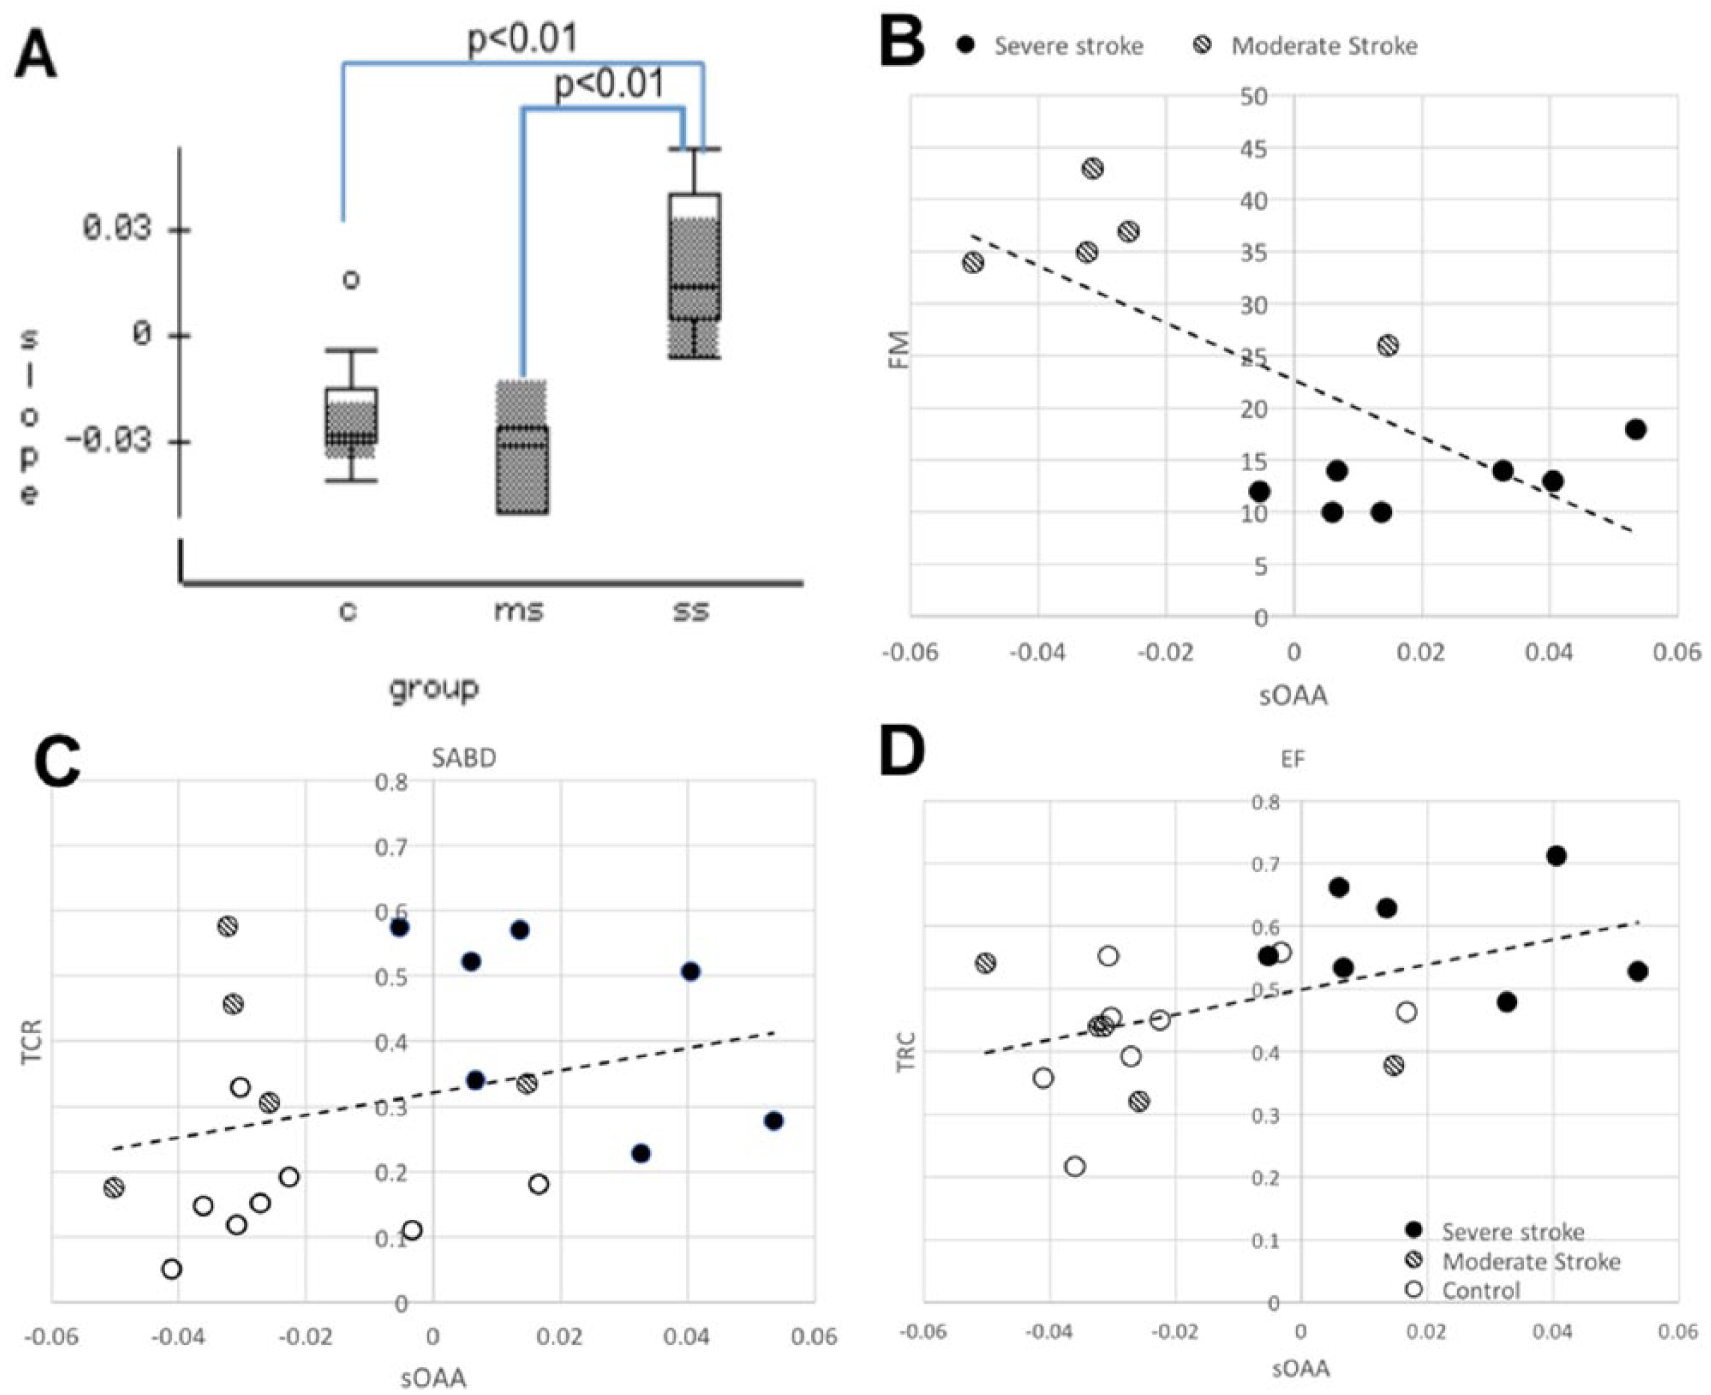
(A), The slope of overlapping active area (sOAA) over time for control (“C”), moderately impaired stroke (“ms”) and severely impaired stroke (“ss”) groups. (B-D), the scatterplots of Upper Extremity Fugl-Meyer Motor Assessment Assessment (UE-FM) (B), torque coupling ratio (TCR) for shoulder abduction (SABD) (C) and elbow flexion (EF) tasks (D) over sOAA, with their linear fits. In the subplots B and C, the open, lined, and solid dots represent data from control, moderate, and severe individuals, respectively.
Possible monotonic associations between sOAA with (1) UE-FMA scores and (2) TCRs of the 2 motor tasks were tested using a nonparametric Spearman test. Results reported that sOAA had significant moderate monotonic relationships with (1) UE-FMA scores (ρ = −0.512, P < .05), (2) the TCR of EF task (ρ = 0.450, P < .05), and (3) a close-to-significant weak relationship with the TCR of SABD task (ρ = 0.307, P < .1).
Discussion
Overlapping Active Areas for Shoulder and Elbow Motor Tasks
In this article, we quantified the overlapping active areas (OAAs) between the shoulder and elbow from 0.7 to 0.1 seconds prior to the torque onset. We showed that OAA decreased over time in both control and moderately impaired groups, indicating cortical activities over sensorimotor cortices between SABD and EF tasks separate more and more during motor preparation in these 2 groups. However, in severely impaired subjects, the OAA increased over time, reflecting less and less separation between cortical activities for elbow/shoulder tasks in this severely impaired group.
Cortical overlapping was previously reported in healthy control subjects in muscles that have similar actions within a joint, which may reflect an efficient way for cortex to drive synergetic muscle groups.30,31 More recently, during the motor command releasing phase (about 150 to 100 ms before the onset of a motor task), the cortical overlapping between SABD and EF was found to abnormally increase following stroke and the increased OAA was associated with an abnormal cross-joint torque coupling. 8 Results in the current study further demonstrated how the overlap developed during motor preparation. Our results showed that before −350 ms, cortical overlapping was not different among groups (Figure 4). However, when approaching motor onset, cortical activities for SABD and EF separated more and more in the control and moderately impaired groups, but less and less in the severely impaired group (see Figure 4). Such difference led to the significantly increased overlap after −350 ms in individuals with severe stroke.
Association Between the Increasing Overlap and Independent Joint Control
A nonparametric association analysis reported that sOAA had significant and moderate monotonic relationships with UE-FMA and the TCR during EF task, as well as close-to-significant weak relationship with TCR during SABD tasks. These associations implied that the increasing overlap of cortical activities between the 2 motor tasks may contribute to the expression of upper limb synergies in more severely impaired stroke individuals.
Possible Reasons for Increasing Versus Decreasing Overlap in Cortical Activity Patterns During Motor Preparation
Changes in cortical activity overlap during motor preparation, as quantified by sOAA, may reflect various motor preparation strategies used by different individuals. In healthy condition, the motor preparation optimizes the motor performance in a way to use separate neural resources for the different motor tasks. In the moderately impaired stroke group, despite damage to neural resources, there may still be enough residual cortical resources to allow for maximizing the use of “different” neural resources for “different” motor tasks. However, when a large amount of neural resources is damaged, as in individuals with severe impairment, the motor preparation tends to use more overlapping (or shared) resources for different motor tasks in order to recruit enough motor units, which in turn results in abnormal upper limb synergies.
Possible Limitations and Future Studies
Our experiment design controlled many confounding factors that may influence EEG signals during a self-initiated motor task, 14 such as force, preparation status, learning, speed, and precision. Remaining confounding factors are (1) the attention level and (2) the involvement of additional muscles. Our training session reduced the impact from the attention level. However, because of the difficulty in quantifying the attention level, it remains hard to fully control. We conducted a preliminary test of the effects of attention level and the involvement of muscles on sOAA and OAA valutes at differet times in a subset of our control subjects (n = 2). They performed (1) a 2-degree-of-freedom (2DOF) controlled motor tasks without visual feedback to match the SABD and EF muscle co-activation pattern presented in stroke subjects and (2) a single-degree-of-freedom (1DOF) controlled SABD and EF motor tasks with visual feedback. Compared with the main experimental protocol, the 2DOF experiment required higher attention level, and resulted in a muscle co-activation pattern similar to that obtained in stroke subjects; and the 1DOF with visual feedback experiment required less level of attention. Our results showed similar within-subject sOAA (in the range of −0.0196 to −0.022) for all of the 3 conditions, suggesting that the attention level and the involvement of additional muscles might have little impact on sOAA. In the same subset data, we observed that the baseline of OAAs for these 3 different motor tasks are different. For the main experimental protocol, all the 3 groups had similar baseline OAAs (mean ± standard error = 0.15 ± 0.007, see Figure 4), which is smaller than that for the 2DOF task (0.22 ± 0.003) and larger than that for the 1DOF task with visual feedback (0.13 ± 0.006). These results suggest that the baseline OAA and the absolute values of OAA at different times can be related to multiple factors, such as time, task, muscle co-activation, attention level, and so on. A full investigation of these effects is beyond the scope of this paper, and requires an increased sample size.
The validity of the OAA measure is determined by the validity of the inverse calculation, which has been tested using both simulated data and somatosensory evoked potentials from healthy control subjects. 29 We have further tested the reliability of this method in one individual with moderate stroke (S14) by measuring motor-task related EEGs in this subject twice during 1.5 months. The between-session relative absolute error, defined as

was 3%. This was about 40 times smaller than the relative between-group difference found in sOAA (111% between control and severe groups, and 112% between moderate and severe stroke groups).
The other limitation of this study is the small sample size. Using a well-controlled experimental protocol and relatively homogeneous samples, significant (P < .05) results were achieved with power of group-difference in sOAA larger than 90%.
Current evidence related to OAA and sOAA in healthy individuals and individuals with stroke are limited to flexion synergy between shoulder and elbow only (ie, between SABD and EF). Whether our findings can be expanded to other joints (eg, wrist and finger) within the flexion synergy, or to extension synergy is a question worth investigating in the future with increased sample size. Finally, to fully understand whether either OAA or sOAA is a unique feature only related to obligatory abnormal synergy but not voluntary muscle co-activation also requires a change to the current experimental protocol.
Clinical Implications
Our results showed that an increase in overlap of cortical activity during motor preparation (ie, a positive sOAA) was associated with the loss of independent joint control in individuals with severe stroke. This positive sOAA resulted in 27% more OAA value at the time of −0.1 seconds than that in a healthy condition. Such increased OAA is about 5 to 7 cm2 if considering the cortex as a flat surface or about 12.25 cm2 if considering sulci and gyri.
Currently, we still do not know whether interventions that target improving independent joint control in individuals with severe impairment32,33 will reduce overlap in cortical activity in this population. If so, then the increase in overlap of sensorimotor cortical activity during motor preparation, as observed in individuals with severe stroke, may indicate a maladaptation that should be prevented by an effective intervention.
Footnotes
Declaration of Conflicting Interests
The authors declared no potential conflicts of interest with respect to the research, authorship, and/or publication of this article.
Funding
The authors disclosed receipt of the following financial support for the research, authorship, and/or publication of this article: This work was supported by R01 (R01HD047569-01A1) and (2R01HD039343) from NIH, and a SDG (0435348Z) from American Heart Association.