
Abstract
Previous studies have shown that multiple sessions of reach training lead to long-term improvements in movement time and smoothness in individuals post-stroke. Yet such long-term training regimens are often difficult to implement in actual clinical settings. In this study, we evaluated the long-term and generalization effects of short-duration and intensive reach training in 16 individuals with chronic stroke and mild to moderate impairments. Participants performed 2 sessions of unassisted intensive reach training, with 600 movements per session, and with display of performance-based feedback after each movement. The participants’ trunks were restrained with a belt to avoid compensatory movements. Training resulted in significant and durable (1 month) improvements in movement time (20.4% on average) and movement smoothness (22.7% on average). The largest improvements occurred in individuals with the largest initial motor impairments. In addition, training induced generalization to nontrained targets, which persisted in 1-day and in 1-month retention tests. Finally, there was a significant improvement in the Box and Block test from baseline to 1-month retention test (23% on average). Thus, short-duration and intensive reach training can lead to generalized and durable benefits in individuals with chronic stroke and mild to moderate impairments.
Introduction
About 65% of stroke survivors experience long-term limitations in upper extremity (UE) functions. 1 In particular, limitations in arm reaching movements are prominent and correlate strongly with patients’ general impairment levels.2,3 After stroke, reaching movements often show increased movement time, multiple velocity peaks, and high variability.2,4,5 Movements in directions that require interjoint coordination are most impaired.6,7
Rehabilitation of UE functions in individuals post-stroke is clinically important because a substantial number of daily activities involve use of the arms and hands. 8 Task-specific intensive training over multiple sessions can improve UE function.9-22 In particular, multiple sessions of reach training, with or without rehabilitation robots,9,10,12-22 improve movement speed and smoothness,12,13,17,18,22 as well as clinical task scores,10-12,14,19,20 long-term gains,12,14 and generalization to untrained tasks.12,14
In clinical practice, however, both overall training time and the number of sessions are typically smaller than in clinical trials.23-26 It is therefore of high clinical importance to develop short-duration UE training methods that lead to long-lasting gains and that generalize beyond the trained tasks. The following studies have reported effects of short-duration training on UE function post-stroke. First, 70 reach trials in 1 session improved movement time and elbow–shoulder coordination. 4 Second, 60 reach-to-grasp trials in 1 session with trunk restraint induced more elbow extension, improved interjoint coordination, and reduced trunk movements. 27 Third, 200 reach trials in 1 session improved response time; the improvements were maintained at 24 hours, but not at 1 month. 28 Finally, training on a specific (feeding) task for 50 trials per day for 5 consecutive days improved performance and generalized 2 other untrained tasks. 21 These studies thus provide limited evidence (Class II, Level B 29 ) that short-duration reach training promote short-term gains in UE performance post-stroke. The effects of short-duration training on long-term gains, however, remain unclear.
Our purpose in this feasibility study is to evaluate the long-term and generalization effects of short-duration intensive reach training in individuals with chronic stroke and mild to moderate impairments. Previous research suggests that training of arm movements post-stroke should include 3 important characteristics. First, because the amount of practice is the most important parameter in motor learning, it has been recommended that individuals post-stroke perform as many repetitions per session as they can tolerate. 30 Second, practicing challenging tasks, but not simple repetitive tasks, is likely to elicit motor learning and associated neural reorganization.31-33 Performance-based positive and negative feedback helps keep tasks challenging.34,35 Third, trunk restraint during reaching is important to enhance recovery of arm function.27,36 This feasibility study tested the hypothesis that 2 sessions of unassisted intensive reach training with trunk restraint combined with performance-based feedback will produce long-lasting (1 month) improvements in both trained and untrained movements.
Methods
Participants
Sixteen participants with ischemic or hemorrhagic stroke with mild to moderate impairments (63.2 ± 2.7 years; 2 females), subsequently referred to as the stroke group, were recruited (see Table 1). Potential participants were included if they (a) were at least 6 months post-stroke; (b) had residual capability to move their UE (Upper Extremity Fugl-Meyer motor score >19/66); (c) had the ability to follow and remember instruction (Mini-Mental State Examination score >25/30) 37 ; and (d) were able to perform an unassisted reach to the farthest target displayed at 40 cm from the anterior edge of the Arm Reach Training (ART) system table. Participants were excluded if they had (a) any neurologic diagnoses other than stroke; (b) peripheral movement restrictions, such as neuropathy; (c) orthopedic disorders affecting the paretic UE; (d) severe pain or sensory impairment in the more affected UE; or (e) visual neglect (more than 4% of lines left uncrossed on Albert’s test). 38 All enrolled participants scored 0 on Albert’s test.
Demographic Information for the 16 Participants Enrolled in the Stroke Group.
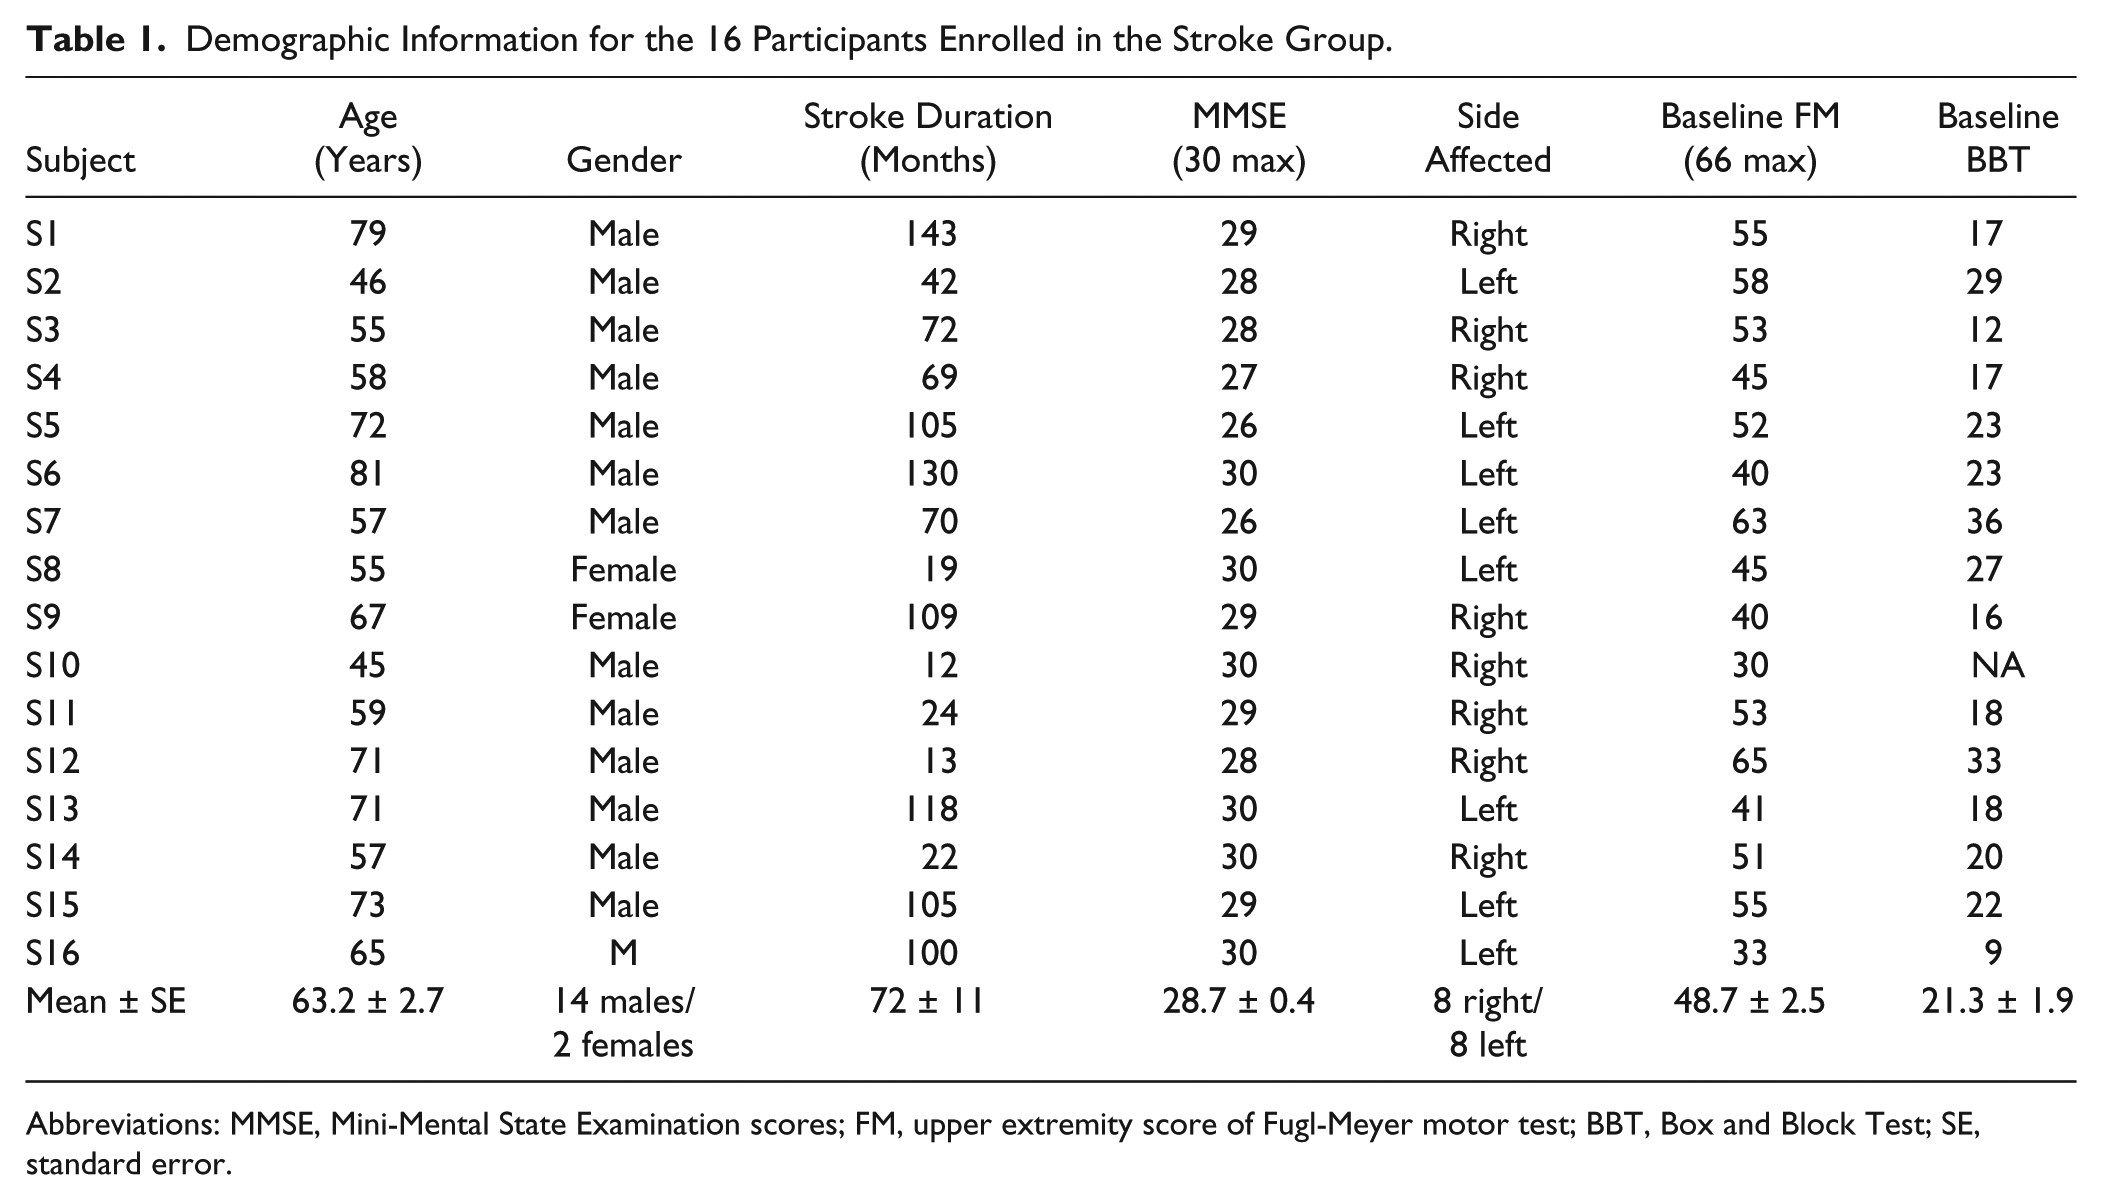
Abbreviations: MMSE, Mini-Mental State Examination scores; FM, upper extremity score of Fugl-Meyer motor test; BBT, Box and Block Test; SE, standard error.
Ten non-disabled age-matched participants (56.6 ± 2.9 years; 5 females), subsequently referred to as the control group, were recruited for a comparison of reaching performance. Only right-hand dominant people were included as assessed by the Edinburgh Handedness Inventory. 39 This study was approved by the University of Southern California’s Institutional Review Board, and all participants signed an informed consent prior to study enrollment.
Study Design
We used a within participant, repeated-measures design. Participants in the stroke group visited the laboratory 5 times over 6 weeks (see Figure 1A). The first visit comprised clinical tests, familiarization with the ART system (see Figure 1B and below), and a baseline Box and Block Test (BBT). In the following week, participants visited the laboratory for 3 consecutive days. The first 2 days were training days, with training preceded and followed by arm reach tests (see below). On the third day, a 1-day retention reach test was given, as well as a second BBT. In the fourth week following training, a final 1-month reach retention test and a final BBT were given. Thus, participants in the stroke group performed a total of 6 arm reach tests (at Pre1, Post1, Pre2, Post2, 1-day and 1-month—see Figure 1A), and a total of 3 BBTs (at baseline, 1-day, and 1-month). Participants in the control group visited the laboratory a single time, during which they familiarized themselves with the ART system and then performed a single arm reach test.
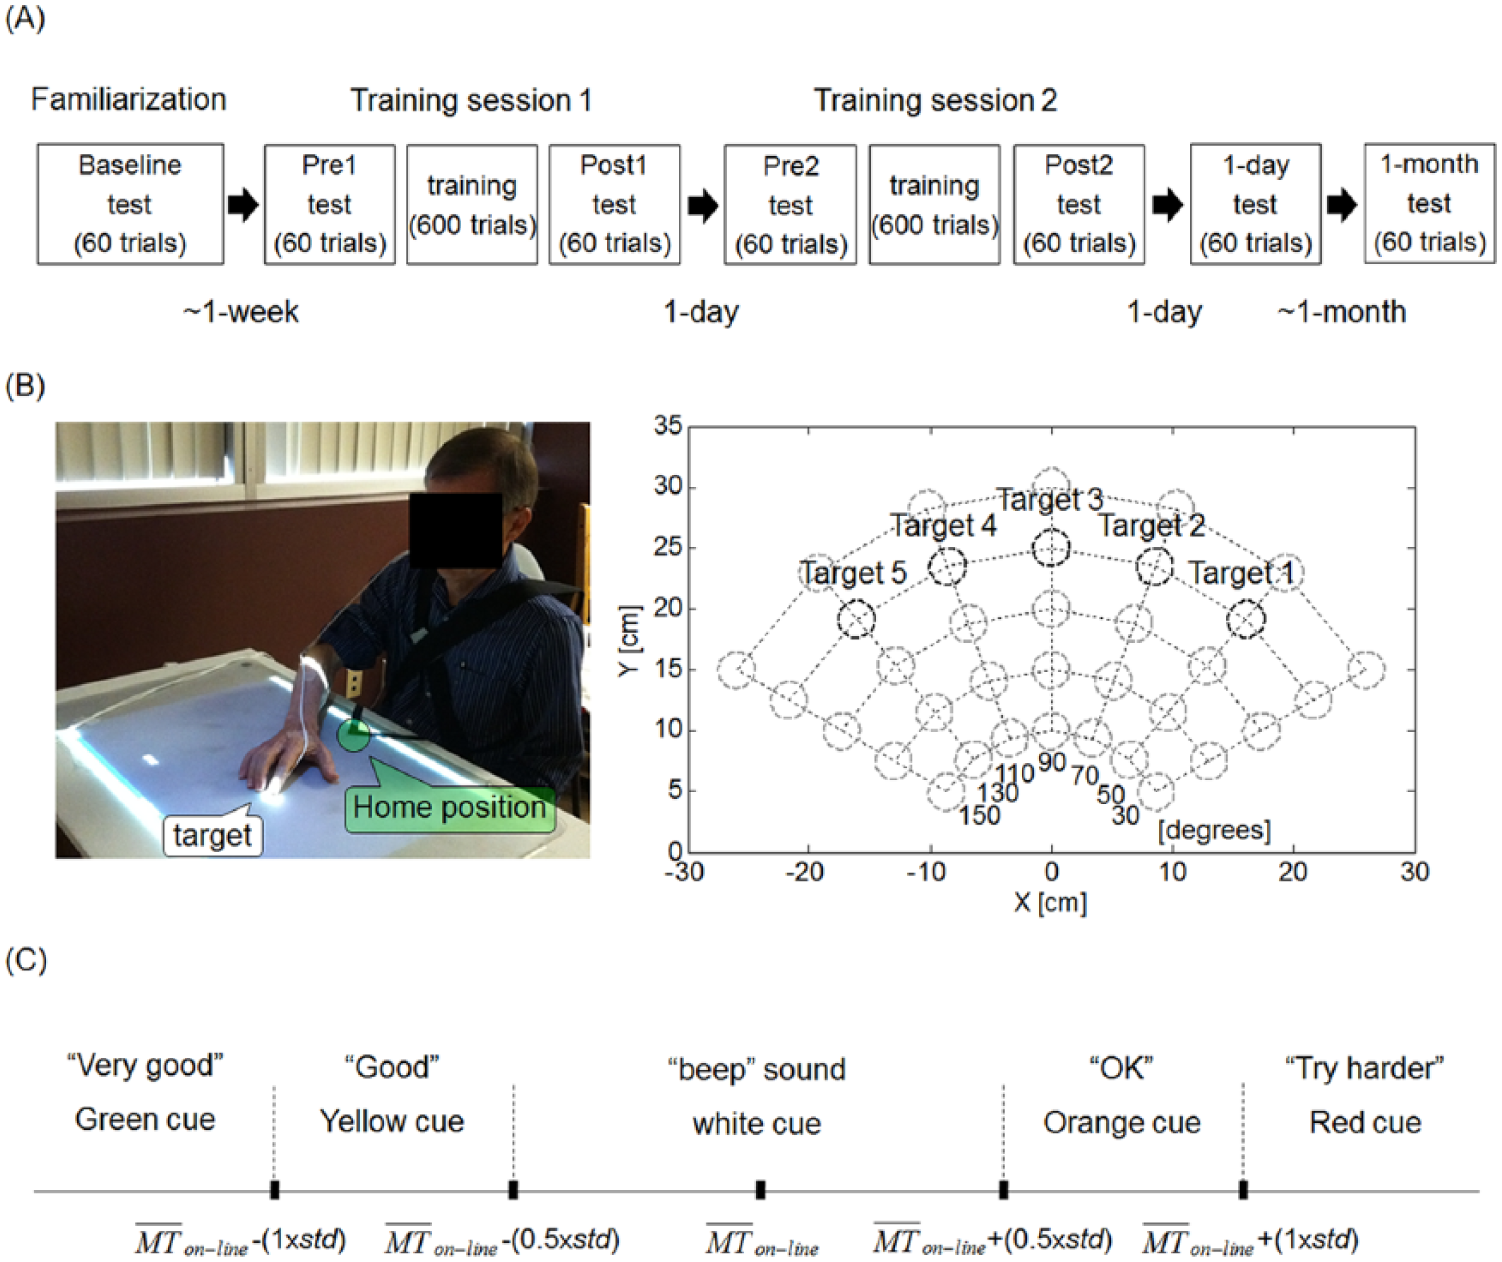
Experimental design and the Arm Reach Training (ART) system. (A) Diagram showing the timing of the 5 visits over a 6-week period for the stroke group. (B) Left: ART system: the home-position is identified by the green circle and a target by the white circle. For each trial, participants were instructed to reach to the target with their index fingertip (of more affected hand in stroke group and dominant hand in control group) as quickly as possible. Right: Diagram showing the location of the 35 test targets in the 2-dimensional workspace. The 5 targets at 25 cm (black circles) are the training targets. (C) Illustration of the 5 possible types of visuo-auditory feedback cues at the end of a training trial based on comparison of MTon-line to the mean and standard deviation of the movement time (mean MTon-line and std) computed in 20 previous trials (except for the first block: see Method).
Training consisted of 600 trials per session, given in 6 blocks of 100 trials each. Blocks were separated by rest periods of at least 5 minutes. Each block was composed of 20 trials to each of the 5 training targets, presented in pseudo-random order (see Figure 1B and below). Note that the total number of trials was constant, but the session duration varied based on movement times and resting periods (participants could request longer rest periods). Each test consisted of 60 trials: 5 trials to each of the 5 training targets in pseudo-random order, and then 35 trials, one to each of the 35 test targets, also in pseudo-random order (see Figure 1B and below).
The Arm Reach Training System
During both testing and training with the ART system, participants were seated on a chair with a seat belt to restrain trunk movements. 36 A magnetic sensor (miniBird 500, Ascension Technology, Milton, VT) was attached to the participant’s index fingertip of the more affected hand in the stroke group and the dominant hand in the control group to monitor reach performance. A second sensor was attached to the lateral epicondyle of the humerus to monitor elbow movements. Sensor data were recorded at 120 Hz and low-pass filtered (second-order Butterworth filter with 5-Hz cutoff frequency) for data analysis.
At each training trial, a projector displayed 1 of 5 targets included in the training set. These targets were located on an 80° arc of 25 cm radius centered on the home position (Figure 1B, right panel). At each test trial, the projector displayed 1 of 35 targets, located on 5 equidistant 120° arcs centered on home position with radii ranging from 10 to 30 cm (Figure 1B, right panel). The diameter of each target was 3 cm.
The timing of each trial (in both training and testing) was as follows: After the participants placed their index finger on the home-position, a target appeared on the table and an audio “Ready” sound was played. After a 1-second delay, a “Go” sound was played, and the participants were instructed to move their index finger to the target as quickly as possible. To avoid overshooting, participants were instructed to keep their finger on the target for 500 ms. After this time, the target disappeared, and the home-position reappeared. One second later, a new target appeared. The maximum movement time allowed for each trial was 5 seconds. To minimize compensatory elbow movements during training, an unpleasant beep was played when the magnetic sensor attached to the elbow moved above two thirds of the height between the table and the acromion. For all subjects except for two, the threshold was high enough so that this feedback was not played beyond the familiarization phase. For the other 2 subjects, feedback was played only one time during training.
Visuo-Auditory Feedback
Following each training trial, ART provided 1 of 5 possible feedback signals based on the participant’s online movement time, MTon-line. MTon-line was computed using the time interval from the movement start (time at which the tangential velocity of the index fingertip first crossed the 30 cm/s threshold) to the movement end (time when the fingertip entered the target, with the condition that the finger remained on the target for 500 ms). At each trial, the feedback cue was selected based on comparing MTon-line to the mean (
Clinical Assessments
The upper-extremity score of the Fugl-Meyer motor (FM) test 40 was performed on the first visit by HP or SK. SK, a physical therapist with more than 2 years of clinical experience and certified in the administration of the FM test, graded the FM scores. The BBT 41 was performed at 3 time points (see above). All participants completed all ART test and training sessions as well as all clinical assessments, with the exception of one participant who did not complete the BBT at baseline due to a scheduling conflict.
Data Analysis
Movement time (MT) for offline data analysis was computed by the interval between the time at which the index finger’s tangential velocity exceeded 5% of maximum velocity 42 and the time at which the velocity fell below 5% of maximum velocity with the fingertip inside of the target. MTon-line and MT were highly correlated (r = .988 and P < .0001, Pearson). Movement smoothness was assessed by the number of peaks in the velocity profile during MT. 17 Peaks were identified by changes in sign (from positive to negative) in the acceleration profile.
Mixed Regression Models
We performed linear mixed model analysis (using SPSS 18) with either MT or number of peaks as dependent variable and with subjects’ random intercepts. To test for short- and long-term training effects, we included Test (Pre1, Post1, Pre2, Post2, 1-day, and 1-month follow-up test) as a fixed repeated factor. To test for training-induced generalization effect of target distance and number of peaks, target distance (D), ranging from 10 to 30 cm, with 5-cm increments, and the cosine of the target angle (cos(150 − q), where q was the target angle ranging from 30° to 150°), were included as covariates. Interaction terms Test × D and Test × cos(150 − q) were included. Model comparisons (using the Bayesian information criterion [BIC]) showed that repeated measures were best modeled with an autoregressive moving average (ARMA(1,1)).
Because of our small data pool, we combined the data from participants with left and right hemiparesis. The data were “flipped” along the midline, so that all participants in the stroke group “behaved” as right hemiparetic participants. To validate this approach, we fitted individual models of MT in Pre1 with target distance (D) and cosine of the target angle (cos(150 − q)) to determine whether spatial movement characteristics were qualitatively similar between subjects and symmetric across the midline for left and right hemiparesis. Bonferroni correction was used for multiple pairwise comparisons. The level of statistical significance was set at P < .05. All results were reported with mean ± standard errors (SE).
Results
Demographic Information and Overall Training Time
Average stroke duration was 72 ± 11 months, and the average FM score was 48.7 ± 2.5 (Table 1). The control and stroke groups did not differ in age (t-test, P = .117). All participants in the stroke group completed the 600 trials in each training session and successfully reached all targets within 5 seconds. Performing 600 movements lasted on average 106.0 ± 2.9 minutes (range = 63.9-143.5 minutes).
Figure 2 shows examples of reaching movement for Pre1 (before training), 1-day, and 1-month retention tests for 2 participants post-stroke. The effect of training in decreasing MT and the number of peaks, both in 1-day and in 1-month retention tests, are especially striking for the more impaired participant.
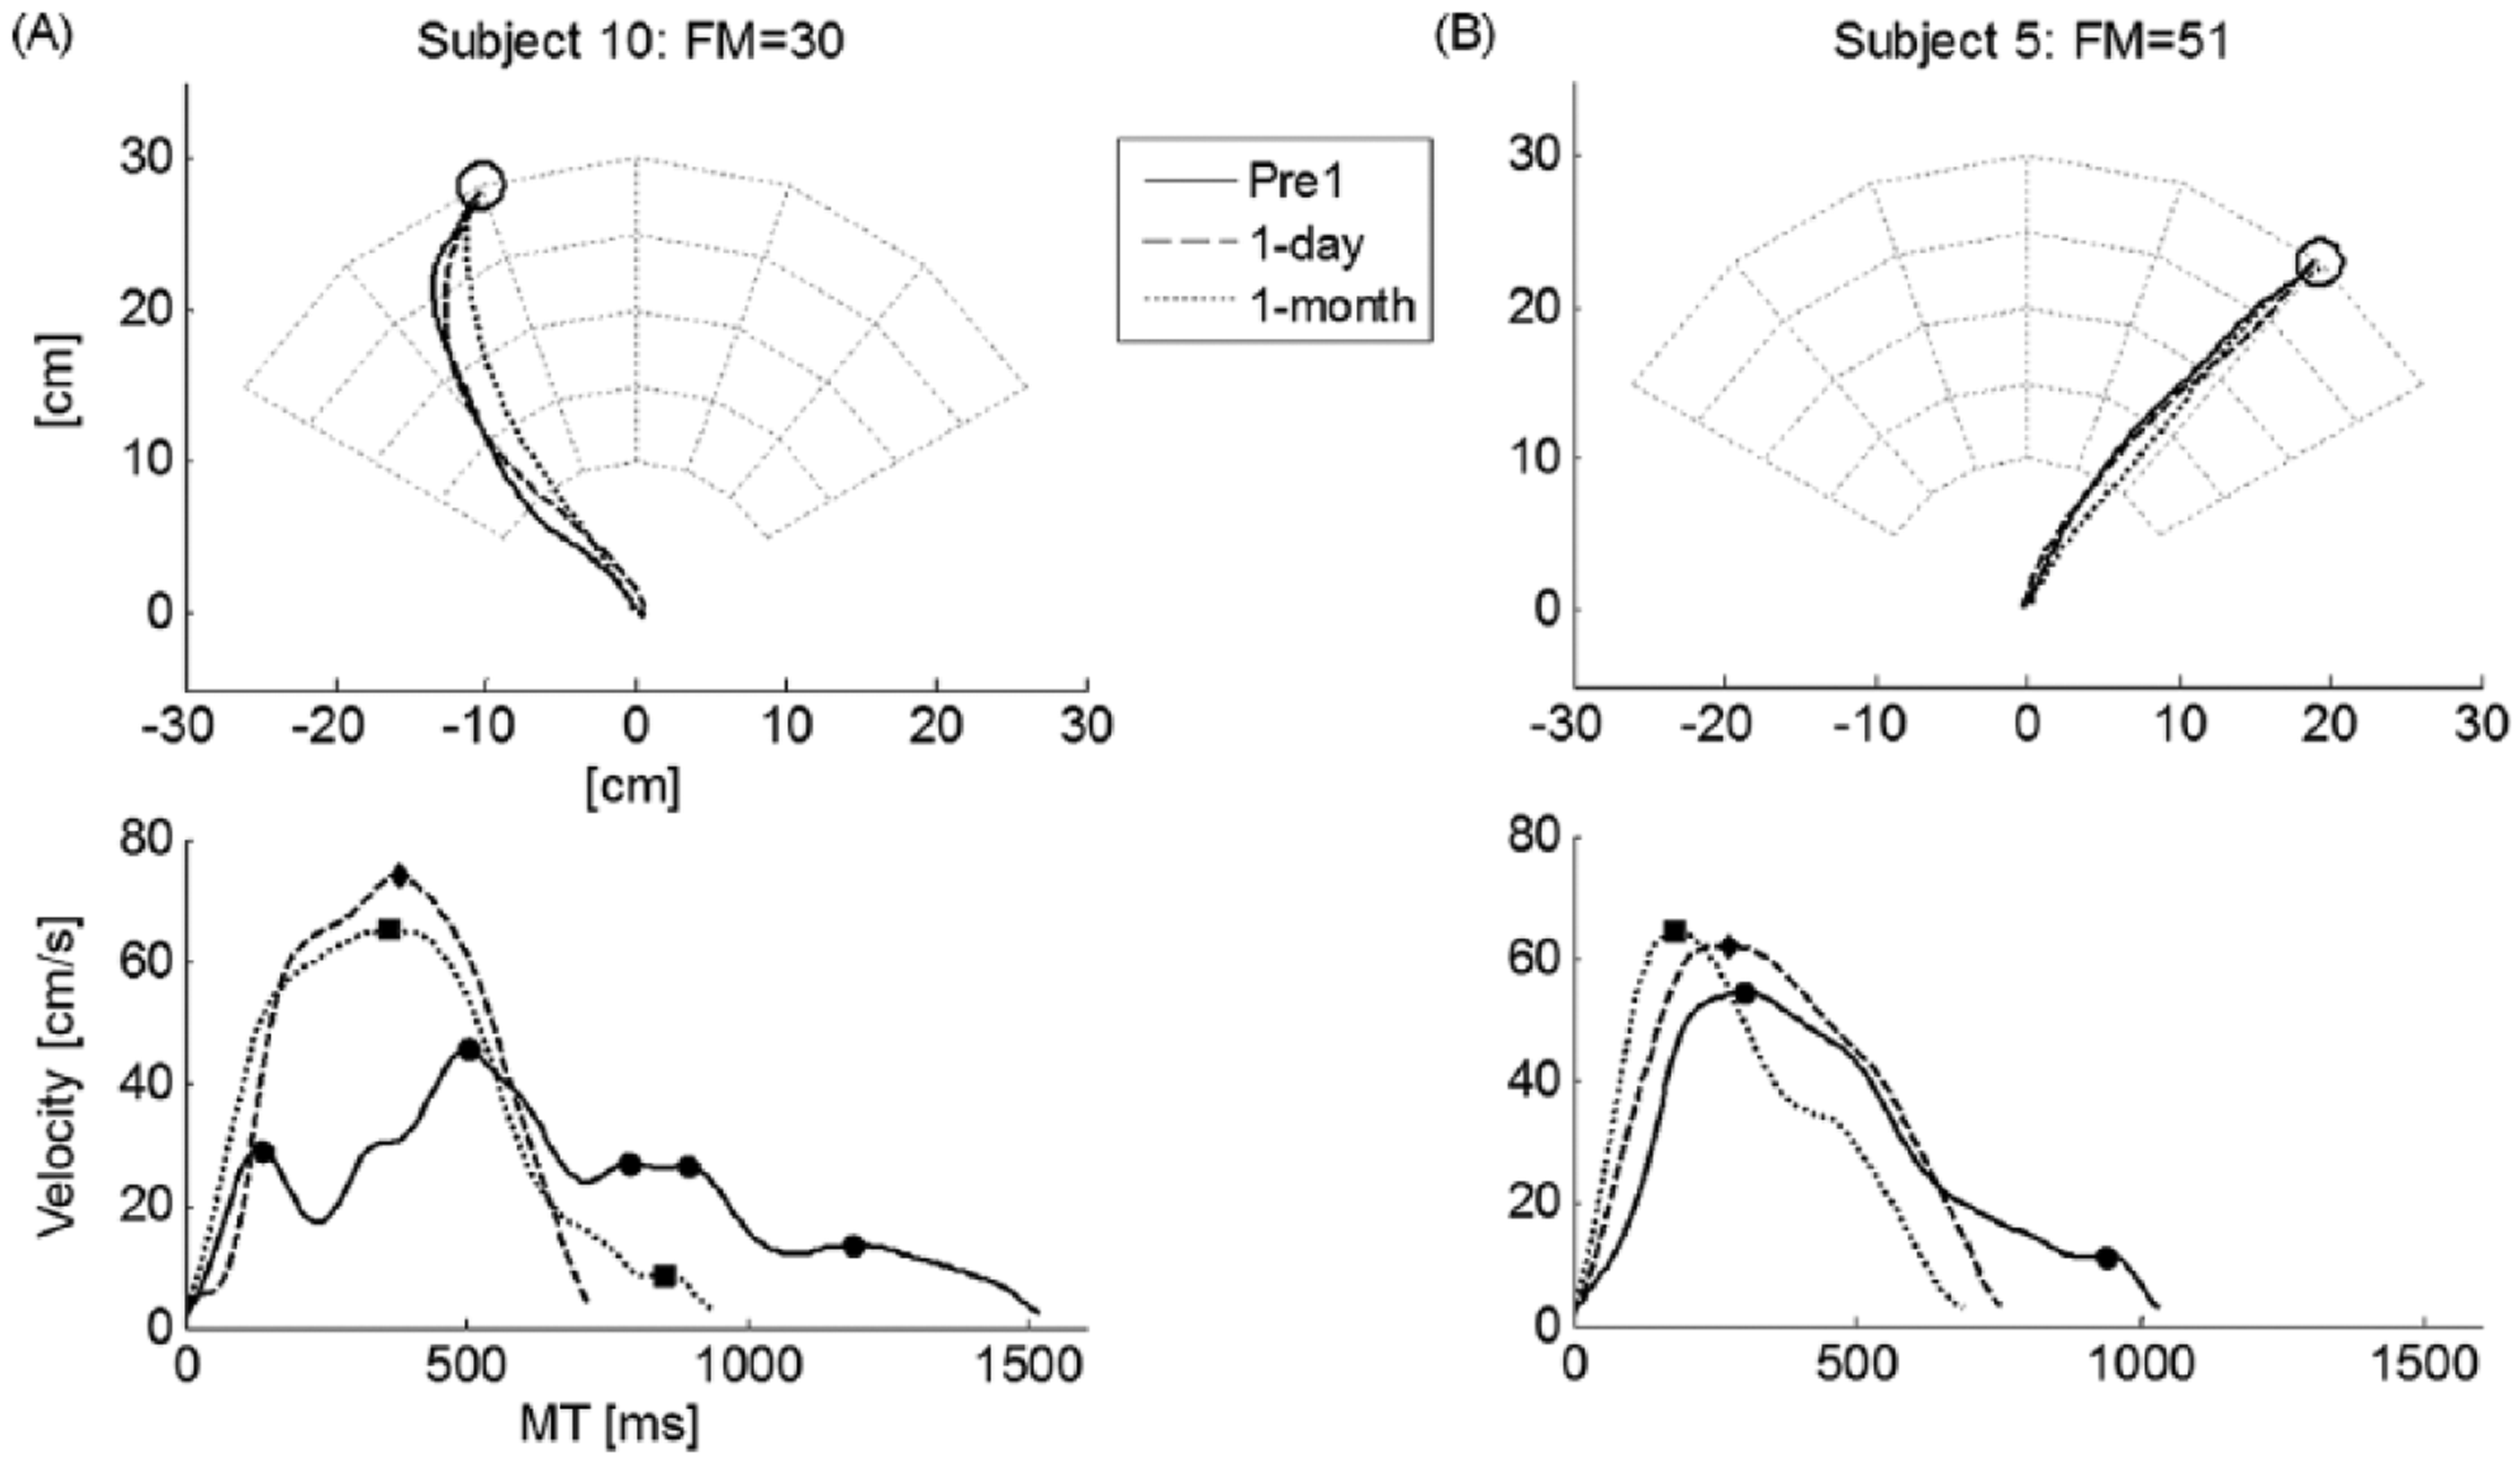
Examples of hand paths and tangential hand velocities before and after training for 2 subjects post-stroke (Subject 10 and Subject 5 from Table 1) in Pre1-test and in 1-day and 1-month retention tests. First row: Hand path. Second row: Tangential velocities and number of peaks (indicated with filled symbols: circle for Pre1-test, diamond for 1-day retention test, and square for 1-month retention test). Notice how Subject 10 on the left, with relatively high severity score (FM = 30/66), shows a large decrease in movement time and number of peaks compared with the Subject 5 on the right with a lesser severity score (FM = 51/66).
Movement Time at Baseline
We first tested for the stability of our MT measure before any training. We confirmed that there was no difference in mean MT between baseline (performed during the familiarization phase) and Pre1 (MT was 731 ± 11 ms, 721 ± 15 ms, paired t test, P = .347; baseline data from 15 participants was used because data from 1 participant at baseline was corrupted). In addition, MT had good test–retest reliability across the 2 tests as shown by an intraclass correlation coefficient of 0.806 (95% confidence interval = 0.769-0.836; P < .0001).
Before training, MT in the stroke group was, on average, larger than in the control group (stroke group: 740 ± 47 ms; control group: 400 ± 19 ms; t-test, P < .0001). Note that both groups showed larger MTs in movements with larger target distances and at greater angles from midline (Figure 3A [Pre1] and B). Overall, for the stroke group, there was a significant negative correlation between initial FM score and initial MT at Pre1 (R2 = .53, P < .001).
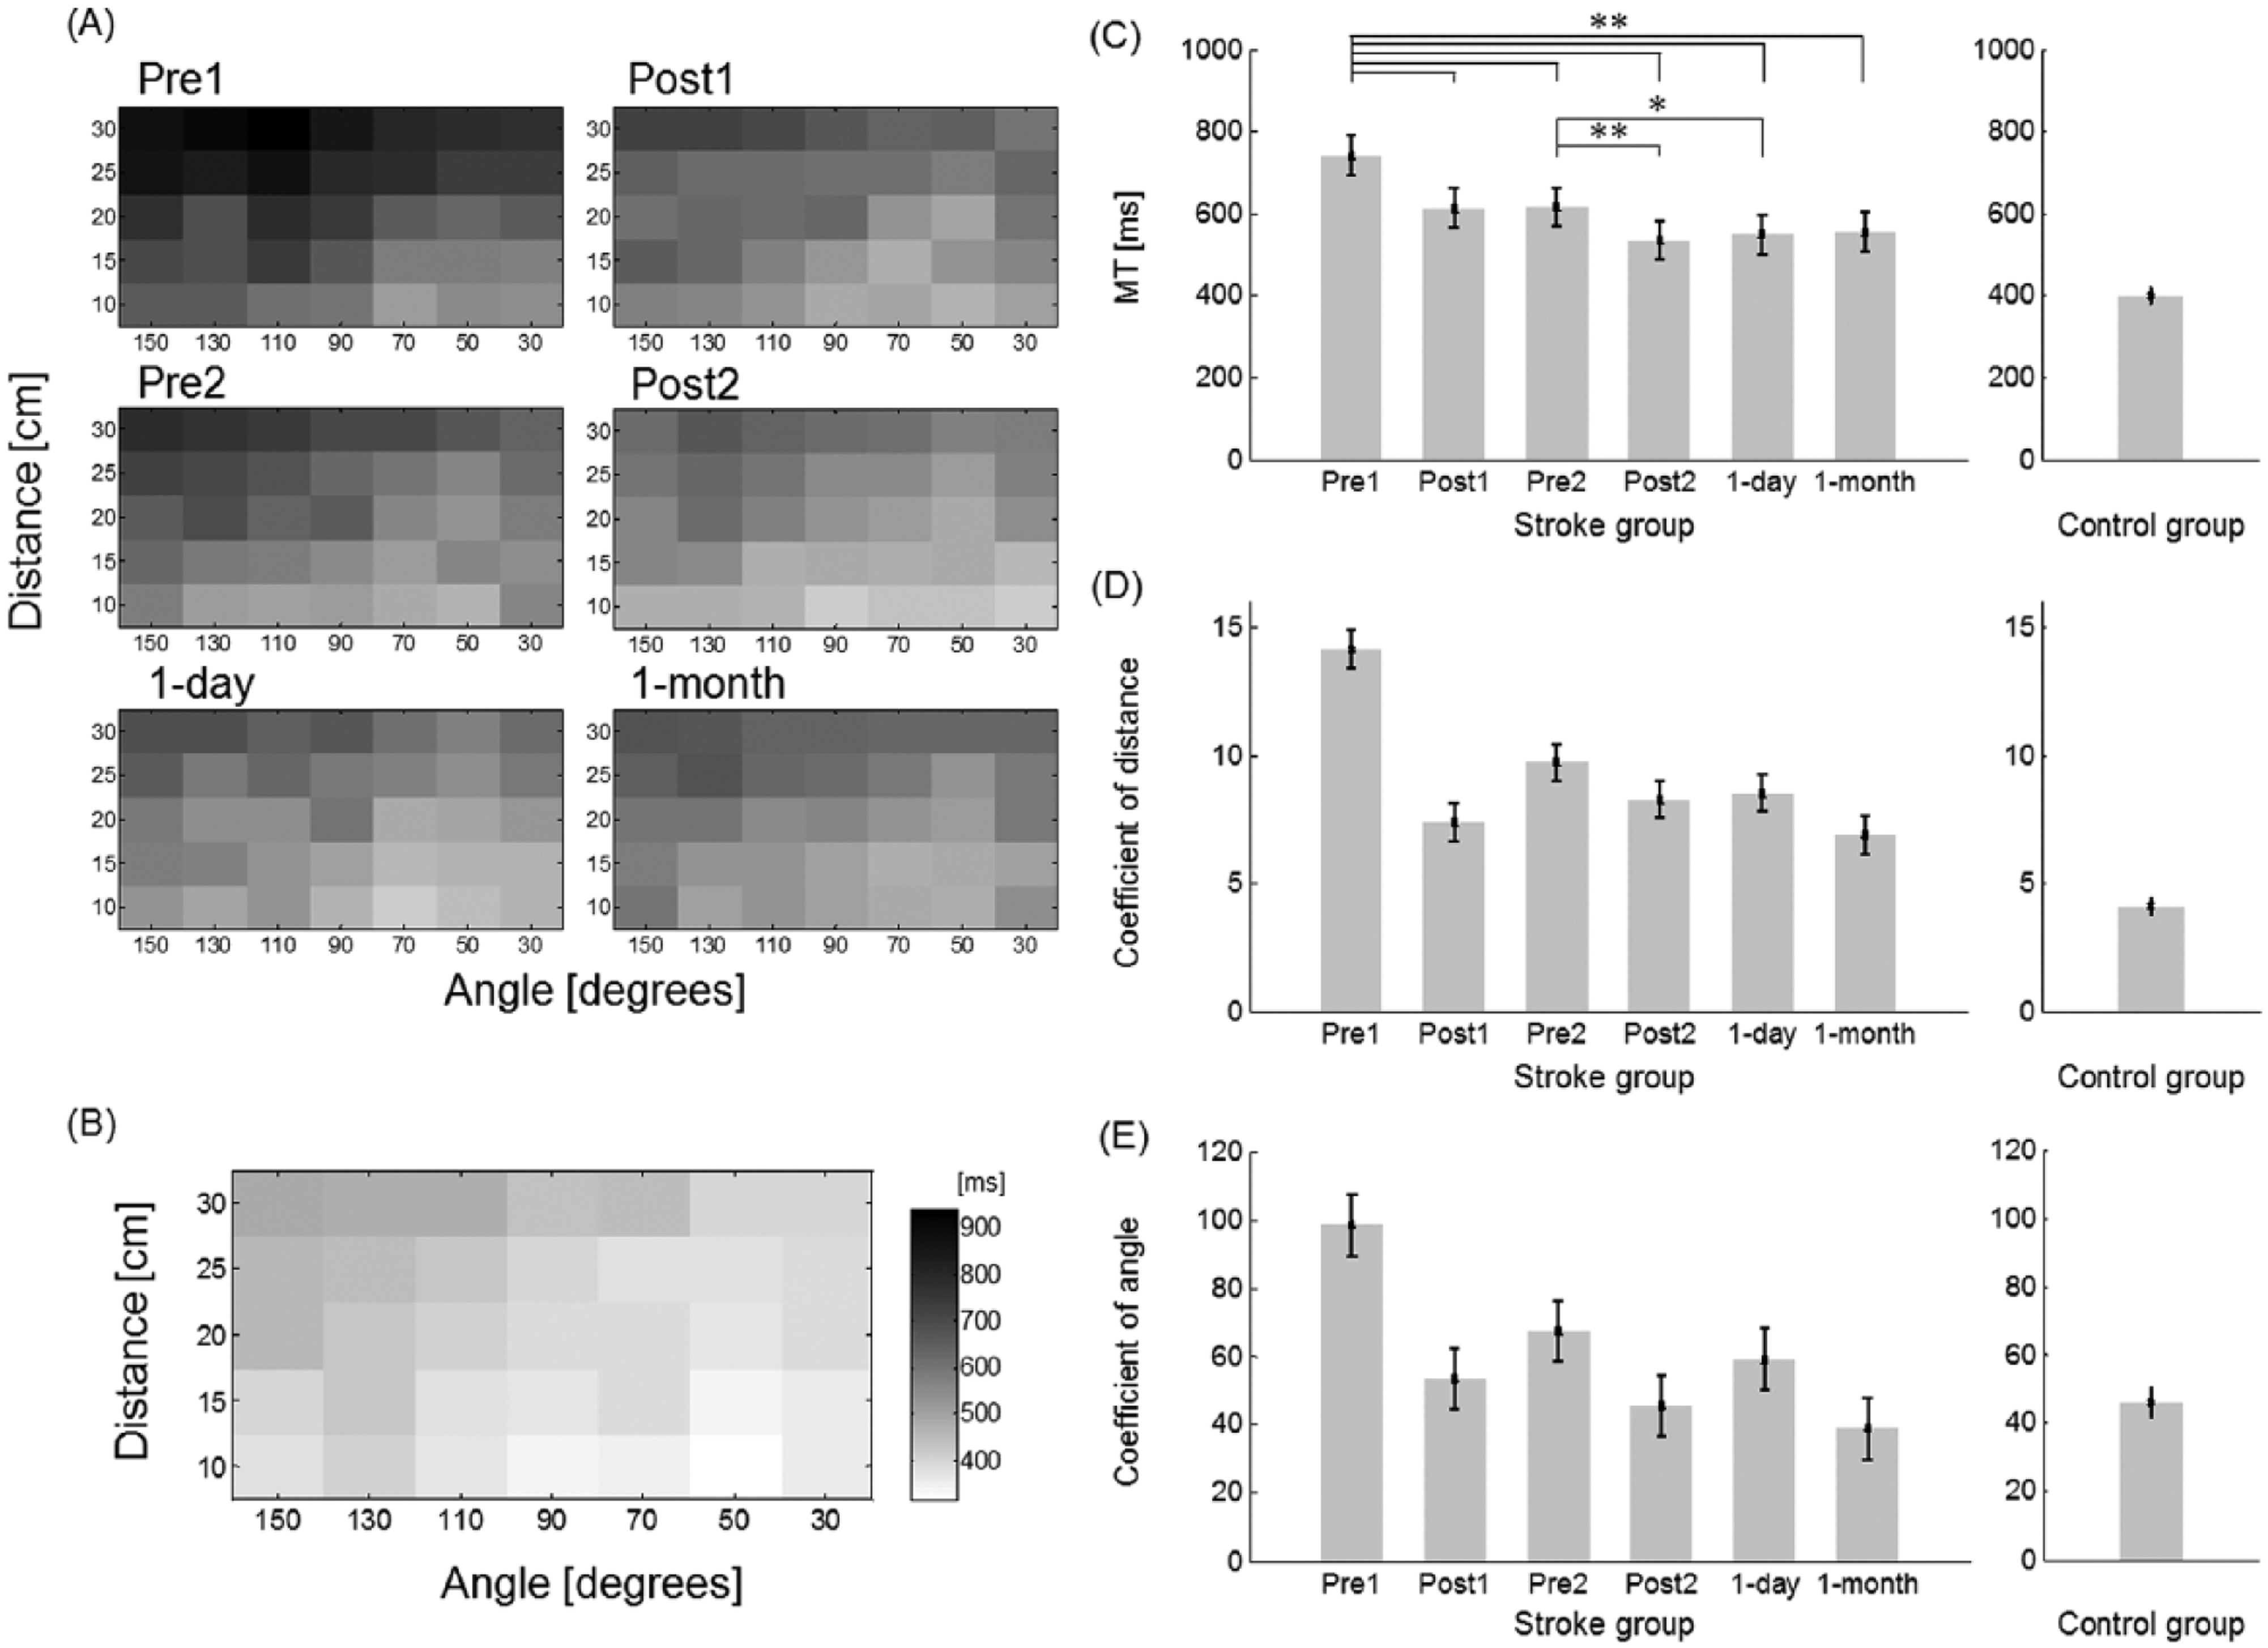
(A) Mean movement time in the stroke group across the test sessions. (B) Mean movement time in the control group. (C) Overall movement time before, during, and after training in the stroke group shows a significant and long-lasting (1 month) reduction of MT following training. (D) Regression coefficient of target distance (Test × D) in each test in the mixed regression model shows a long-lasting reduction of the effect of distance on MT in the stroke group. (E) Regression coefficient of target angle (Test × cos(150 − q)) in each test in the mixed regression model shows a long-lasting reduction in the effect of angle on MT in the stroke group. *P < .007, **P < .0001.
We fitted individual models of MT in Pre1 with target distance (D) and cosine of the target angle (cos(150 − q)). In the control group, 6 (out of 10) participants showed a significant effect of target distance, and 9 participants showed a significant effect of target angle. In the stroke group, all participants showed a significant effect of target distance, and 13 (out of 16) participants showed a significant effect of target angle (6/8 with left hemiparesis and 7/8 participants with right hemiparesis).
Decrease in Movement Time With Training
Overall MT decreased with training in the stroke group (Figure 3A and C). MT was greater in Pre1 (740 ± 47 ms) than in Post1 (614 ± 47 ms), Pre2 (617 ± 47 ms), Post2 (535 ± 47 ms), 1-day (548 ± 47 ms), and 1-month (556 ± 47 ms) (all P < .0001), and MT was greater in Pre2 than in Post2 (P < .0001) and 1-day (P = .007). Both the distance and angular coefficients in the mixed regression model decreased with training, with the decrease maintained in 1-day and 1-month retention tests (see Figure 3D and E). The distance coefficients of each test decreased from 14.1 ± 0.7 in Pre1 to 6.9 ± 0.7 at 1-month (Figure 3D). The angular coefficients decreased from 98.3 ± 9.0 in Pre1 to 39.0 ± 9.0 at 1-month (Figure 3E). All fixed factor terms in the model (Test, Test × D, and Test × cos(150 − q)) were significant (P < .014 or less), showing overall improvements in MT due to training, but also specific improvements of MT for targets at greater distances and at greater angles. For comparison, the coefficients of distance and angle were 4.11 ± 0.3 and 46.1 ± 4.3, respectively, in the control group.
Change in Movement Smoothness
The control group generated a single peak for most movements, with no patterns across distance and angle (1.06 ± 0.02, range from 1.0 to 1.3), whereas the average number of peaks before training in Pre1 in the stroke group (2.22 ± 0.19, range from 1.5 to 2.8) was significantly greater than in the control group (2.22 ± 0.19; t test, P < .0001). At Pre1, there was strong correlation between MT and number of peaks (R2 = .85, P < .001) and between initial FM and number of peaks (R2 = .65, P < .0002).
The overall number of peaks decreased with training in the stroke group (Figure 4B). The number of peaks in Pre1 (ie, 2.22 ± 0.19) was greater than in Post1 (ie, 1.68 ± 0.18), Pre2 (ie, 1.80 ± 0.18), Post2 (ie, 1.44 ± 0.18), and 1-day (ie, 1.66 ± 0.18), and 1-month (ie, 1.67 ± 0.19) (all P < .0001). The number of peaks was greater in Pre2 than in Post2 (P < .0001) (Figure 4B).
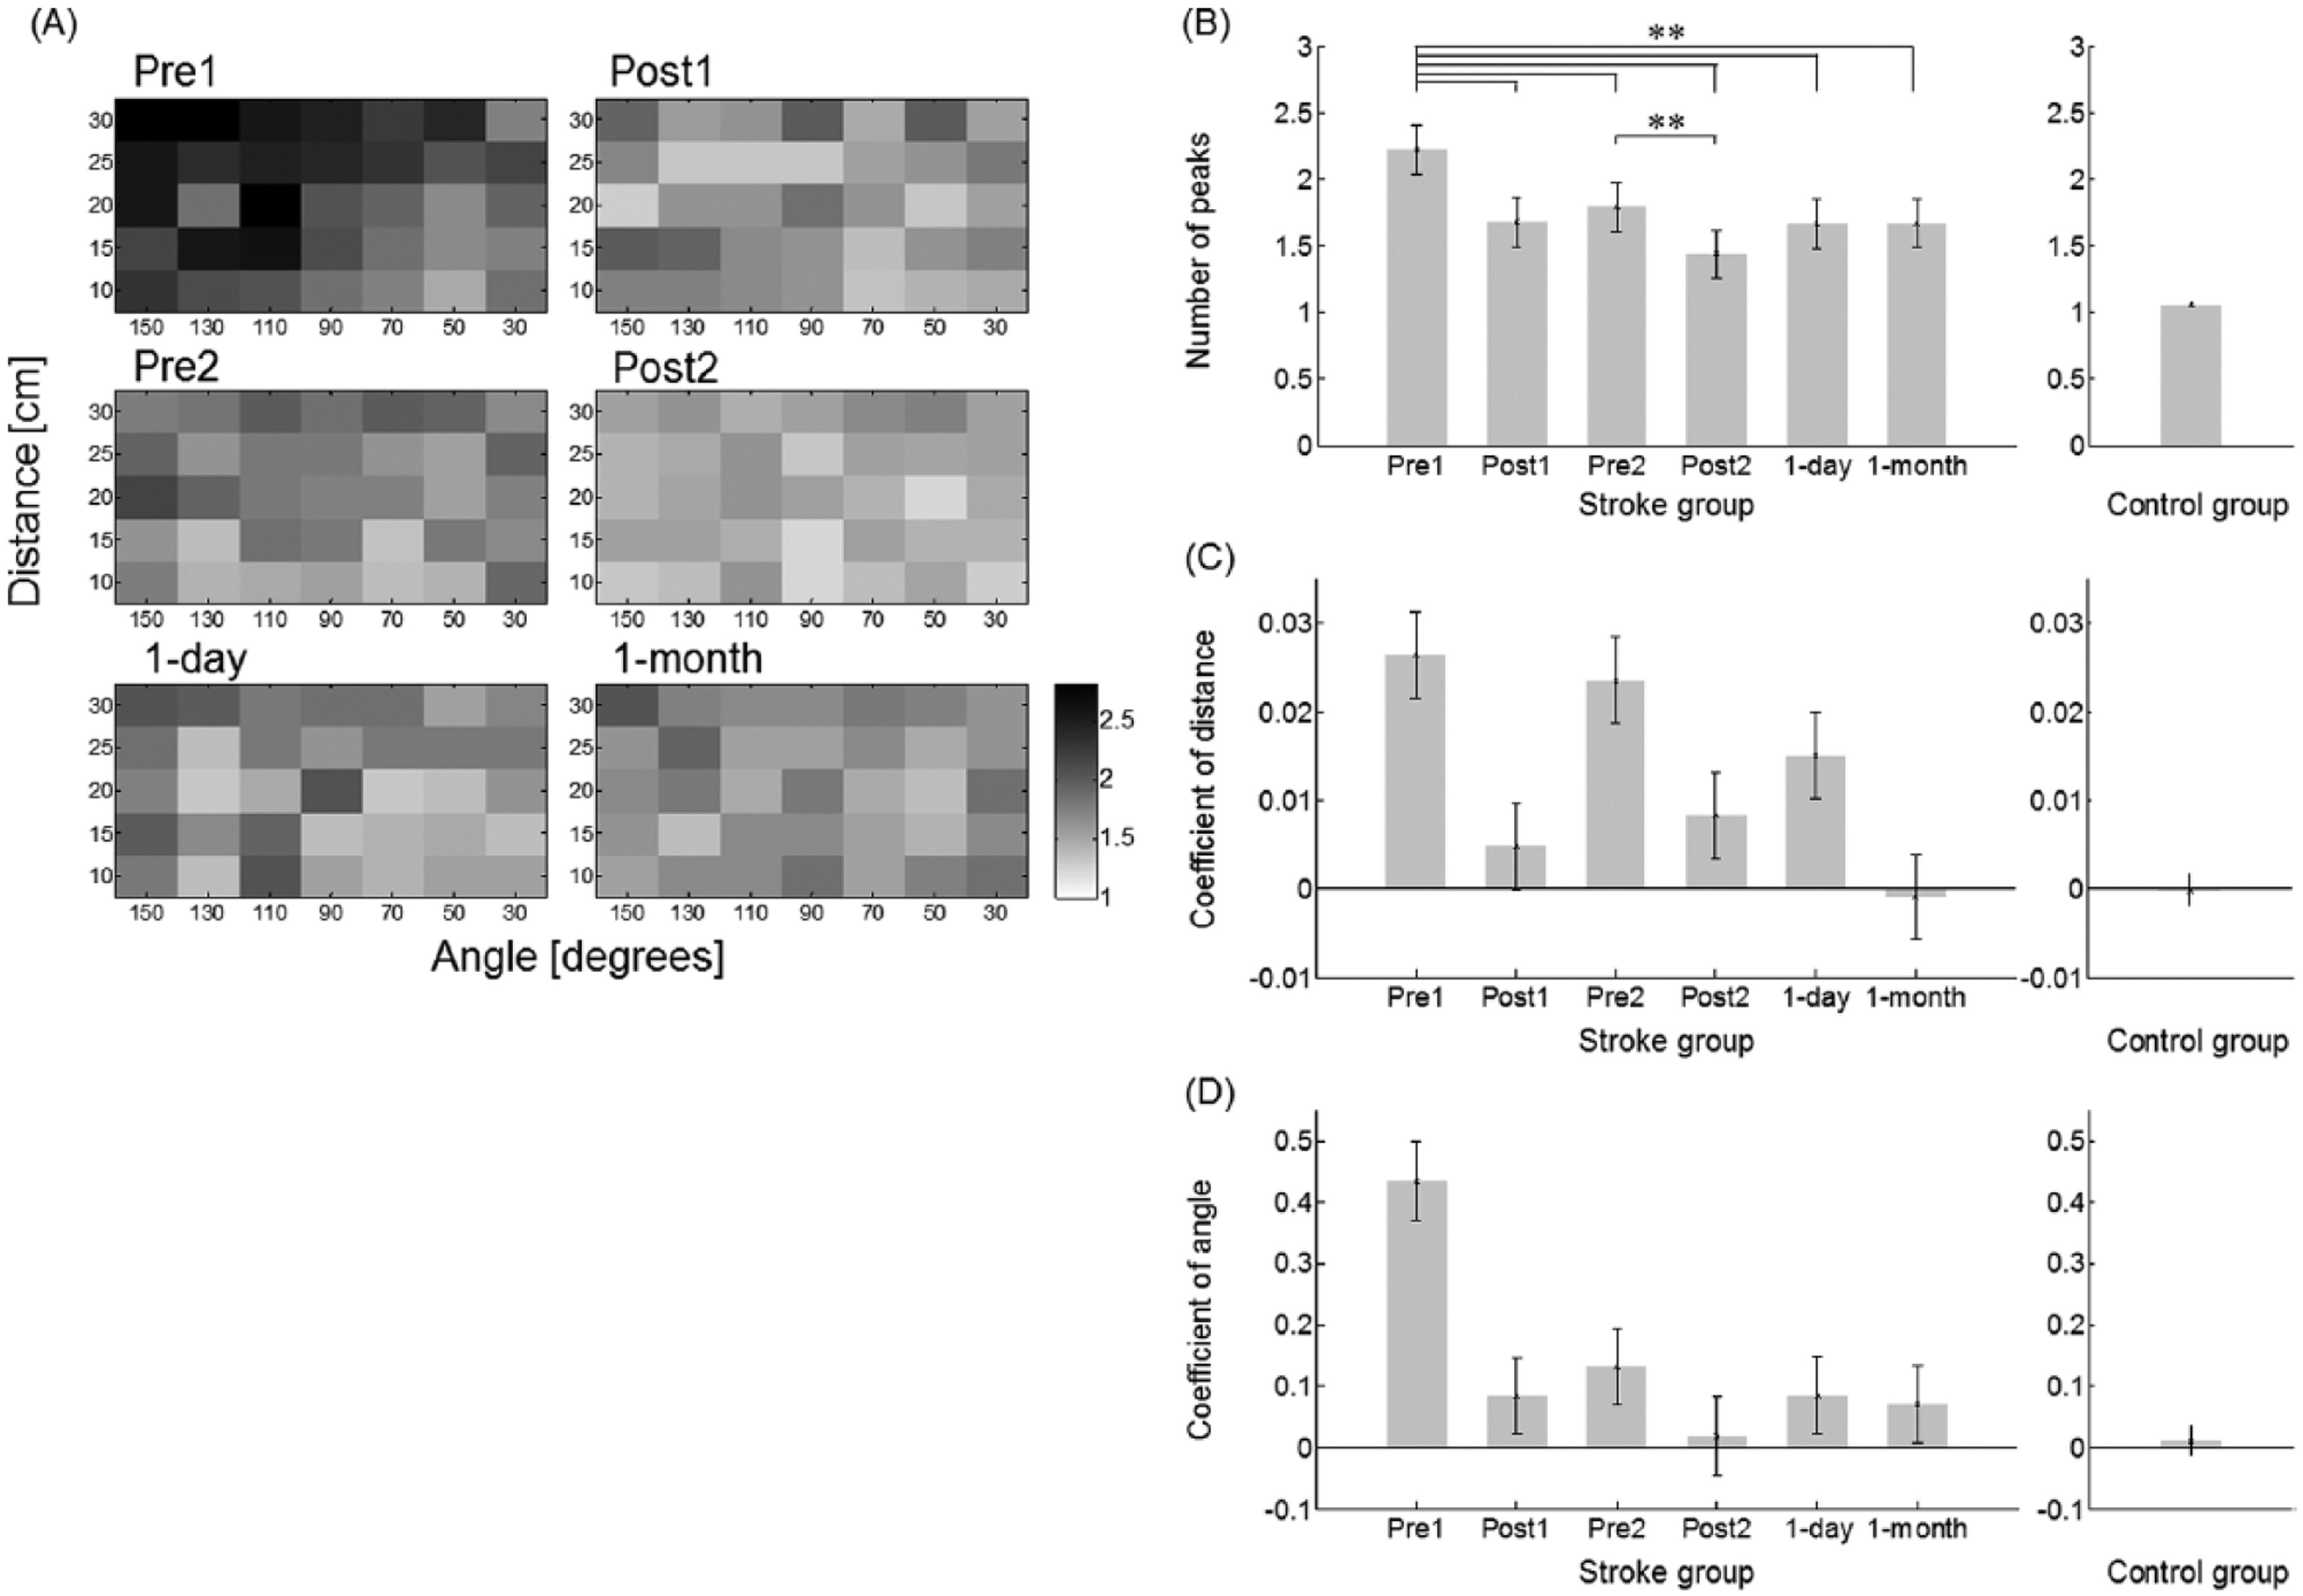
(A) Mean number of peaks in the stroke group across test sessions (results for the control group are not shown because the mean number of peaks is very close to one for all movements). (B) Overall number of peaks before, during, and after training shows a significant and long-lasting (1 month) reduction in the number of peaks following training. (C) Regression coefficient of target distance (Test × D) in each test in the mixed regression model shows a long-lasting reduction of the effect of distance on number of peak in the stroke group. (D) Regression coefficient of target angle (Test × cos(150 − q)) in each test in the mixed regression model shows a long-lasting reduction in the effect of angle on number of peak in the stroke group. **P < .0001.
Similarly to movement time, both the distance and angular coefficients in the mixed regression model for movement peaks decreased with training (Test × D and Test × cos(150 − q), both P < .0001), with the decrease maintained in 1-day and 1-month retention tests (Figure 4C and D). The distance coefficients decreased from 0.027 ± 0.005 in Pre1 to −0.001 ± 0.005 at 1-month (Figure 4C). The angular coefficients decreased from 0.435 ± 0.06 in Pre1 to 0.071 ± 0.06 at 1-month (Figure 4D). For comparison, the coefficients of distance and angle were −0.0002 ± 0.002 and 0.011 ± 0.024, respectively, in the control group.
Score Change in Box and Block Test
From the baseline to the 1-day and the 1-month retention tests, the stroke group showed improvements in the BBT (Baseline: 21.3 ± 1.9; 1-day 26.3 ± 2.5; and 1-month 26.3 ± 2.4 blocks). At both the 1-day and 1-month retention tests, the number of blocks moved with the affected limb increased 23% from baseline (paired t test, P = .004 and P = .004, respectively). In addition, the change in BBT between baseline and 1-month significantly correlated with the change in MT between Pre1 and 1-month (R2 = .56, P = .001; change in BBT between baseline and mean change in MT between Pre1 and 1-day; R2 = .025, P = .061). Note that for the BBT, the minimum detectable change is 18%. 43 Ten out of 15 participants exceeded this threshold between baseline and 1-day, and 10 participants exceeded this threshold between baseline and 1-month.
Relationship Between Initial Performance and Change in Performance
The degree to which participants improved in MT and number of peaks directly related to performance at the beginning of training. The mean initial MT showed a significant linear association with the mean change in MT (ie, ΔMT) between Pre1 and 1-day (R2 = .77, P < .001) and between Pre1 and 1-month (R2 = .68, P < .001) (Figure 5A). The initial number of peaks show a significant linear association with the mean change in number of peaks (ie, Δpeaks) between Pre1 and 1-day (R2 = .80, P < .001) and between Pre1 and 1-month (R2 = .84, P < .001) (Figure 5B).
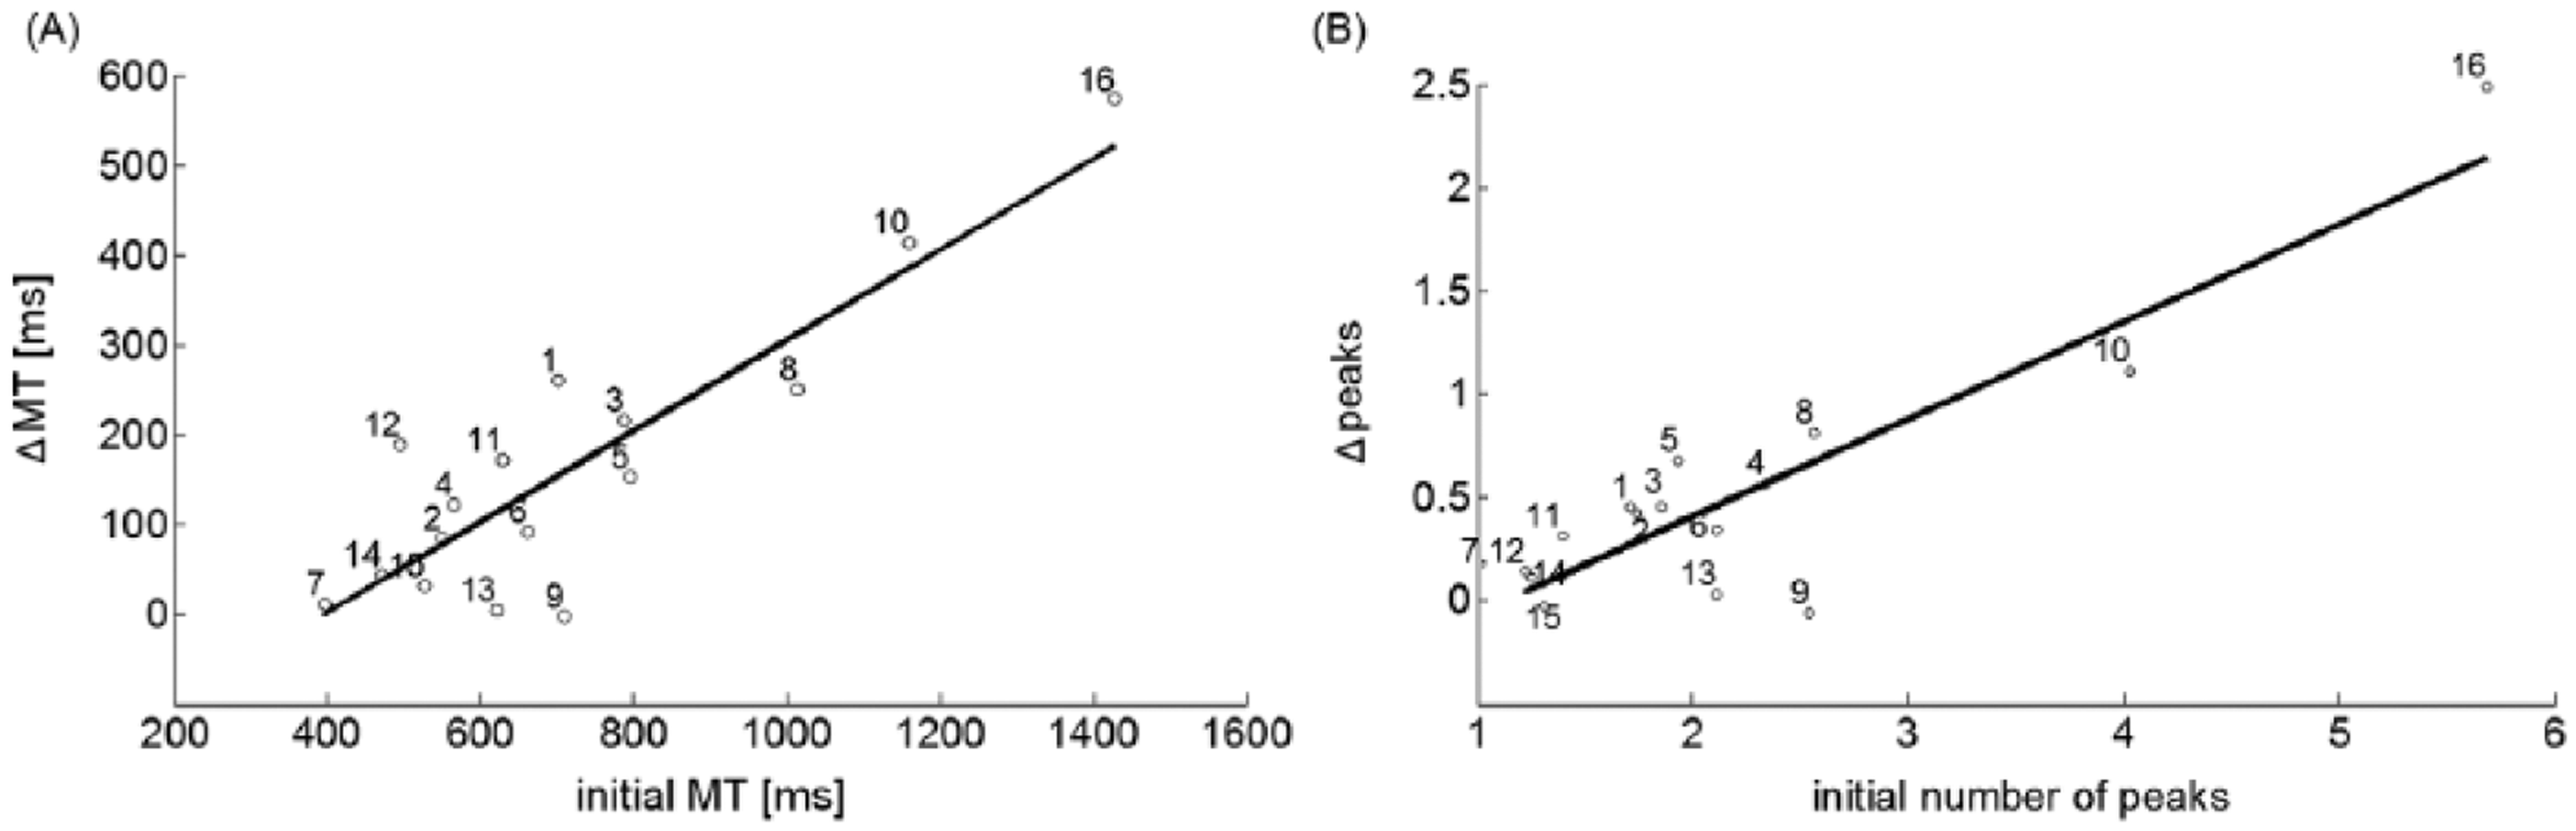
Relationship between initial performance and change in performance between Pre1-test and 1-day retention test in stroke group. (A) Linear relationship was significant between initial MT and ΔMT. (B) Linear relationship was significant between initial number of peaks and Δpeaks.
Discussion
The main result of this feasibility study is that short-duration and intensive reach training with visuo-auditory feedback can significantly improve movement time and movement smoothness in individuals with chronic stroke and mild to moderate impairments. Compared to the Pre1, MT decreased on average 22.8% at the 1-day retention test and 20.4% at the 1-month retention test. Similarly, the number of peaks in the velocity profile decreased on average 22.8% at the 1-day retention test and 22.7% at the 1-month retention test. The improvements were proportional to the initial impairments, that is, participants with the slowest movements or greatest number of peaks at the Pre1 showed the greatest gains in both quantities in absolute terms. The gain (23% on average) on the BBT at 1-month, and the significant correlation between mean changes in MT and changes in BBT at 1-month, suggest that the effect of task-specific arm reach training transfers to untrained motor tasks and is long-lasting.
In both groups, movement times were longest for far targets to the left and shortest for close targets to the right. Pretraining results in the stroke group (Figure 3D, Pre1) are in line with a previous study showing that Fitts’s slope and intercept 44 were greater for the affected arm compared to the unaffected arm post-stroke. 5 In addition, posttraining results show that training brings the Fitts’s slope closer to that of non-disabled participants (Figure 3D), possibly because of a decrease in weakness, a decrease in spasticity, or both. Increased movement times for targets contralateral to the impaired arm, that is, in the direction of the greatest inertia at the hand, have been previously reported in non-disabled participants, 45 and have been explained by a “constant effort” strategy. 46 Studies have found that participants post-stroke have difficulties controlling movements to contralateral targets, because of a reduced ability to account for interaction torques. 47 Thus, although MTs to the left were longer than MTs to the right in both groups, participants in the stroke group showed greater modulation of MT as a function of target angle. Training, however, reduced this angular influence on movement time (Figure 3E) and number of peaks (Figure 4D). Movements became smoother after training, notably in movements to contralateral targets, possibly because of a decrease in weakness and improvement in compensating the interaction torques for these movements.
The long-term (1-month) improvements and generalization effects that we observed may be the direct result of motor learning during training. However, another, nonexclusive, possibility is that the improvement in arm function due to training resulted in greater arm use in daily activities compared to pretraining. Such greater arm use may have, in turn, contributed in maintaining, or even improving in some participants, overall arm function.48,49 Indirect evidence for such increased generalization is shown in the decreased effect of target distances and angles at 1-month compared to 1-day posttraining for both movement time and number of peaks (see Figures 3D, E and 4C, D). Indeed, the number of peaks is constant across target angles or distance at 1-month, whereas it shows significant effects of angles and distances at 1-day posttraining (Figure 4A, C, D). In future work, we will measure both arm function and arm use during and after training, using our new bilateral arm reach test. 50
When instructed to move quickly, individuals post-stroke generate faster and smoother reaching movements than when instructed to move at preferred speed. 51 Thus, could the decreases in movement time and in number of peaks in our study simply be instruction-dependent, with no actual improvements due to training? We believe that this is not the case, because our instructions emphasized moving as quickly as possible in all testing and training sessions. In addition, training induces robust changes, as shown by the strong correlation (R2 > .77) between the initial MT and the gain in MT (Figure 5A), and by the significant correlation between mean changes in MT and changes in BBT between baseline and 1-month.
The main limitation of our feasibility study is the within-sample design with no stroke control group. There is little possibility, however, that the improvements in performance between Pre1 and the 1-day and 1-month retention tests was due to spontaneous recovery, because the participants were in chronic stage (ie, the minimum duration post-stroke since stroke 12 months). There was no correlation between duration since stroke and change in MT (R2 = .03, P = .50, at 1-month) or number of peaks (R2 = .007, P = .76, at 1-month). A second limitation is that, based on the observation of left–right symmetry in Pre1 MTs, we did not differentiate between right and left hemiparesis. A future larger study should include either left or right affected individuals, or better both, to account for differences in motor control and motor learning between individuals with left and right brain damage.52,53 A third limitation is that we did not collect data about the lesion (ie, ischemic or hemorrhagic location, etc), nor did we collect data about depression and fatigue, which have been associated with quality of life 54 and functional outcome, 55 respectively.
In summary, our results suggest that 2 sessions of unassisted intensive reach training can induce long-term performance changes in patients with mild to moderate impairments, who can perform reaching movements without gravity support. Although we are not aware of data describing gains in arm function after 2 sessions of traditional physical therapy, we believe that such gains are smaller than in our study, because patients perform much fewer movements in each session of traditional physical therapy than in our study. A study, conducted in the United States, reports an average of 53 active movements, and of these, on average 32 are functionally oriented movements. 56 Although it is probably difficult to increase the number of movements per day much beyond 600 movements, the number of training sessions can be increased for those participants who have the potential to improve further. However, the most effective dose of training is still unknown, and more is not necessarily better. 57
Footnotes
Acknowledgements
We thank Cheol Han for assistance with ART and members of the MBNL and CNRL labs at USC for useful comments.
Declaration of Conflicting Interests
The authors declared the following potential conflicts of interest with respect to the research, authorship, and/or publication of this article: N. Schweighofer, C. Winstein, and J. Gordon are coauthor on a patent, owned by the University of Southern California, that has some overlap with the proposed study. Upper Limb Measurement and Rehabilitation Method and System US 20100179453 A1
Funding
The authors disclosed receipt of the following financial support for the research, authorship, and/or publication of this article: This work was supported in part by NIH Grants R01 HD065438 and MC-IIF 299687.