
Abstract
This study explores the relationship between lesion location and volume and upper limb spasticity after stroke. Ninety-seven stroke patients (51 with spasticity) were included in the analysis (age = 67.5 ± 13.3 years, 57 males). Lesions were traced from computed tomography and magnetic resonance images and coregistered to a symmetrical brain template. Lesion overlays from the nonspastic group were subtracted from the spastic group to determine the regions of the brain more commonly lesioned in spastic patients. Similar analysis was performed across groups of participants whose upper limb (elbow or wrist) Modified Ashworth Scale (MAS) score ranged from 1 (mild) to 4 (severe). Following subtraction analysis and Fisher’s exact test, the putamen was identified as the area most frequently lesioned in individuals with spasticity. More severe spasticity was associated with a higher lesion volume. This study establishes the neuroanatomical correlates of poststroke spasticity and describes the relationship between lesion characteristics and the severity of spasticity using mixed brain imaging modalities, including computed tomography imaging, which is more readily available to clinicians. Understanding the association between lesion location and volume with the development and severity of spasticity is an important first step toward predicting the development of spasticity after stroke. Such information could inform the implementation of intervention strategies during the recovery process to minimize the extent of impairment.
Introduction
One common consequence of stroke is spasticity—a velocity-dependent increase in tonic stretch reflexes. 1 Upper limb spasticity is associated with poorer function, 2 in part due to restrictions in range of motion and speed of limb movements. 3 As a positive symptom of the upper motor neuron syndrome, poststroke spasticity occurs due to changes in the net balance of excitatory and inhibitory inputs on spinal-level circuitry secondary to injury in higher order centers or in their descending pathways (ie, pyramidal or parapyramidal fibers).4,5
While the physiological mechanisms that lead to spasticity are generally understood, the link between the neuroanatomical correlates and clinical observations are less established. Little is known about the characteristics of stroke lesions (ie, location and volume) that modulate muscle tone and stretch sensitivity; although, recent reports associate severe spasticity (Modified Ashworth Scale [MAS] ≥ 2) with injury to subcortical structures. 6 In spite of this, there is variability in brain regions identified as being associated with the observed presence of spasticity. For example, Ryu and colleagues reported that 87/104 (84%) of the individuals with spasticity presented with ischemic or hemorrhagic strokes involving the anterior or middle cerebral arteries. 7 Other authors have identified the basal ganglia, thalamus, and capsule as specific neuroanatomical substrates of spasticity based on lesion overlays in 4 subjects with spasticity. 8 This apparent variability in the anatomic correlates of spasticity is a potential contributor to the variability in clinical presentation, assessment, and efficacy of spasticity management protocols.
Brain lesion profiles, which combine both lesion location and lesion volume, are important predictors of the severity of motor impairments. These profiles reveal stronger correlations to functional outcomes than lesion size only. 9 Lesion location (independent of volume) is also associated with the extent of motor recovery. This is apparent from reports linking recovery with lesions sparing the motor cortex 10 or those reporting greater motor impairment with lesions involving the corticospinal tracts. 11 While lesions have functional and location-dependent consequences in relation to paresis, a similar relationship with spasticity has not been clearly identified. Observing differences in lesion overlaps between stroke survivors with and without spasticity is one approach to probing this relationship.
Analysis using lesion–symptom mapping can reveal relationships between sites of brain injury and behavioral outcomes and can be used to associate stroke infarct characteristics with specific behavioral phenotypes. 12 Using computed tomography (CT) or magnetic resonance imaging (MRI), lesion–symptom mapping has revealed relationships between brain lesion characteristics and functional outcomes, motor recovery, 9 and gait, 12 though by the correlational nature of such studies, causality cannot be claimed. Nevertheless, evaluating these relationships can expand our understanding of what characteristics of a stroke lesion may correlate with spasticity and could help in clinical management.
In an effort to systematically examine the relationship between the presence and severity of spasticity with stroke lesion size and location, the current study aimed to investigate the neuroanatomical correlates of upper limb spasticity after stroke through the use of clinical scans and manual lesion tracings. A better understanding of the association between brain lesion profile and severity of spasticity could complement predictive models for spasticity, 13 which, in turn, could affect the implementation of spasticity-management protocols in the early stages after stroke when the potential for recovery may be the highest. Given the pathways implicated in the pathophysiology of spasticity 14 and neuroanatomical correlates of severe spasticity, 6 we hypothesized that subcortical lesions would better correlate with spasticity after stroke than cortical lesions.
Methods
Subjects
Study data were retrospectively drawn from the Heart and Stroke Foundation Canadian Partnership for Stroke Recovery Longitudinal Database. This database is used to prospectively track stroke recovery longitudinally from 5 partnering rehabilitation hospitals using a battery of standardized clinical measures. Participants in the database provided written informed consent to participate in the protocol, which was approved by the research ethics board at each institution. Data from 297 participants were available at the time of analysis. The database was queried for participants between 3 months and 2 years poststroke at the time of assessment with both (a) a documented MAS score ranging from 0 to 4 of the upper limb (wrist or elbow) as measured by a physiotherapist and (b) an available axial, non-contrast CT or MRI scan. Though mixing the CT and MRI scans may contribute to variability in lesion volumes and locations depending on the imaging modality used, methods for normalizing brain images to templates based on mixed modalities (CT and MRI) have been established. 15 We believed it was important to include CT scans as they are readily available through routine clinical care. If an individual had differing spasticity scores at the elbow and wrist, the higher of the 2 scores was used. Subjects with a known stroke prior to the baseline stroke or transient ischemic attack were excluded. Subjects taking antispastic medication were also excluded so as to avoid biasing the MAS scores toward the lower end of severity. Available clinical history was assessed and subjects with confounding nonstroke pathologies or unusable scans were eliminated from the subject pool (see Results).
Scan Selection
Scan selection was based on scan timing, lesion visibility, scan sensitivity, and scan modality. Preference was given to scans taken closest to the assessment date, and MRI was preferred over CT if available. Within MR imaging, T1-weighted imaging was preferred to Fluid Attenuated Inversion Recovery (FLAIR) or T2-weighted imaging, which in turn was preferred over diffusion-weighted imaging.
Lesion Tracing
Lesions were manually traced, slice-by-slice, using an in-house modified version of ITK-SNAP22 called ITK-SNAP-SB. Lesion tracers had access to radiology reports, but were blind to clinical status and spasticity scores. Lesion core, perinecrotic tissue, lacunes, and contralateral lesions were included in the tracings, consistent with procedures previously used by our group. 12 Lacunar infarction was distinguished from enlarged Virchow–Robin spaces using criteria set out by Bokura and colleagues. 16 Tracings were reviewed and confirmed by an experienced research radiologist (FG).
Template Alignment
Skulls were digitally stripped away from each scan to normalize brains onto a common template. For CT scans, skull-stripping was accomplished with slice-by-slice semi-automated seeding and manual limit-setting within Analyze10 (Biomedical Imaging Resource, Mayo Clinic, Rochester, MN). For high-resolution T1-weighted scans, the automated algorithm Brain Extraction Tool 17 was used to remove the skull from the images. Manual editing of the resultant brain mask was then performed in ITK-SNAP-SB. For FLAIR and T2-weighted scans, skull-stripping was accomplished slice-by-slice using a manual outline tracing within Analyze10.
All brains were aligned using an affine transformation to the symmetric T1-weighted template brain available through the International Consortium for Brain Mapping in 2009. 18 This was accomplished by using Automated Image Registration 19 on the skull-stripped brains. The traced lesions were then transformed into template space. The resultant transformations were reviewed by the research radiologist (FG). Gaussian smoothing (1 mm radius) was performed on the lesions. Using MRIcro software (Rorden, Columbia, SC), region of interest (ROI) images were created for each lesion and flipped onto the right hemisphere. Images with similarly sized lesions in both hemispheres remained unflipped. Primary hemisphere (if any) of stroke was determined from radiologic reports.
Lesion Analysis
A linear sum of the binary tracings was calculated based on the lesion overlap at each voxel. This resulted in a lesion density map. The Talaraich coordinates acquired within MRIcro were exported to determine the specific brain structures associated with the lesion overlays, specifically the voxel with the most overlaps. A variant of voxel-based Lesion-Symptom Mapping 20 adapted for categorical lesion status and spasticity data using a combination of in-house lesion-mapping software and statistical analyses performed in version 3.1.0 of the R statistical computing environment (R Core Team, 2014) was used. Compiled across the template-space lesion masks of all subjects, the list of binary class labels (0 = intact, 1 = lesioned) at a given voxel coordinate formed a “patient–lesion pattern,” 21 dividing subjects into 2 groups with respect to the presence or absence of a lesion in the same approximate anatomical location. Because discretely labeled lesions (“1s”) form contiguous regions within each patient, the spatial nonindependence of voxel-wise lesion status is also reflected in the tendency of neighboring voxels to share patient–lesion patterns in the aggregate data. After identifying all unique patient–lesion patterns in template space, R was used to perform Fisher’s exact test on contingency tables combining each of the corresponding distinct groupings of observations with binarized spasticity scores (0 = MAS = 0, 1 = MAS ≥ 1). All voxels with a lesion in at least 20% of all subjects, spastic or nonspastic, were included in the analysis. This threshold was chosen to achieve a minimum detectable effect size in accordance with the prevalence of spasticity at varying time points of recovery (1 day to 6 months) reported to range between 19% and 27%.22,23 A statistical map of P values was generated by assigning the result from each patient–lesion partitioning of the data to all corresponding voxels. The final maps were filtered using a P value threshold, Bonferroni-corrected with respect to the total number of unique patient–lesion patterns in the data set. 21 Using SPSS (IBM SPSS Statistics 21), Pearson’s χ2 was used to determine whether the spastic and nonspastic groups differed in the type of stroke causing the lesion (ischemic or hemorrhagic) or in the imaging modality used to characterize the lesion (CT or MR).
Results
Patient Demographic and Clinical Characteristics
In total, 102 subjects met the initial inclusion criteria. Following initial examination of available brain scans, 5 subjects were excluded—3 because the available brain imaging showed insufficient evidence of stroke and 1 due to severe herpesviral encephalitis. The other subject was excluded because the scans had large portions of skull missing due to a decompressive craniectomy.
Ninety-seven subjects (57 male; 46 with MAS of 0, 51 with MAS of 1, 1+, 2, 3, or 4) were included in the analysis (Table 1). Overall, the average age of participants included in the analysis was 67.5 ± 13.3 years. The median time between date of stroke and date of scan (64 CT, 5 T1, 10 T2, 18 FLAIR) for all participants was 4 days (range = 0-608), and the median time between date of stroke and assessment date was 187 days (range = 122-627). The median National Institutes of Health Stroke Scale total score for all participants was 3 (range = 0-12), and the median Chedoke-McMaster Stroke Assessment arm and hand score was 4 (range = 1-7) and 5 (range = 1-7), respectively. The majority of participants experienced ischemic stroke (11 cases of lacunar stroke) and 19 had primary hemorrhagic stroke. Neither the type of lesion (ischemic or hemorrhagic) nor the type of imaging (CT or MR) was significantly associated with the presence of spasticity, χ2(1) = 1.83, P = .176, and χ2(1) = 0.37, P = .544, respectively. Demographic data were comparable between the spastic and nonspastic groups. Overall, the spastic and nonspastic groups differed in clinical presentation. Individuals with spasticity were characterized as having more severe strokes and greater impairment in the hand and arm. Clinical scores are presented in Table 1.
Demographic and Clinical Data of Stroke Patients Based on Modified Ashworth Score of the Upper Limb a .
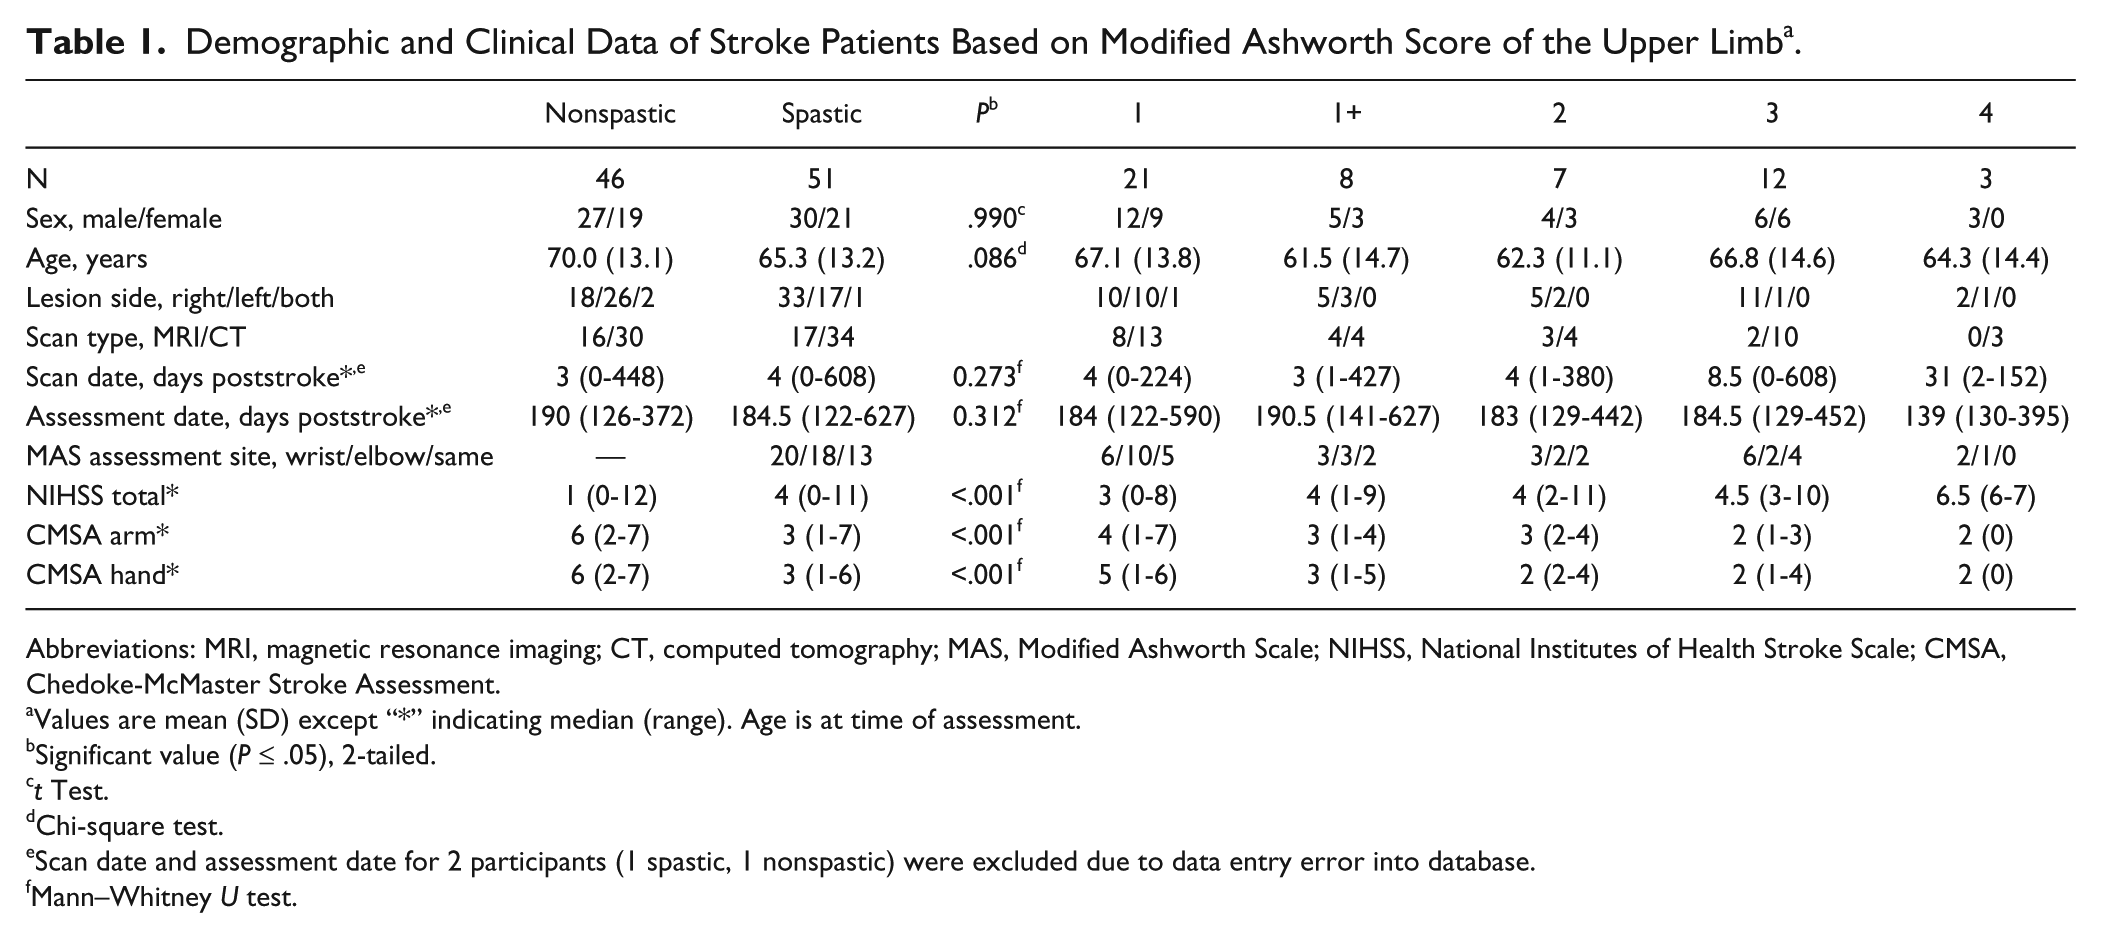
Abbreviations: MRI, magnetic resonance imaging; CT, computed tomography; MAS, Modified Ashworth Scale; NIHSS, National Institutes of Health Stroke Scale; CMSA, Chedoke-McMaster Stroke Assessment.
Values are mean (SD) except “*” indicating median (range). Age is at time of assessment.
Significant value (P ≤ .05), 2-tailed.
t Test.
Chi-square test.
Scan date and assessment date for 2 participants (1 spastic, 1 nonspastic) were excluded due to data entry error into database.
Mann–Whitney U test.
Lesion Analysis: Differences Between the Spasticity and No Spasticity Groups
When the brain lesion overlays of nonspastic group were subtracted from the spastic participant group, the resulting lesion map revealed the basal ganglia to be the brain region with the most overlaps. Following Fisher’s exact test of each individual subdivision, the resulting P values were plotted using MRIcro, and the basal ganglia—more specifically, the putamen—was confirmed as the area of peak interest (region surrounding Talairach x, y, z = −26, −4, 12; Figure 1). Among the significant voxels illustrated in Figure 1, 39% (20/51) of individuals with spasticity had a lesion that overlapped at least one of these voxels compared to 21% (10/46) among individuals without spasticity. Table 2 reports the P values and Talairach coordinates for the image slices presented in Figure 1.
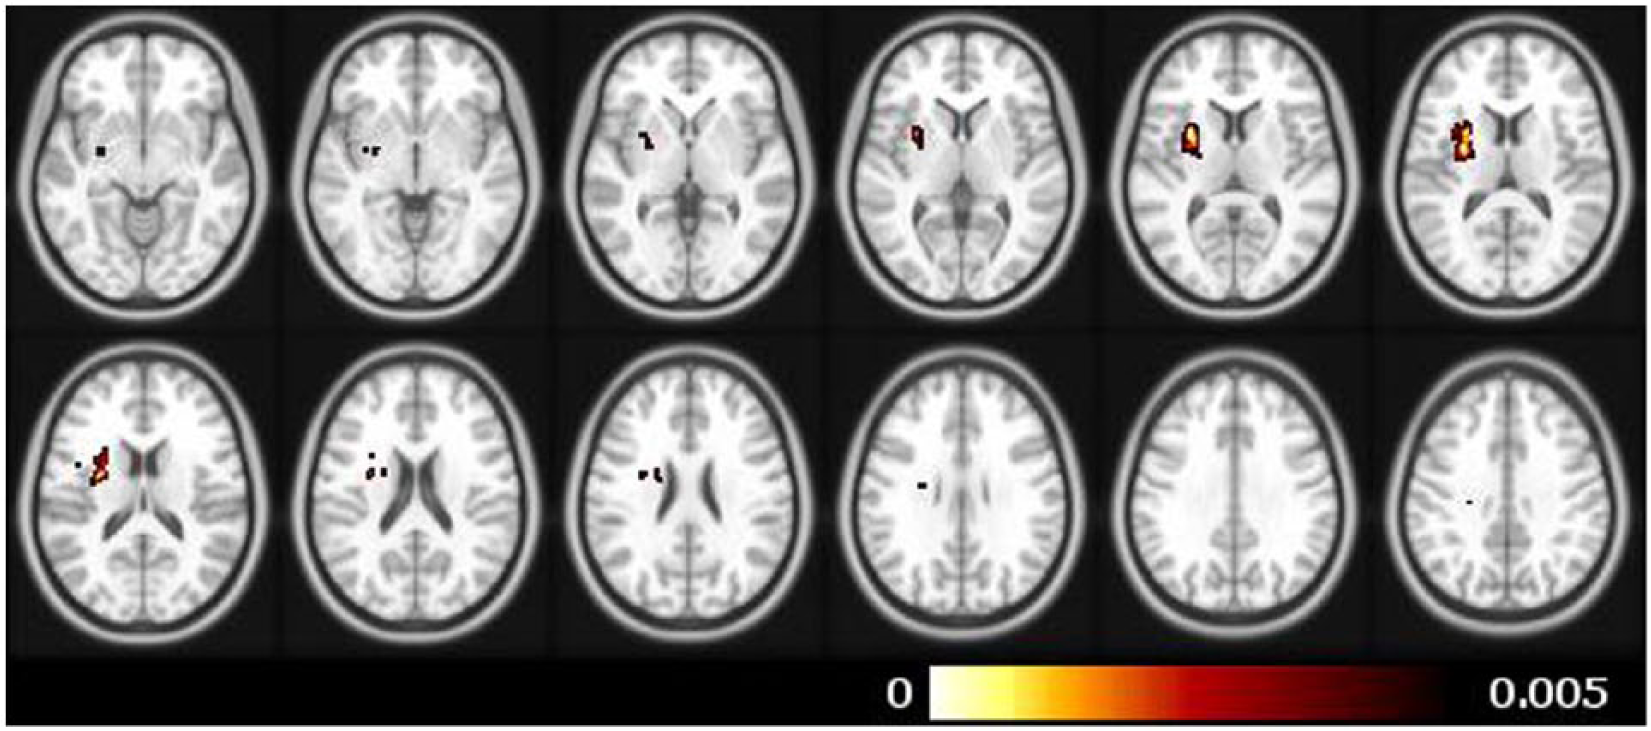
Contrast maps showing the difference in lesion location when overlays of individuals without spasticity were subtracted from overlays of individuals with spasticity. Colored regions represent voxels with a P value of ≤.005 following Fisher’s exact test.
Slice-by-Slice Comparison of Voxels With Lowest P Value a .
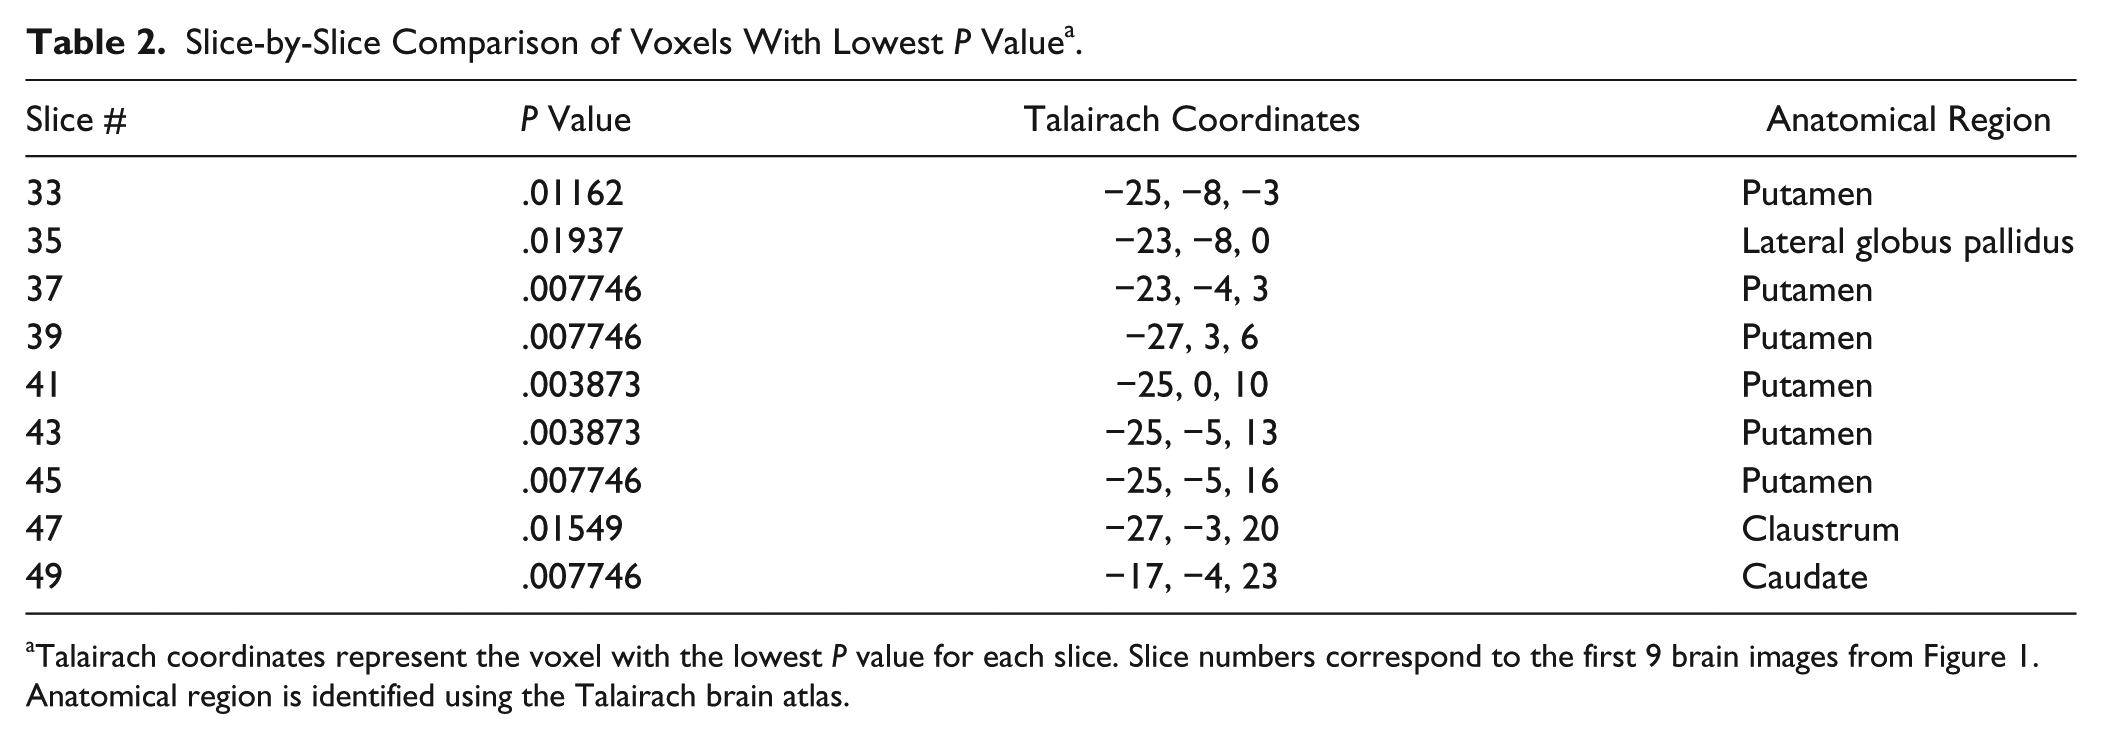
Talairach coordinates represent the voxel with the lowest P value for each slice. Slice numbers correspond to the first 9 brain images from Figure 1. Anatomical region is identified using the Talairach brain atlas.
Lesions Analysis: Differences Across Levels of the Modified Ashworth Scale
Participants with spasticity were separated into groups according to MAS score (Table 1). To obtain equivalent number of samples across groups, the minimum number of participants within a level of MAS was set to 7 (ie, the number of participants with MAS = 2). Thus, the 3 participants with MAS = 4 were excluded from this part of the analysis. In groups represented by more than 7 individuals (ie, MAS = 1, 1+, 3), 7 scans were randomly selected for comparison. In total, analysis of lesion location across spasticity levels was performed on 28 participants. Lesions from each group were overlaid to produce a lesion density map for each level of spasticity. This analysis revealed that at each level of spasticity, the greatest density of lesions was located in the region that included the putamen, internal (posterior limb) and external capsule, thalamus, and insula (Figure 2).
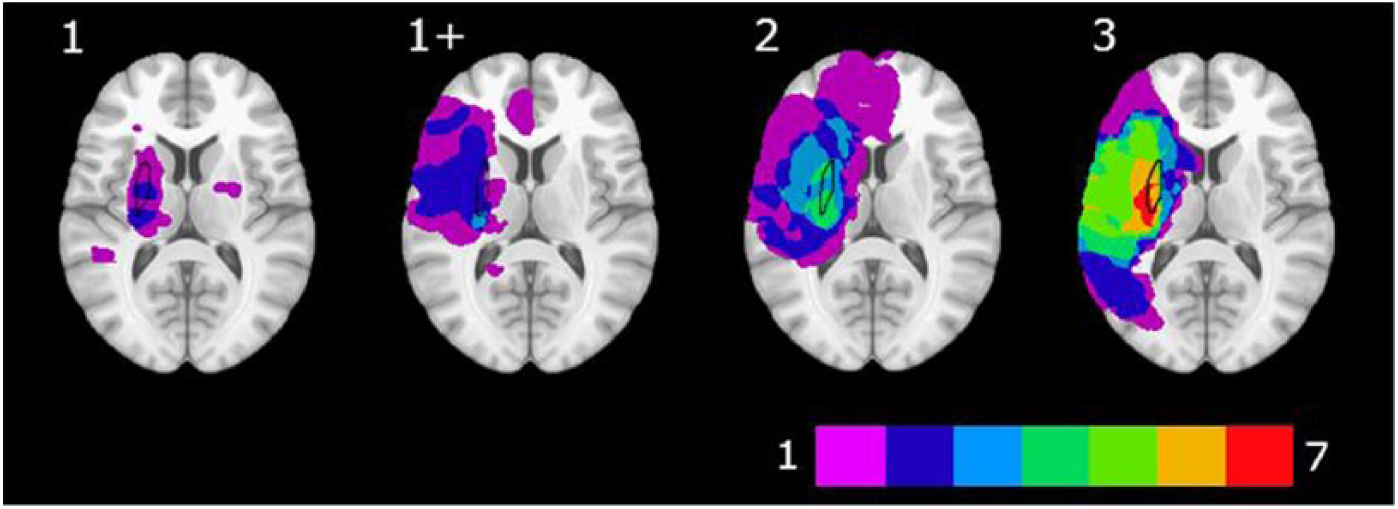
Lesion overlay maps across varying levels of Modified Ashworth Scale (MAS) score (n = 7 per level). The color bar represents the number of lesions that overlap a given area. Purple indicates a single lesion; red indicates the region where all 7 scans included in the analysis overlapped. The putamen is outlined in black.
Lesion volume was measured for all participants with MAS > 0 (n = 51). Spearman’s rank correlation revealed a statistically significant positive correlation between lesion volume and MAS score (ρ = 0.49, P < .01). Figure 3 depicts the relationship between lesion volume and MAS score.
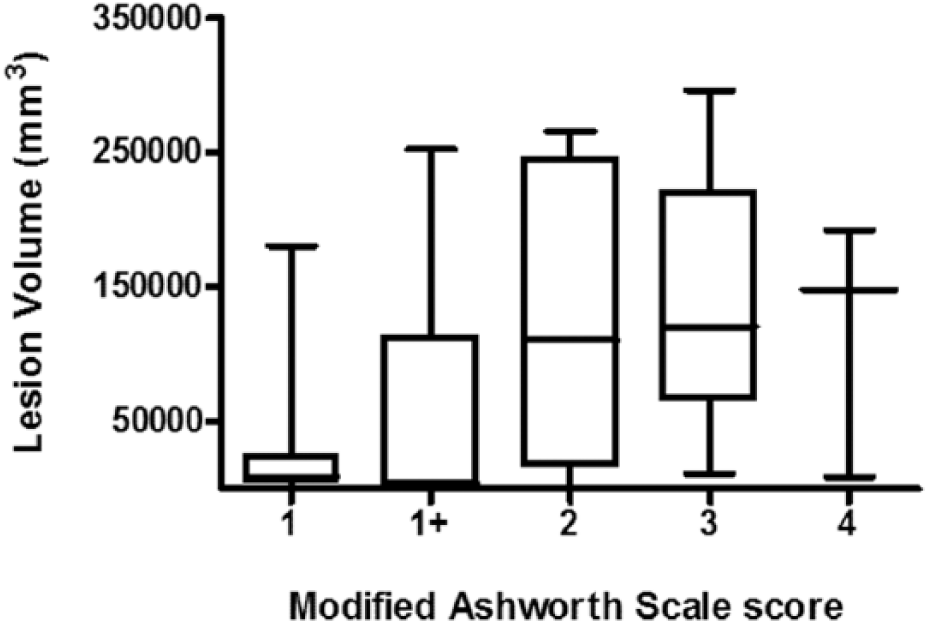
Box-and-whisker plot depicting the relationship between lesion volume and severity of spasticity. More severe spasticity is associated with larger lesion volume.
Discussion
The purpose of this study was to identify the neuroanatomical correlates of poststroke spasticity and to determine the relationship between lesion characteristics (ie, lesion location and lesion size) and the severity of spasticity. In comparing the extent of lesion overlap in stroke survivors with and without spasticity, the putamen was identified as a region that differentiated these groups. Identification of lesion location based on spasticity severity again revealed a greater density of lesions in a region that included the putamen as well as the internal (posterior limb) and external capsule, thalamus, and insula. In addition, lesion volume was positively correlated with the severity of spasticity.
Involvement of the putamen should not be unexpected as it is within the watershed region of the middle cerebral artery (lenticulostriate branches). 24 However, the contrast analysis employed in the current study distinguished between individuals who had experienced a stroke and had developed spasticity with those stroke survivors without spasticity. This distinction importantly implicates the putamen as a “spasticity” area, not just a common stroke location. This finding leads to the obvious question: Is it surprising that the putamen was identified as the site most tightly associated with spasticity in this study? The putamen receives all of the striatal inputs from the primary sensory and motor cortices and the majority of inputs from the premotor cortex.25,26 Structural integrity of these extrapyramidal tracts has been identified as a critical determinant of poststroke spasticity. 27
Empirical evidence for a direct relationship between spasticity and lesions involving the putamen is sparse. Nicolai and Lazzarino presented a case study of an individual patient who developed tonic spasms following contralateral ischemic brain lesion lateral putamen, as well as the external capsule and subcortical white matter of the posterior insular area. 28 In addition, in their study examining noninvasive brain stimulation on muscle activation, Bradnam and colleagues 29 identified an individual with MAS = 4 and a lesion involving the putamen (the only individual with this score and this lesion location). However, it is possible that the impact of the location of this lesion on the development of spasticity occurs through less direct routes. Spasticity is thought to develop from disinhibition of spinal circuitry stemming from a disruption of cortical inputs to the reticular formation. 27 An alternate view is that spasticity results from maladaptive neuroplasticity 30 or a combination of these processes. Thus, if one considers the evidence demonstrating cortical reorganization following striatocapsular infarction, 31 the potential for the observed neuroplastic changes to contribute to the development of spasticity should not be discounted.
The putamen is somatotopically organized. Using functional MRI in humans, Scholz and colleagues 32 demonstrated the presence of distinct “hand” and “foot” areas that were located ventrally and dorsally, respectively. This distinction is similar to what has been reported in animal studies using single cell recordings.33,34 These studies also demonstrated directional specificity in activity of putamen neurons 33 and movement generated by microstimulation of neurons in the putamen. 35 Interestingly, Crutcher and DeLong 34 identified neurons in the structure that were preferentially activated to either passive or active movements of different joints of the upper limb. In humans, these movements evoke hallmark characteristics of spasticity (ie, stretch sensitivity, spastic co-contraction). 36 These observations identify additional potential links between the putamen and spasticity after stroke.
Stroke lesion volume is a predictor of behavioral outcomes; 37 however, stroke lesion location must also be considered.11,38 The present study identified individuals who were at the higher range of severity of spasticity with lesions that were at the low end of the distribution for overall volume. This study also demonstrated a moderate association between lesion volume and the severity of one specific type of impairment (ie, spasticity), consistent with previous reports. 39 We speculate that the discriminative capacity demonstrated in the present study (ie, the ability to contrast both the presence and severity of spasticity) can be attributed to the voxel-based lesion symptom mapping method used in the analysis. This technique has been used to identify anatomical regions contributing to functional deficits in both the upper 40 and lower 12 limbs.
It must be acknowledged that lesions in brain regions other than the putamen were identified as being associated with spasticity. Indeed, 7/7 scans of individuals with severe spasticity (MAS = 3; Figure 2) demonstrated overlap in a region that broadly included the putamen, external capsule, internal capsule (posterior limb), and insula. These findings are consistent with the case report by Nicolai and Lazzarino. 28 Involvement of the internal capsule is not surprising given the association between lesions occupying posterior regions of the internal capsule with severity of motor impairment 41 or recovery of isolated upper limb movement. 42 In addition, injuries involving both the posterior aspect of the internal capsule and dorsolateral thalamus are also associated with poor recovery. 43 This evidence corroborates an anatomical region that includes fibers that are conduits for connectivity between the cortex and thalamic or pontine nuclei, as well as structures whose integrity is necessary for intact motor control.
The present study corroborates the recent findings of Picelli and colleagues, 6 who reported an association between upper limb spasticity and lesions involving subcortical structures including the insula, thalamus, basal ganglia, and white matter tracts. Importantly, our report includes an analysis of lesions from individuals across the spectrum of severity of spasticity (MAS = 0 to 3) with comparable periods of time between scan (approximately 4 days) and assessment (approximately 6 months). In addition, the present study also includes individuals with hemorrhagic strokes (in addition to ischemic) and includes CT scans, with neither factor being biased toward the presence or absence of spasticity. Thus, we demonstrate the relationship between stroke lesion characteristics and spasticity using information and techniques already part of routine clinical care.
Footnotes
Acknowledgements
The authors wish to thank Valerie Closson, Cynthia Danells, and William McIlroy for assistance and access to the Heart and Stroke Foundation Canadian Partnership for Stroke Recovery Rehabilitation Affiliates Database. The authors also wish to thank James Chen and Jessica Chin for assistance with data analysis.
Declaration of Conflicting Interests
The author(s) declared no potential conflicts of interest with respect to the research, authorship, and/or publication of this article.
Funding
The author(s) disclosed receipt of the following financial support for the research, authorship, and/or publication of this article: We acknowledge funding from the Heart and Stroke Foundation Canadian Partnership for Stroke Recovery.