
Abstract
Background. In a brain–computer interface for stroke rehabilitation, motor imagery is a preferred means for providing a gateway to an effector action or behavior. However, stroke patients often exhibit failure to comply with motor imagery, and therefore their motor imagery performance is highly variable. Objective. We sought to identify motor cortical areas responsible for motor imagery performance in stroke patients, specifically by using a multivariate pattern analysis of functional magnetic resonance imaging data. Methods. We adopted an imaginary finger tapping task in which motor imagery performance could be monitored for 12 chronic stroke patients with subcortical infarcts and 12 age- and sex-matched healthy controls. We identified the typical activation pattern elicited for motor imagery in healthy controls, as computed over the voxels within each searchlight in the motor cortex. Then we measured the similarity of each individual’s activation pattern to the typical activation pattern. Results. In terms of activation levels, the stroke patients showed no activation in the ipsilesional primary motor cortex (M1); in terms of activation patterns, they showed lower similarity to the typical activation pattern in the area than the healthy controls. Furthermore, the stroke patients were better able to perform motor imagery if their activation patterns in the bilateral supplementary motor areas and ipsilesional M1 were close to the typical activation pattern. Conclusions. These findings suggest functional roles of the motor cortical areas for compliance with motor imagery in stroke, which can be applied to the implementation of motor imagery–based brain–computer interface for stroke rehabilitation.
Introduction
Motor imagery, as the mental rehearsal of movement, engages parts of the executive motor system. 1 Mental practice with motor imagery has been suggested as a therapeutic tool in the rehabilitation of patients with motor impairments, and this tool has generally exhibited encouraging effects on motor function. 2 For rehabilitative interventions that are applicable even for patients without residual motor functions, 3 motor imagery has received increasing attention in connection with a brain–computer interface (BCI) that can be used to either restore movement or control external devices such as robotic arms. 4 A motor imagery–based BCI is operated by recording and decoding motor imagery–induced neurophysiological signals especially from noninvasive brain imaging such as electroencephalography (EEG),5,6 magnetoencephalography,3,7 near-infrared spectroscopy (NIRS),8,9 or functional magnetic resonance imaging (fMRI).10,11
In a motor imagery–based BCI, one of the primary challenges has been to precisely distinguish the motor imagery state from other states, such as the idling state, through applying feature extraction to the signals from the brain. For classification of the motor imagery state, the monitoring of each subject’s motor imagery performance could provide useful information on when reliable signals are obtained. Thus, we aimed to find motor cortical areas responsible for motor imagery performance in stroke patients, who as a group commonly exhibit a high degree of interindividual variance in the performance of motor imagery as well as motor execution. We used (a) an imaginary finger tapping task in which the motor imagery performance of individual subjects could be monitored and (b) a multivariate pattern analysis of fMRI data acquired during the task. We found an association between motor imagery performance and motor cortical activation patterns.
The functional properties of brain areas can be assessed by decoding brain activation onto experimental conditions related to mental representations. Unlike the conventional univariate analysis of fMRI data that focuses on individual voxels, a multivariate pattern analysis deals with the distributed pattern of activation for inferring the functional properties of brain areas. 12 Individual voxels might not be significantly activated under any of experimental conditions applied, but the multivariate pattern analysis exploits the information from multiple voxels within a brain area, such as the covariance across neighboring voxels, thus allowing greater sensitivity in the detection of differences between the experimental conditions than is possible with the univariate analysis.
We specifically used the multivariate pattern analysis based on a neural typicality measure, which was originally introduced to determine category members eliciting activation patterns most similar to those for other category members in a categorization task. 13 As the neural typicality measure can answer to how neural representations are distinguished between different stimuli for the same subject, 13 we supposed that this measure can also be applied to examine how neural representations are discriminated for the same stimulus between 2 subjects specifically with and without functional impairments.
We determined the typical activation pattern of healthy subjects by using the neural typicality measure to indicate the characteristic neural representations of a healthy state. In using this approach, we assumed that the typical activation pattern was not just an average of activation patterns among the healthy subjects but the activation pattern of an individual, which was found to be most similar among the healthy subjects. We next assessed how the activation patterns of stroke patients were dissimilar from the typical activation pattern in a neural space. We hypothesized that the degrees of similarity between the stroke patients’ activation patterns to the typical activation pattern could be related to their degrees of motor imagery performance.
Methods
Subjects
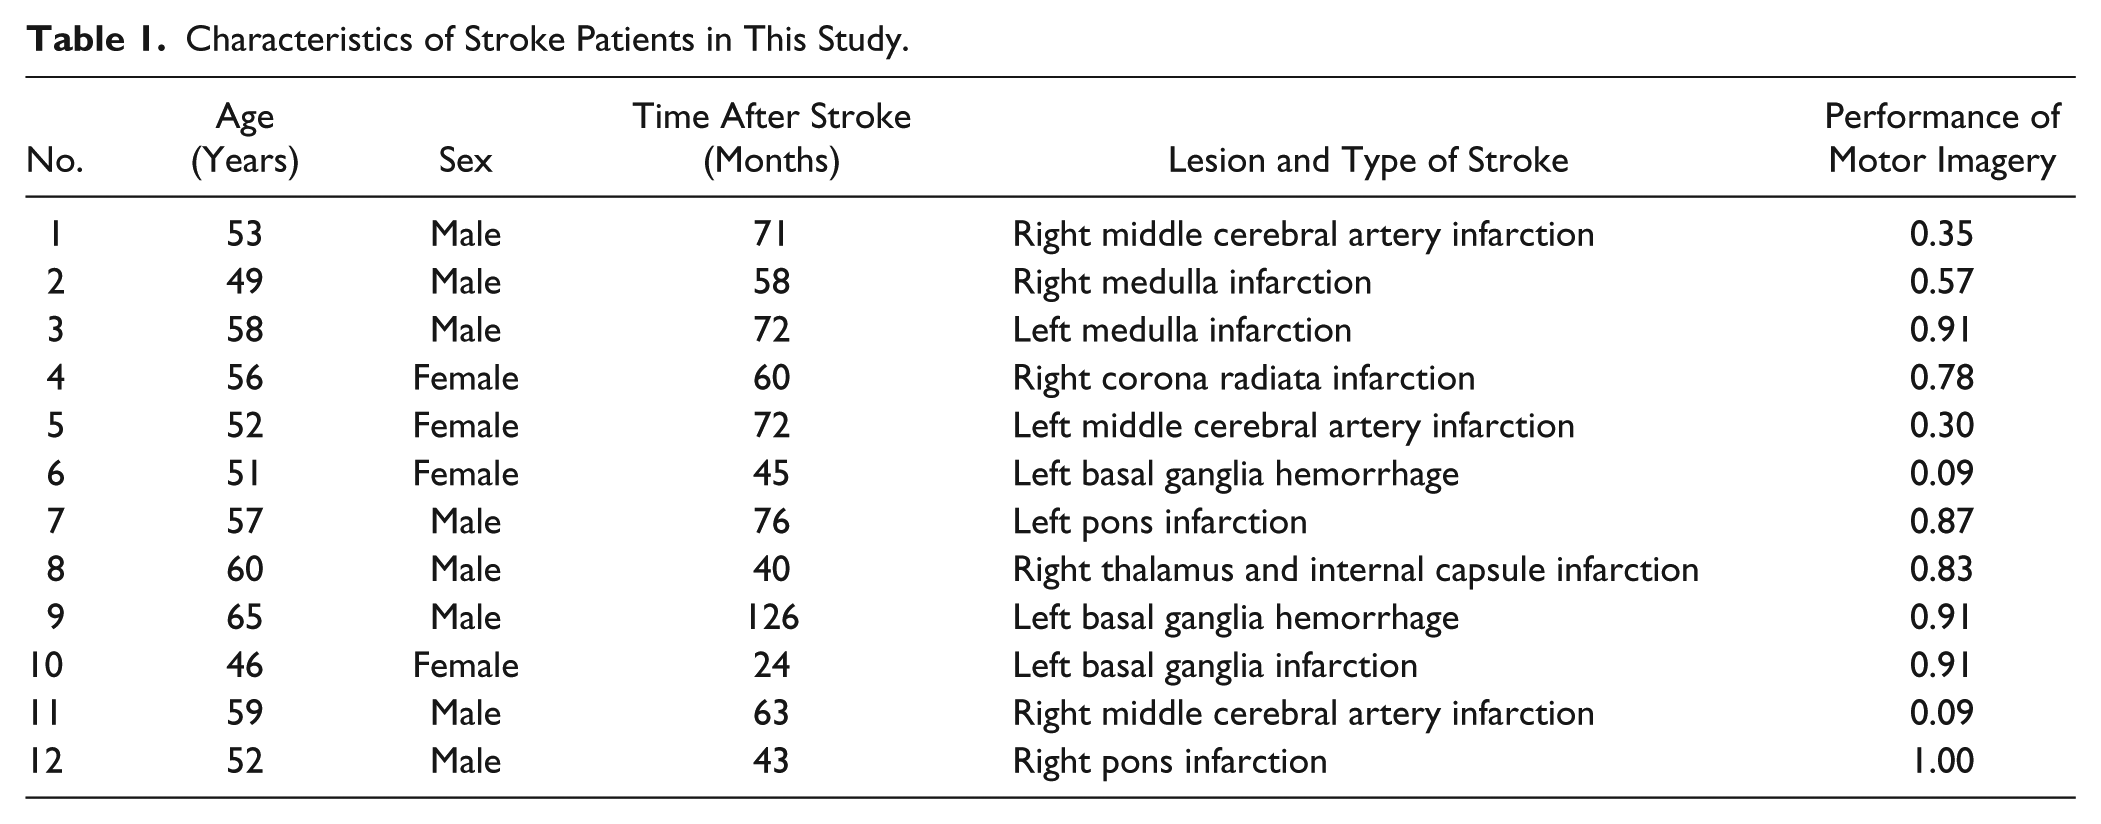
Twelve stroke patients (4 females; 54.8 ± 5.3 years) participated in this study. The inclusion criteria were the following: patients (a) with subcortical lesions of first-ever ischemic or hemorrhagic stroke (b) at the chronic phase more than 3 months after onset and (c) aged between 18 and 70 years. Characteristics of these patients are provided in Table 1. Twelve age- and sex-matched healthy subjects (4 females; 54.8 ± 2.2 years) served as controls. Written informed consent was obtained from all participants, and the study protocol was approved by the local ethics committee at Samsung Medical Center, Seoul, Korea.
Characteristics of Stroke Patients in This Study.
Motor Imagery Experiment
The motor imagery ability of all participants was measured by the Movement Imagery Questionnaire–Revised Second version (MIQ-RS), 14 which is composed of visual and kinesthetic subscales, each represented by 7 items on a 7-point scale. The total scores on the MIQ-RS were 12.86 ± 2.00 for the healthy controls and 11.57 ± 1.52 for the stroke patients. The scores on the kinesthetic MIQ-RS were 6.47 ± 0.96 for the healthy controls and 5.87 ± 0.71 for the stroke patients.
In fMRI, an imaginary finger tapping task was carried out using the nondominant (left) hand in the healthy controls and using the affected hand in the stroke subjects. The subjects were asked to imagine the feeling of performing finger tapping, that is, to perform kinesthetic motor imagery in the task. The experiment was designed to achieve a monitoring of motor imagery for objectively assessing the performance of the task. A motor imagery experiment that can provide evidence of task compliance by individual subjects was previously suggested as visually presenting numbers to guide sequential finger tapping imagery. 15 We modified 2 aspects of this experimental design to use (a) dot stimuli instead of number stimuli to guide the sequence and (b) a varied number of dot stimuli instead of a fixed quantity of number stimuli in each block. We inferred that these modifications could deter subjects from using alternative strategies such as explicit counting when performing the task.
Each subject’s fMRI run consisted of 23 time-varied task blocks (11.2-17.2 seconds) alternating with 23 time-varied fixation blocks (3.0-7.0 seconds). In each task block, the cue stimulus that specified the starting finger for imaginary tapping was presented for 3.0 seconds, and then a series of 3 to 7 dot stimuli were presented with 1.5-second intervals. In response to each dot stimulus, the subjects were asked to imagine tapping each finger, except the thumb, according to a predetermined tapping sequence from the radial to ulnar side (eg, when starting from the index finger, the sequence would be as follows: index → middle → ring → little → index → middle → . . . ). At the end of the block, the subjects were asked to actually tap the next finger in the sequence. Figure 1 displays this procedure as it was performed in a task block.
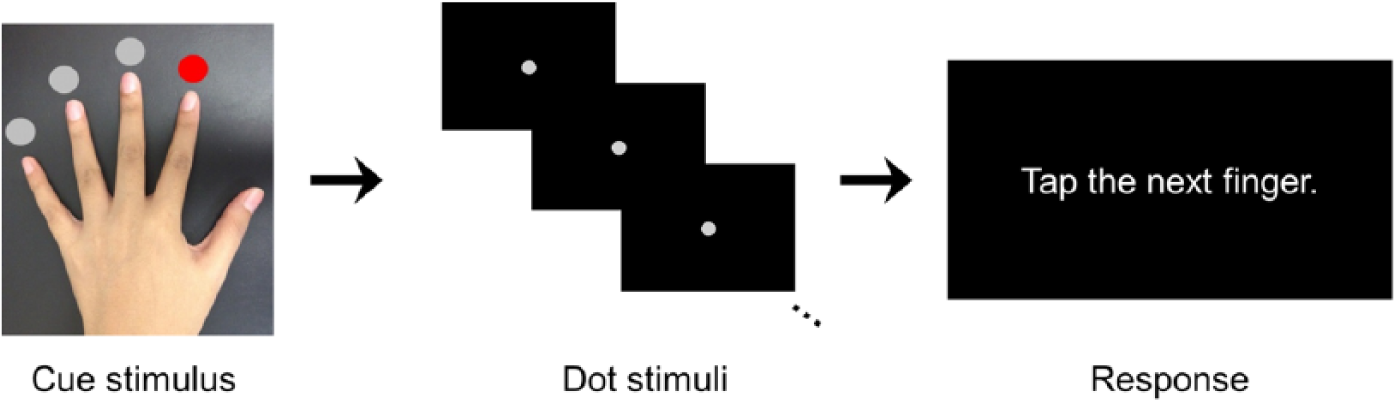
The procedure of a task block in an imaginary finger tapping task.
At the assessment stage of each task block, an actual tapping with the correct finger in the sequence was supposed to reflect the subjects’ compliance with motor imagery in the task block. The performance of motor imagery during the whole experiment was measured as the ratio of the number of correct finger tapping responses among 23 task blocks. As faithful performance of motor imagery was very critical in this experimental design, the subjects were practiced outside the scanner before the task and also instructed to avoid responding by guessing which of their fingers was the next in the sequence during the assessment stage of each task block.
fMRI Data Acquisition
Functional magnetic resonance images were acquired as T2*-weighted echo planar images using a Philips ACHIEVA scanner (Philips Medical Systems, Best, The Netherlands) operating at 3 Tesla. For each subject, a total of 150 whole brain images were collected with blood-oxygen-level-dependent contrast (repetition time = 3000 ms, echo time = 35 ms, number of slices = 35, slice thickness = 4 mm, matrix size = 112 × 112, in-plane resolution = 1.96 mm × 1.96 mm). A structural image was also acquired as a T1-weighted image for coregistration to the functional images for each subject (number of slices = 124, slice thickness = 1.6 mm, matrix size = 512 × 512, in-plane resolution = 0.47 mm × 0.47 mm).
fMRI Data Analysis: Univariate Analysis
The preprocessing and statistical univariate analysis of the functional images were performed using SPM8 (http://www.fil.ion.ucl.ac.uk/spm/). Preprocessing steps included spatial realignment of a series of volumes, normalization into the same coordinate frame as the MNI template brain (with transformation parameters derived from segmentation of the T1-weighted high-resolution image coregistered to the mean functional image), and smoothing (using a Gaussian filter of 8 mm FWHM).
We carried out both univariate and multivariate pattern analyses on the same voxels in the motor cortex, the territories of which were determined from the Harvard-Oxford Atlas in the standard space, and then adjusted through close inspection to include only voxels that met every subject’s anatomical landmarks. We focused on the motor cortex, as this is the main component of the motor system and its signals are usually of interest in a motor imagery-based BCI.
In the univariate analysis, we modeled the (a) cue stimuli, (b) motor imagery trials, and (c) responses as separate columns in a design matrix, together with 6 parameters representing head movements. Voxel-wise parameter estimates (β values) were acquired for the general linear model with the design matrix. For the stroke patients with lesions on the left side, the statistical parametric map (composed of the parameter estimates) was flipped from left to right about the mid-sagittal line, so that the lesions of all stroke patients were located on the right side of the map. The voxel-wise levels of activation elicited for motor imagery in each group were displayed by thresholding a statistical parametric map of t values (calculated from a one-sample t test of the parameter estimates) at an extent threshold of a P value of .05 family-wise error corrected for multiple comparisons with a cluster forming threshold (height threshold) of a P value of .001.
fMRI Data Analysis: Multivariate Pattern Analysis
For each subject, the pattern of activation elicited for motor imagery was extracted from a series of β values, which were determined as the parameter estimates for motor imagery trials in the univariate analysis, over the voxels within each searchlight in the motor cortex.
Following the searchlight algorithm 16 and its adoption for the neural typicality measure, 13 we set the searchlight as being a sphere with a 3-voxel radius centered on each voxel. For the same spatial location of each searchlight, activation patterns were compared between subjects to yield the similarity between their neural representations 13 as follows:
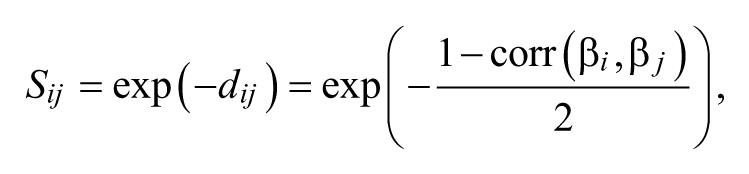
where β i and β j are activation patterns from subjects i and j, respectively, and dij is the distance between their activation patterns. The sum of similarity between each subject’s activation pattern and those of all members in a group of n subjects furnished the neural typicality of a subject i’s activation pattern as follows:
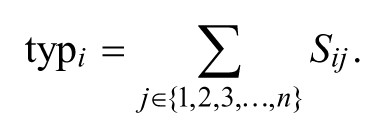
A subject’s activation pattern with the highest neural typicality was selected as the typical activation pattern for the group, and this was considered to be the activation pattern most similar, on average, to the other subjects’ activation patterns (Figure S1 in Supplementary Material).
Through this process, we found the typical activation pattern of the healthy controls, and then measured the similarity of each healthy control and each stroke patient’s activation pattern to the typical activation pattern. This neural similarity was then compared between the 2 groups by using a two-sample t test, and the resulting t value was assigned to a voxel on which the searchlight was centered. The statistical parametric map of t values was thresholded to infer differences in neural similarity between the 2 groups. Statistical significance was set at a P value of .05 false discovery rate corrected for multiple comparisons.
Furthermore, the similarity of the stroke patients’ activation patterns to the typical activation pattern was correlated with their performance in motor imagery. For this step, we used a Spearman’s rank correlation, as the motor imagery performance values had a nonnormal distribution. The resulting correlation coefficients assembled a statistical parametric map, which was thresholded to infer correlations of neural similarity with motor imagery performance in the stroke patients. Statistical significance was set at a P value of .05 false discovery rate corrected for multiple comparisons.
Results
Performance of Motor Imagery
At the significance level of a P value of .05, the stroke patients exhibited motor imagery ability comparable to that of the healthy controls in terms of the total MIQ-RS score (t = 1.0374, P = .1554) and specifically the kinesthetic MIQ-RS score (t = 1.0326, P = .1565). However, the performance of motor imagery (measured as the ratio of the number of correct responses) was 0.88 ± 0.17 for the healthy controls and 0.63 ± 0.34 for the stroke patients, exhibiting the stroke patients’ poorer performance in motor imagery compared to that of the healthy controls (t = 2.1797, P = .0408).
Cortical Activation During Motor Imagery
As indicated by the univariate analysis, Figure 2 displays the levels of activation over the motor cortical voxels during motor imagery in the healthy controls and stroke patients. The healthy controls showed activation over the bilateral supplementary motor areas (SMAs) and premotor cortices (PMs) and contralateral primary motor cortex (M1; Figure 2A). The stroke patients were still able to recruit the bilateral SMAs and ipsilateral (contralesional) PM, but failed to recruit the contralateral (ipsilesional) motor cortical areas (Figure 2B).
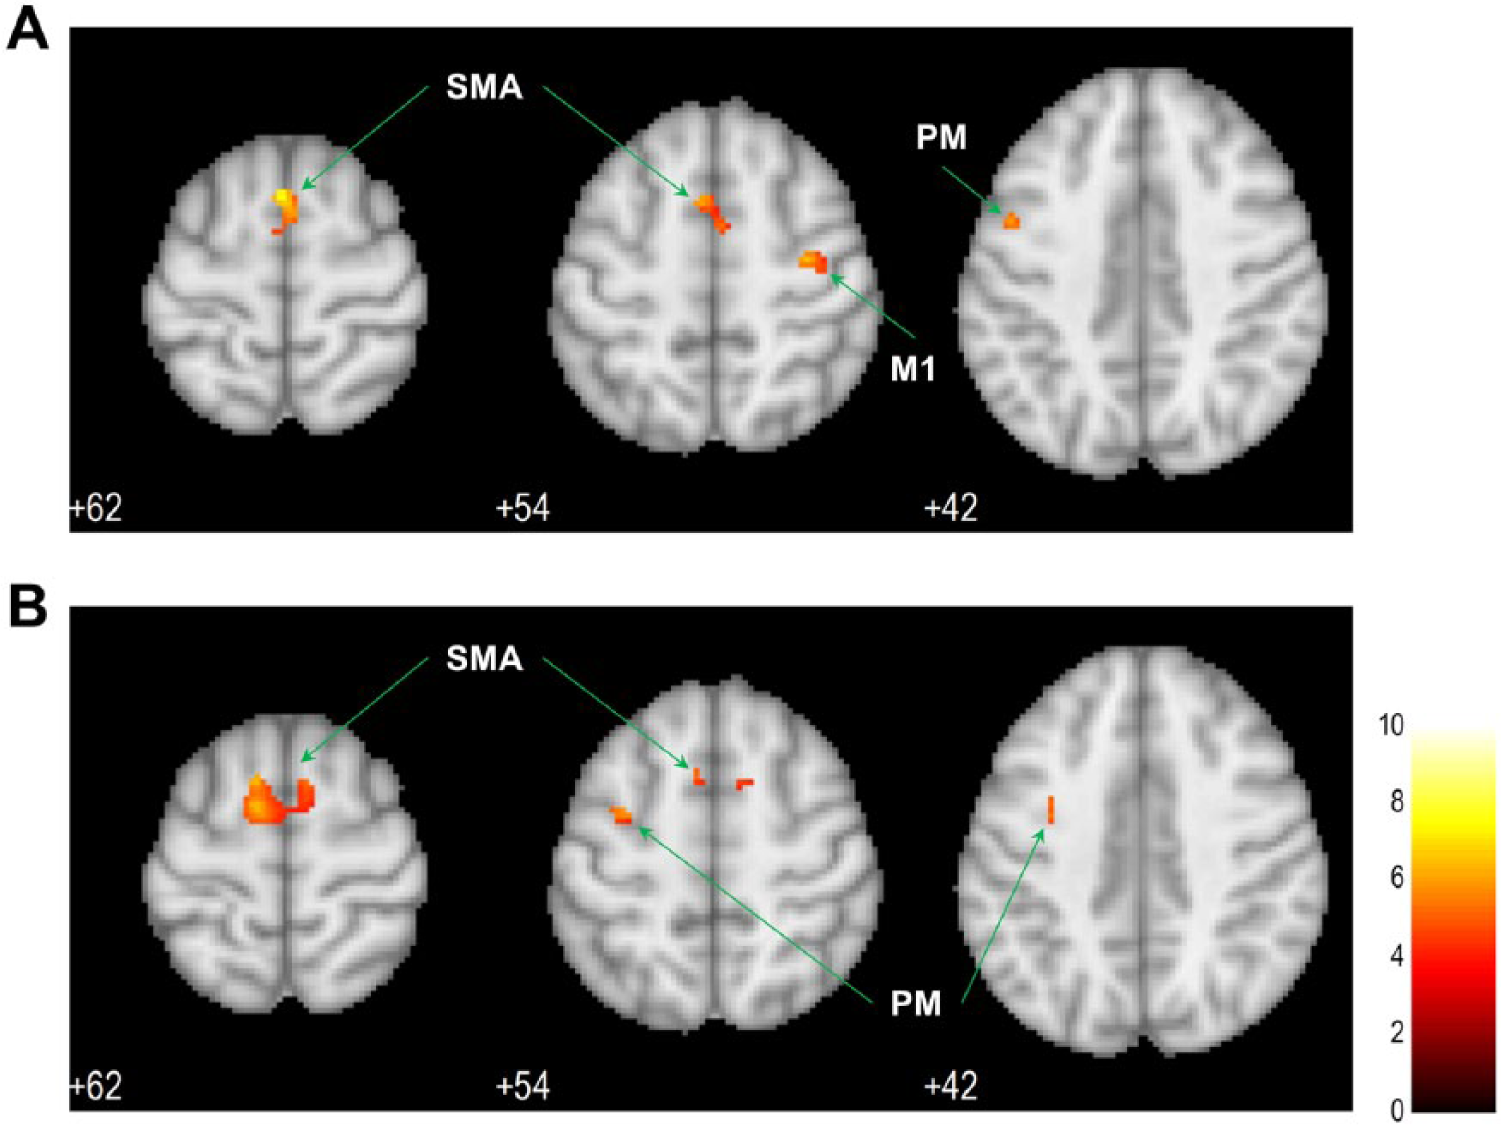
The levels of activation over the motor cortex during motor imagery: (A) activation in healthy controls; (B) activation in stroke patients.
Group Difference in Activation Patterns
The differences in the similarity of individual activation patterns to the typical activation pattern between the healthy controls and stroke patients were seen in the ipsilesional M1 (Broadmann area 4, peak MNI coordinates: x = 38, y = −12, z = 42; Figure 3A). Across all the voxels of group differences, the activation patterns of the stroke patients had lower similarity to the typical activation pattern than those of the healthy controls. The plot in Figure 3A displays the comparison of neural similarity in the voxel of the ipsilesional M1 in which the group difference was maximal.
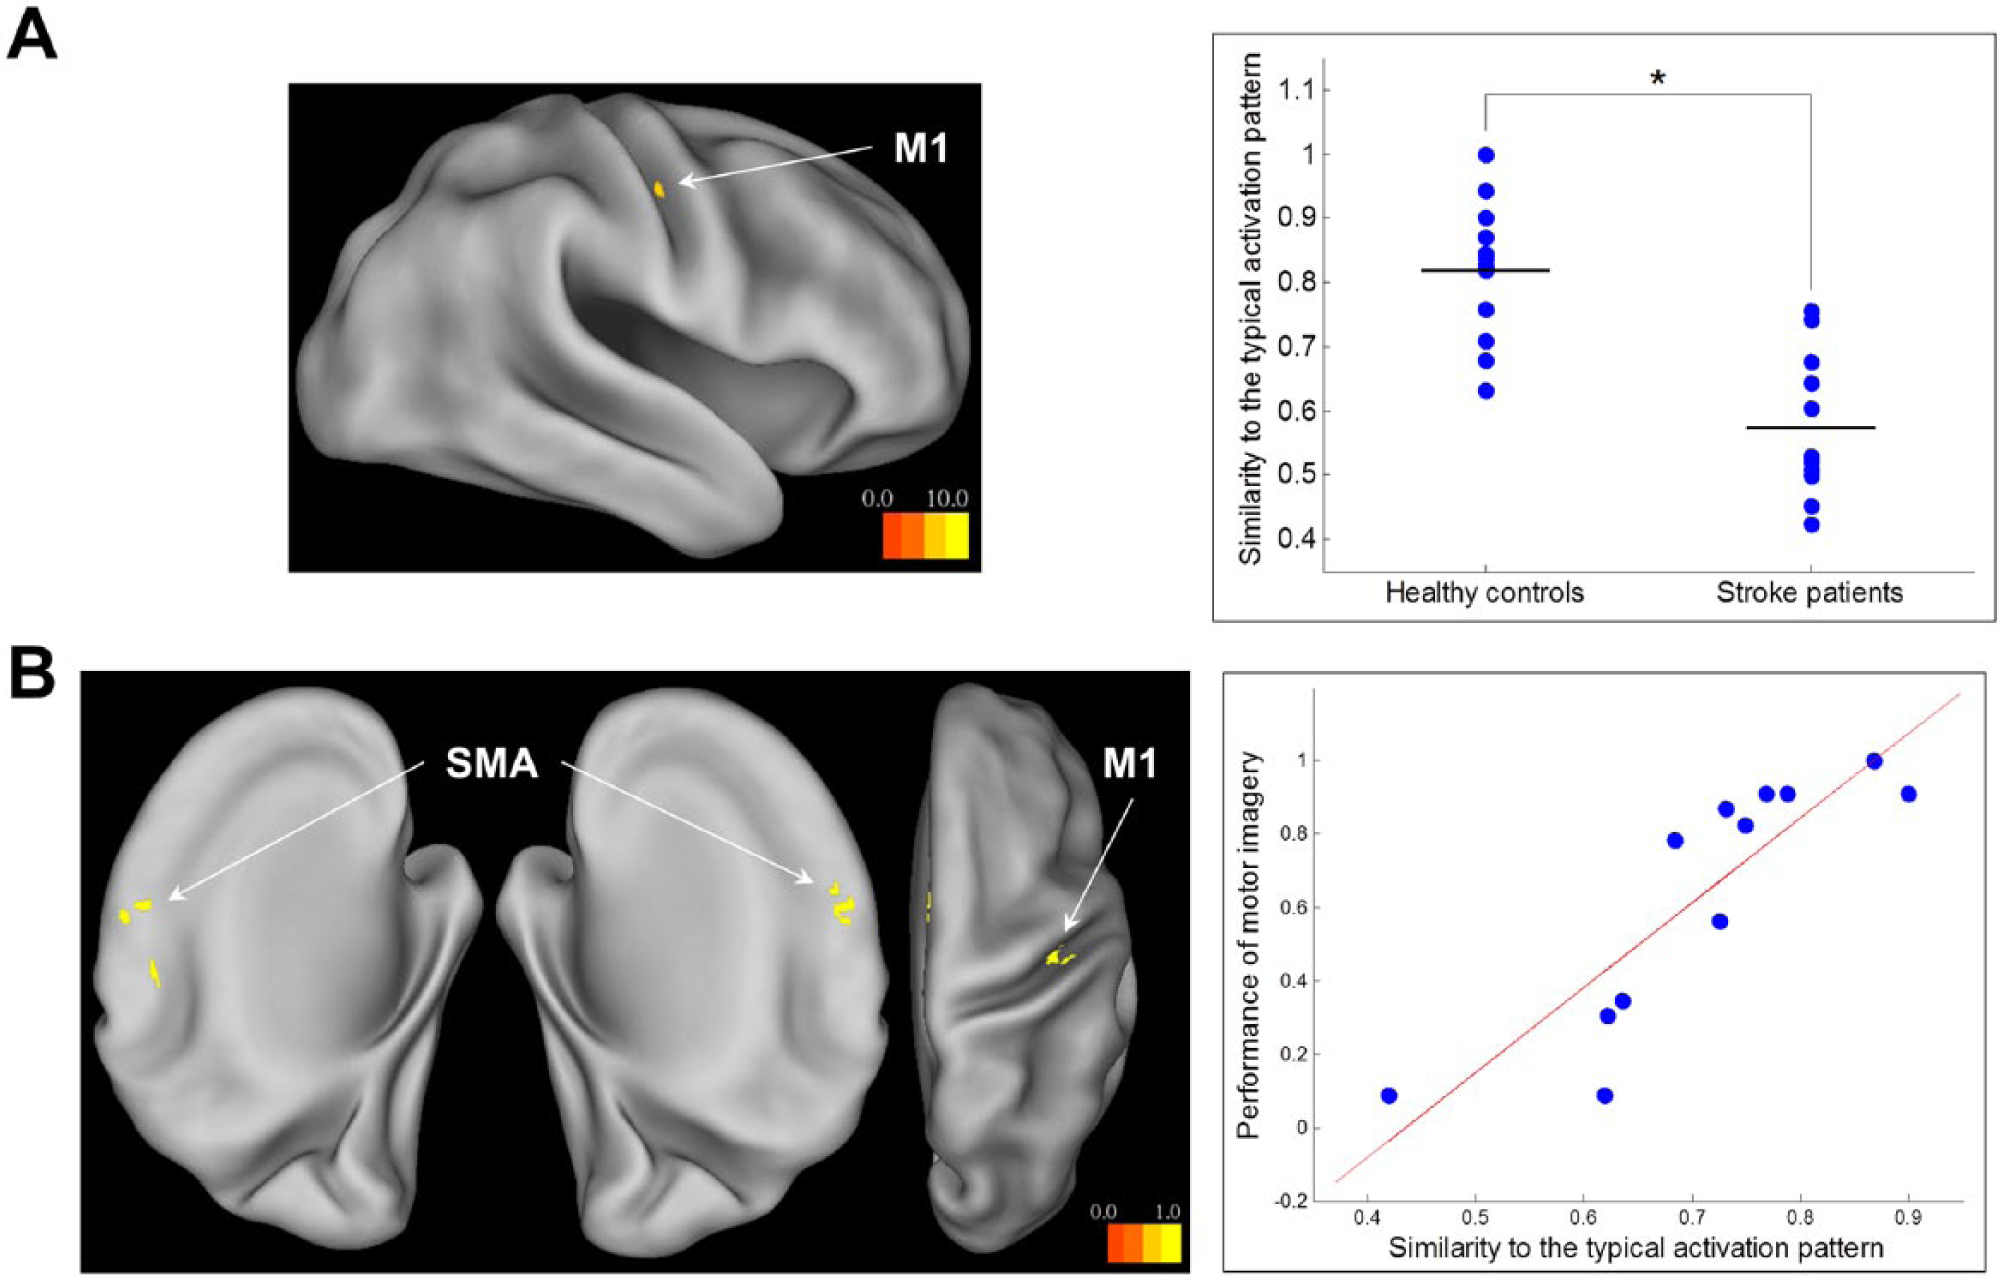
(A) Differences in neural similarity between healthy controls and stroke patients. (B) Correlations of neural similarity with motor imagery performance in stroke patients.
Association of Activation Patterns With Motor Imagery Performance
In the stroke patients, motor imagery performance was correlated with the similarity of their activation patterns to the typical activation pattern in the bilateral SMA and ipsilesional M1 (Table 2 and Figure 3B). The stroke patients exhibited better performance of motor imagery to the extent that their activation patterns in these motor cortical areas were close to the typical activation pattern. The plot in Figure 3B displays the correlation of neural similarity with motor imagery performance in the voxel of the contralesional SMA in which the correlation was maximal.
Motor Cortical Areas in Which Neural Similarity Was Associated With Motor Imagery Performance in Stroke Patients.
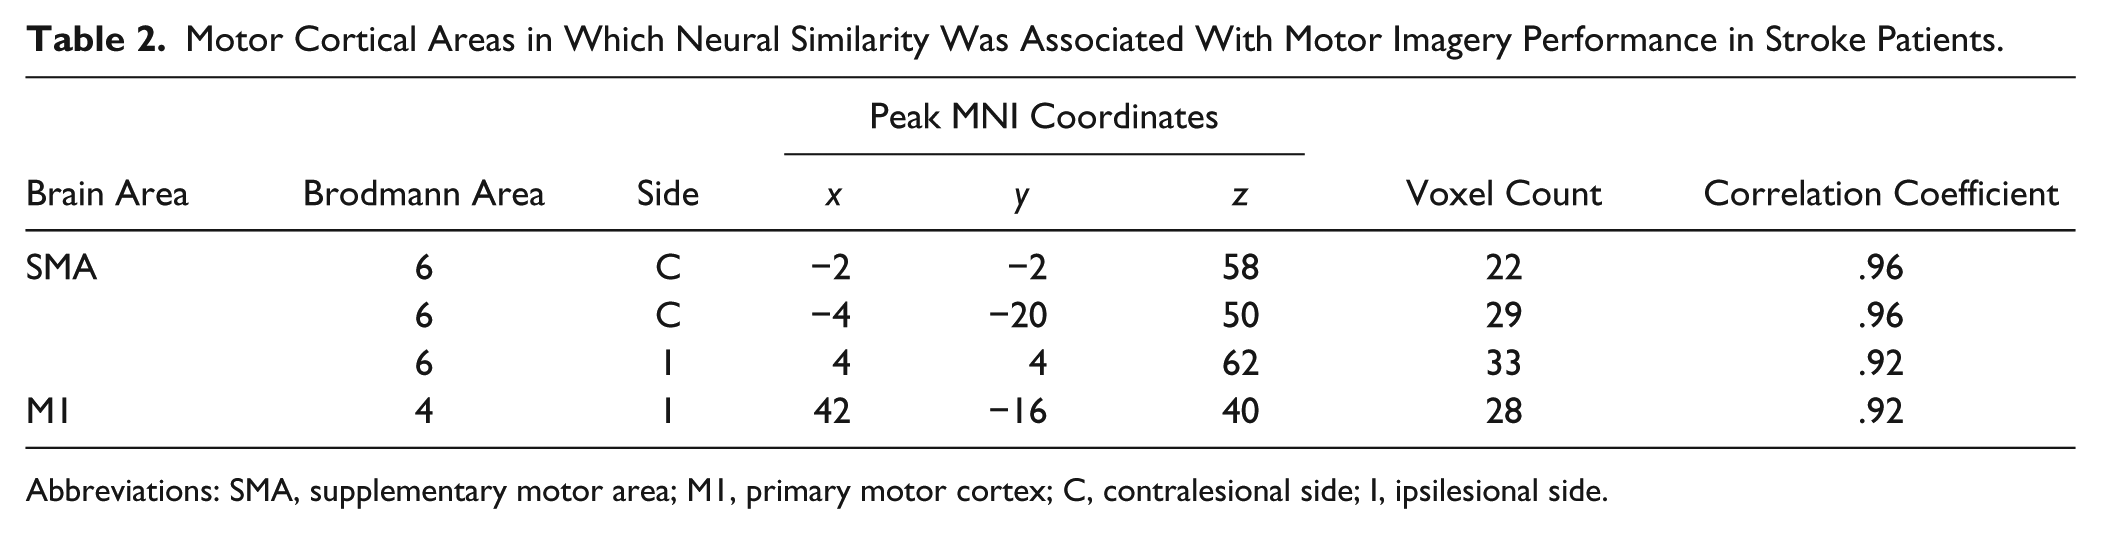
Abbreviations: SMA, supplementary motor area; M1, primary motor cortex; C, contralesional side; I, ipsilesional side.
Discussion
In considering potential application to a motor imagery–based BCI, this study used a multivariate pattern analysis of fMRI data to search for motor cortical areas that play functional roles related to motor imagery performance in stroke patients. The results demonstrated that the bilateral SMAs and ipsilesional M1 are the motor cortical areas that could be of interest for monitoring compliance with motor imagery by stroke patients.
Even though activation of the contralateral M1 during motor imagery has not been consistently shown even in healthy subjects, 17 an important role of this area is supported by its increased excitability induced by motor imagery, 18 in particular by kinesthetic motor imagery than by visual motor imagery, 19 as indicated under transcranial magnetic stimulation. Our study has shown that activation of the contralateral (ipsilesional) M1 could be altered after stroke: in terms of stroke patients’ activation levels, activation was not found in the area (Figure 2B); in terms of their activation patterns, similarity to the typical activation pattern was lower than that of healthy subjects in the area (Figure 3A). The involvement of the ipsilesional M1 during motor imagery could still be displayed in stroke patients, 20 but this may have been dependent on the pathological factors of individual patients, such as the lesion characteristics of stroke. All stroke patients who participated in this study had subcortical lesions, without damage to the ipsilesional M1. The ipsilesional M1 activation patterns of stroke patients, which were dissimilar to the typical activation pattern of healthy subjects, may have indicated secondary degeneration that was possibly related to upstream dysfunction from corticospinal damage. 21
We have shown that information on the activation pattern in the bilateral SMAs and ipsilesional M1 could be used to infer the performance of motor imagery in stroke patients. The closer stroke patients’ activation patterns were to the typical activation pattern of healthy subjects, the better their motor imagery performance was. In contrast to the controversy over M1 activation, the SMA has been shown to be consistently activated during motor imagery. 17 The functional role of the SMA in the motor system can be inferred in the context of both motor imagery and motor execution: in motor imagery, the SMA exerts an inhibitory influence on the M1 22 ; during motor execution, the SMA is known to be involved in preparing the motor system for movement, specifically in connection with the release of a motor command by suppressing the inhibitory output exerted on the M1. 23 The association of the SMA activation pattern with motor imagery performance highlights the functional role of the SMA, such that stroke patients can correctly perform motor imagery to the extent that the SMA suppresses movement represented in the motor system under impairments. The functional role of the ipsilesional M1 in motor imagery after stroke may be nonexecutive, reflecting increased demand on the encoding of spatial components of movement in the damaged motor system. 20 It may be worth noting that the interpatient variability of the ipsilesional M1 activation pattern, which was on average dissimilar to the typical activation pattern of healthy subjects, was related to motor imagery performance.
The main motivation for using the multivariate pattern analysis in this study was because we could not find a significant association between activation levels and motor imagery performance in stroke patients by using the voxel-wise univariate analysis. In considering that information in the brain is stored in a pattern of activation across large populations of neurons, 24 we suspect that measuring patterns of activation could prove more effective than measuring levels of activation. However, in practical application to a motor imagery–based BCI, the feasibility of directly using the multivariate pattern analysis may be limited in a BCI using a small number of channels. We thus propose 2 directions for practical application to a motor imagery–based BCI. First, the motor cortical areas related to motor imagery performance (the bilateral SMA and ipsilesional M1 as found in this study) could be considered as regions of interest for a monitoring of each subject’s motor imagery performance in a BCI using a small number of channels of EEG or NIRS. Second, the multivariate pattern analysis as applied in this study may be directly used to classify the motor imagery state in a BCI using many channels of those modalities, or fMRI.
Despite the novel contributions of our approach, there are some caveats to this study. First, we did not use electromyography (EMG) recordings due to the practical challenges involved in performing fMRI experiments. We monitored subjects by visual inspection to ensure that they did not move during the motor imagery task, but we may have missed some overt or covert movement that could have been captured if we had used EMG recordings. Second, the possibility that subjects provided correct responses by chance or by using alternative strategies may not be excluded, even though we made great efforts to ensure subjects’ faithful performance in the motor imagery task. The means of checking individual subjects’ motor imagery performance could be improved to more directly reflect their compliance with motor imagery. Third, we considered an imaginary finger tapping task using only the affected hand in stroke patients. The activation patterns of stroke patients may differ from those of healthy subjects even for the unaffected hand, and the imagined unaffected hand could serve as individual control conditions against the imagined affected hand. 25
Furthermore, we focused on motor cortical activation in this study, but other brain areas, specifically frontoparietal cortices, have also been shown to be consistently activated in motor imagery. 17 In particular, the influence of lesion location on the performance of motor imagery 26 reflects functional roles of the brain areas outside the motor cortex in stroke patients, which need to be fully investigated in future studies.
Conclusions
By adopting an imaginary finger tapping task in which motor imagery performance could be checked and by using a multivariate pattern analysis of fMRI data, we revealed the functional roles of the SMA and ipsilesional M1 in relation to motor imagery performance in stroke patients. We envisage that these motor cortical areas can be considered for monitoring compliance with motor imagery by stroke patients in a motor imagery-based BCI for rehabilitative interventions.
Footnotes
Declaration of Conflicting Interests
The author(s) declared no potential conflicts of interest with respect to the research, authorship, and/or publication of this article.
Funding
The author(s) disclosed receipt of the following financial support for the research, authorship, and/or publication of this article:This study was supported by the SMC-KIST Translational Research Program in 2012, the National Research Foundation of Korea (NRF-2014R1A2A1A01005128), and the Korea Science and Engineering Foundation (M10644000022-06N4400-02210).
References
Supplementary Material
Please find the following supplemental material available below.
For Open Access articles published under a Creative Commons License, all supplemental material carries the same license as the article it is associated with.
For non-Open Access articles published, all supplemental material carries a non-exclusive license, and permission requests for re-use of supplemental material or any part of supplemental material shall be sent directly to the copyright owner as specified in the copyright notice associated with the article.