
Abstract
Background and objectives. The 6-minute walk test (6MWT) is used to measure exercise capacity after stroke. We sought to compare cardiorespiratory responses during the 6MWT with responses to a ramp cycle ergometer test (CET) in community-dwelling individuals with stroke. A secondary objective was to determine the relationship between cardiorespiratory responses during each test and daily physical activity. Methods. Participants completed 3 evaluation sessions. The CET and 6MWT were conducted in 2 separate sessions at least 72 hours apart. Participants wore a portable gas analysis unit (Cosmed K4b2), which also measured heart rate (HR) during the 6MWT. A uniaxial accelerometer (activPAL) was used to measure time spent upright (standing and stepping) over 5 days as an estimate of daily physical activity. Results. Complete CET and 6MWT data were obtained for 16 participants (14 men), a mean ± standard deviation of 2.0 ± 1.1 years after stroke and 71.1 ± 9.7 years of age. Compared with the 6MWT, the CET elicited a higher VO2peak (P = .032), VCO2peak (P = .005), respiratory exchange ratio (P = .015), and self-reported perceived breathing (P < .0001) and leg heaviness (P < .0001) at test completion and a lower HRpeak (P = .029). Except for the first minute, VO2 during the 6MWT was, on average, 80% to 85% of VO2peak from the CET. Among 15 participants, average time spent upright per day was not significantly associated with 6MWT distance (r = 0.447, P = .096) or VO2peak from the CET (r = 0.388, P = .153). Conclusions. Exercise intensity achieved during the 6MWT appeared sufficiently high for aerobic training, assuming CET VO2peak accurately reflects aerobic capacity. The 6MWT may be useful for prescribing aerobic exercise poststroke.
Keywords
Introduction
Reductions in aerobic capacity 1 and neuromotor control 2 observed following stroke limit the performance of even basic everyday activities 3 and reengagement in community life. Poststroke aerobic training is increasingly being recognized as an important intervention to counteract the decline in aerobic capacity. 4 Clinically feasible methods for detecting impaired aerobic capacity and prescribing and evaluating the effectiveness of aerobic training programs would enable healthcare professionals to more effectively manage this impairment.
There are 2 methods for measuring aerobic capacity: the progressive exercise test and clinical tests, such as the 6-minute walk test 5 (6MWT). The progressive exercise test, during which breath-by-breath gas analysis is used to measure the peak level of oxygen uptake (VO2peak) achieved, is the gold standard for evaluating aerobic capacity in healthy individuals. 6 Implementing progressive exercise test protocols in individuals with chronic disease, however, poses several challenges. 7 First, people with chronic diseases such as stroke do not demonstrate a maximum level (ie, a plateau) of oxygen uptake. 7 Secondary criteria used for test termination, such as respiratory exchange ratio or peak heart rate (HRpeak), are not reliably achieved in people with stroke. 7 Second, it is assumed that maximum oxygen uptake is evoked by a large muscle volume (mass) that can challenge the capacity of the cardiorespiratory system without test-limiting local muscle fatigue. This assumption is not met, however, when the test is performed with compromised motor control of a lower extremity because of stroke. Finally, progressive exercise tests require specialized equipment as well as resources and staff training and are not accessible in all facilities or to all clinicians. 6 Best-practice recommendations 8 advise the use of standardized assessment tools, such as the 6MWT, 5 for evaluating function. Although the 6MWT is a self-paced walk test, it is less costly and more clinically feasible than a progressive exercise test and may challenge aerobic capacity to a sufficient extent to be used to assess aerobic capacity poststroke.
A number of studies have compared the cardiorespiratory responses during a laboratory-based progressive test with responses during the 6MWT among individuals with stroke.9 -15 In a sample of individuals in an inpatient stroke rehabilitation setting, HR at the end of the 6MWT was 85% of that achieved during a progressive exercise test, suggesting that the 6MWT is a significant challenge to the aerobic system. 9 In community-dwelling individuals with stroke, VO2 measured at the end of the 6MWT was 68% to 70% of the VO2peak from a progressive exercise test.10,11 The association between 6MWT distance and VO2peak is unclear, with some reports showing no or low correlation10,11,14 and others showing moderate to high correlation.9,12,13,15 Examination of VO2 throughout the 6MWT in relation to VO2peak would provide rehabilitation professionals with a clearer understanding of the aerobic challenge throughout the test and the extent to which 6MWT performance can be considered as an indicator of aerobic capacity. Comparing VO2peak during the 6MWT to VO2peak during a progressive exercise test is not sufficient to indicate the pattern of VO2 throughout the 6MWT. The 6MWT is an internally paced submaximal test that may challenge aerobic capacity earlier in the test than a progressive exercise test that provides an incremental challenge to the aerobic system.
A relationship between 6MWT performance and daily physical activity, commonly defined as the average number of steps taken per day measured using accelerometry, has been demonstrated in individuals with stroke living in the community. 16 -18 Studies in which the relationship between VO2peak from a ramp treadmill or cycle ergometer test (CET), standard measures of aerobic capacity, and daily physical activity has been examined have yielded conflicting results.19 -21 Some reports indicate no association in people less than a year after stroke who were asked to wear a step activity monitor for 48 hours.19,20 This time interval may have been insufficient to obtain data representative of usual physical activity in daily life. In 1 study that showed a moderate correlation between aerobic capacity and physical activity, people with chronic stroke were asked to wear an accelerometer for 12 consecutive days. 21 Clarifying the influence of aerobic capacity and 6MWT performance on daily activity would be helpful in guiding clinicians as to which test provides information about physical activity in daily life.
Thus, the primary aim of this study was to compare cardiorespiratory responses during the 6MWT with those during a ramp CET in community-dwelling individuals with stroke. The CET was chosen because cycling is often less limiting than walking in individuals with sensorimotor deficits after stroke, and linear increases in power are easier to achieve using an electronically braked cycle ergometer (ATS/ACCP Statement on cardiopulmonary exercise testing 6 ). A secondary objective was to determine the relationship between cardiorespiratory responses to the 6MWT and the CET and physical activity in daily life. We hypothesized that (1) cardiorespiratory responses, including mean VO2peak, peak carbon dioxide output (VCO2peak), respiratory exchange ratio, peak minute ventilation (VEpeak), HRpeak, and ratings of end-test breathing and leg heaviness, would be significantly higher during the CET than during the 6MWT and (2) moderate correlations (r = 0.50-0.69) would be observed between CET VO2peak and 6MWT distance and time spent walking and standing per day and between CET VO2peak and 6MWT VO2peak.
Methods
Design
In this prospective cross-sectional study, participants underwent 3 evaluations, each separated by a minimum of 72 hours, at a rehabilitation center, over a 2-week period. At the first session, data on demographic and clinical characteristics were collected. At the second session, 1 incremental CET was performed. Participants completed 2 6MWTs at the third session. The Joint Bridgepoint/West Park/Toronto Central CCAC/Toronto Grace Health Centre Research Ethics Board approved the research protocol. Study participants provided written consent and medical clearance from their physician before the first evaluation.
Participants
People who were ambulatory and living in the community following a hemorrhagic or ischemic stroke were targeted. Participants were considered eligible if they had a clinical diagnosis of stroke recorded in the medical chart, were able to walk 10 m independently with or without an assistive device, were living in the community at least 3 months poststroke, and were able to follow 3-step instructions to understand instructions for exercise testing. Exclusion criteria comprised resting blood pressure greater than 160/100 despite medication, other cardiovascular morbidities (eg, heart failure, abnormal blood pressure responses, ST-segment depression >2 mm, symptomatic aortic stenosis, and complex arrhythmias) that would limit exercise tolerance, unstable angina or orthostatic blood pressure decrease of >20 mm Hg with symptoms, hypertrophic cardiomyopathy, other musculoskeletal impairments that would limit the participant’s ability to cycle or walk, pain, comorbidities (eg, unclipped aneurysms and uncontrolled seizures), and cognitive or behavioral issues that would preclude participation. There were no exclusions based on age.
Measurements
6-Minute Walk Test
A physiotherapist trained in the use of the study measures administered the 6MWT in a quiet, level, temperature-controlled corridor. Reliability and validity of 6MWT performance has been demonstrated in people with stroke. 22 Two 6MWT trials were performed according to the American Thoracic Society guidelines. 23 Participants rested for a minimum of 20 minutes between trials. From this test, the following measures were taken: (1) total distance walked; (2) self-reported level of breathing and leg heaviness posttest (modified Borg 0-10 Scale 24 with descriptors: “nothing,” “light,” “moderate,” “heavy,” and “very heavy”), and (3) cardiorespiratory responses for VO2, VCO2, VE, and HR. Breath-by-breath measurements of gas exchange and breathing pattern were collected using a portable gas analysis system (COSMED, K4b 2 , Italy). The gas analysis system was calibrated before every use in accordance with the manufacturer’s instructions. HR (Polar A1 HR monitor, Polar Electro Oy, Kempele, Finland and COSMED) was monitored continuously. Data from the best 6MWT performance in terms of distance walked were analyzed.
Cycle Ergometer Test
An experienced kinesiologist/exercise physiologist administered the CET in an environmentally controlled laboratory. A symptom-limited ramp CET was performed, in a standardized manner, 25 on a semirecumbent fixed flywheel cycle ergometer (Angio Ergometer LD917904; Lode BV, Groningen, Netherlands). Participants were asked to adhere to their usual medical regimen, to not eat for at least 2 hours before exercise, and to not ingest caffeinated foods or beverages on the day of the CET. Throughout the test, 12-lead electrocardiography was recorded. Participants wore a mask and breathed through a calibrated volume sensor, and VO2, VCO2, and VE were measured breath by breath (Oxycon Pro 808302, Erich Jaeger GmbH, Wurzburg, Germany). The gas analysis system was fully calibrated immediately before every test in accordance with the manufacturer’s instructions. After 6 minutes of rest, participants pedaled without a load for 3 minutes, and thereafter, the load was increased by a rate (5, 10, or 15 W·min−1) that was designed to induce symptom limitation within 10 minutes. The rate of increase was based on each participant’s history of daily physical activity and symptoms. The participant’s foot on the paretic side was secured to the pedal as needed. The participant received standardized verbal encouragement during the test. The test was terminated once the participant was unable to maintain the required pedalling rate despite encouragement. Study participants were asked to rate their level of breathing and leg heaviness after the test using the same modified Borg 0-10 scale 24 administered during the 6MWT.
Accelerometry
A uniaxial accelerometer (activPAL, PAL Technologies Ltd, Glasgow, United Kingdom), attached to the participant’s thigh via a hydrogel adhesive pad, was used to estimate physical activity and energy expended during daily life. The activPAL has a sampling rate of 10 Hz, has been validated in healthy adults, and can accurately identify the time spent lying, sitting, standing, and walking. 26 Testing in 36 older people with impaired function, including 14 people with stroke, 27 showed that the sensor may underestimate step counts, particularly during slow walking (gait speed ≤0.47 m/s). The sensor accurately determined, however, the time spent upright during standing and walking activities. 27 Thus, time spent upright, expressed in minutes, was used in the current study to estimate daily physical activity.
To gain an accurate representation of physical activity during daily life and minimize the influence of erroneous data, participants were asked to wear the activPAL for 5 consecutive days from the time they first got out of bed in the morning until they returned to bed in the evening, removing it for showering. The time spent upright per day was derived and averaged over the 5 days to provide an estimate of physical activity during a typical day.
Descriptive Measurements
We collected data on age, gender, lesion type, side of stroke, side of hemiplegia, weight, and height. Stroke severity, motor function, balance capacity, and comfortable gait speed were assessed using the National Institutes of Health Stroke Scale, 28 Chedoke-McMaster Stroke Assessment, 29 the Berg Balance Scale, 30 and the 5-m walk test, 31 respectively.
Data Analyses
Statistical analyses were performed using Statistical Package for Social Sciences (SPSS) version 17.0 (SPSS Inc, Chicago, IL). Peak VO2 values from the CET and 6MWT were expressed as a percentage of values observed in healthy individuals using a regression equation accounting for age, sex, weight, and height. 32 Distance walked on the 6MWT was expressed as a percentage of values observed in healthy Canadians. 33 Walking speed (in m/s) during the 6MWT was computed by dividing 6MWT distance by 360 s (6 minutes). The assumption of normality for parametric tests was assessed using statistical (Shapiro-Wilk statistic) methods. Hypothesized cardiorespiratory responses during the 6MWT and CET were compared using a paired t test if normally distributed and the Wilcoxon Signed Rank test if not normally distributed. Mean levels of VO2, VCO2, VE, and HR were plotted for each minute of the CET and 6MWT to characterize the pattern of cardiorespiratory response. For graphical presentation of data from the CET, individual measures of VO2, VCO2, VE, and HR at 10% increments (ie, deciles) of the total test duration (not including the 3 minutes of unloaded pedaling) were estimated using a 2-dimensional smoothing transformation (SigmaPlot) with rejection of outlying data points. There are vertical and horizontal error bars with smoothed data because time is also a mean (different times among participants at each decile).
The level of association between cardiorespiratory variables (ie, distance, VO2peak, and HRpeak from the 6MWT; VO2peak, peak power, and HRpeak from CET) and physical activity (ie, time spent upright per day) was assessed using the Pearson correlation coefficient for normally distributed variables and the Spearman rank correlation coefficient for variables without a normal distribution, with a significance level of .05. A correlation coefficient of 0.90 to 1.00 was interpreted as very high, 0.70 to 0.89 as high, 0.50 to 0.69 as moderate, and 0.26 to 0.49 as low. 11 Computing the square of the Pearson correlation coefficient for significant correlations yields the R2 value, interpreted as the proportion of variability in the dependent variable explained by the independent variable. 34 Results were presented as mean ± standard deviation unless otherwise stated.
Results
Of the 23 individuals who consented to participate, 4 (17%) did not complete the study because of the occurrence of another stroke (n = 1) and loss to follow-up (n = 3). Complete data from both the CET and the 6MWT were obtained for 16 participants. Table 1 summarizes the sociodemographic and clinical characteristics of these participants.
Participant Characteristics (n = 16).
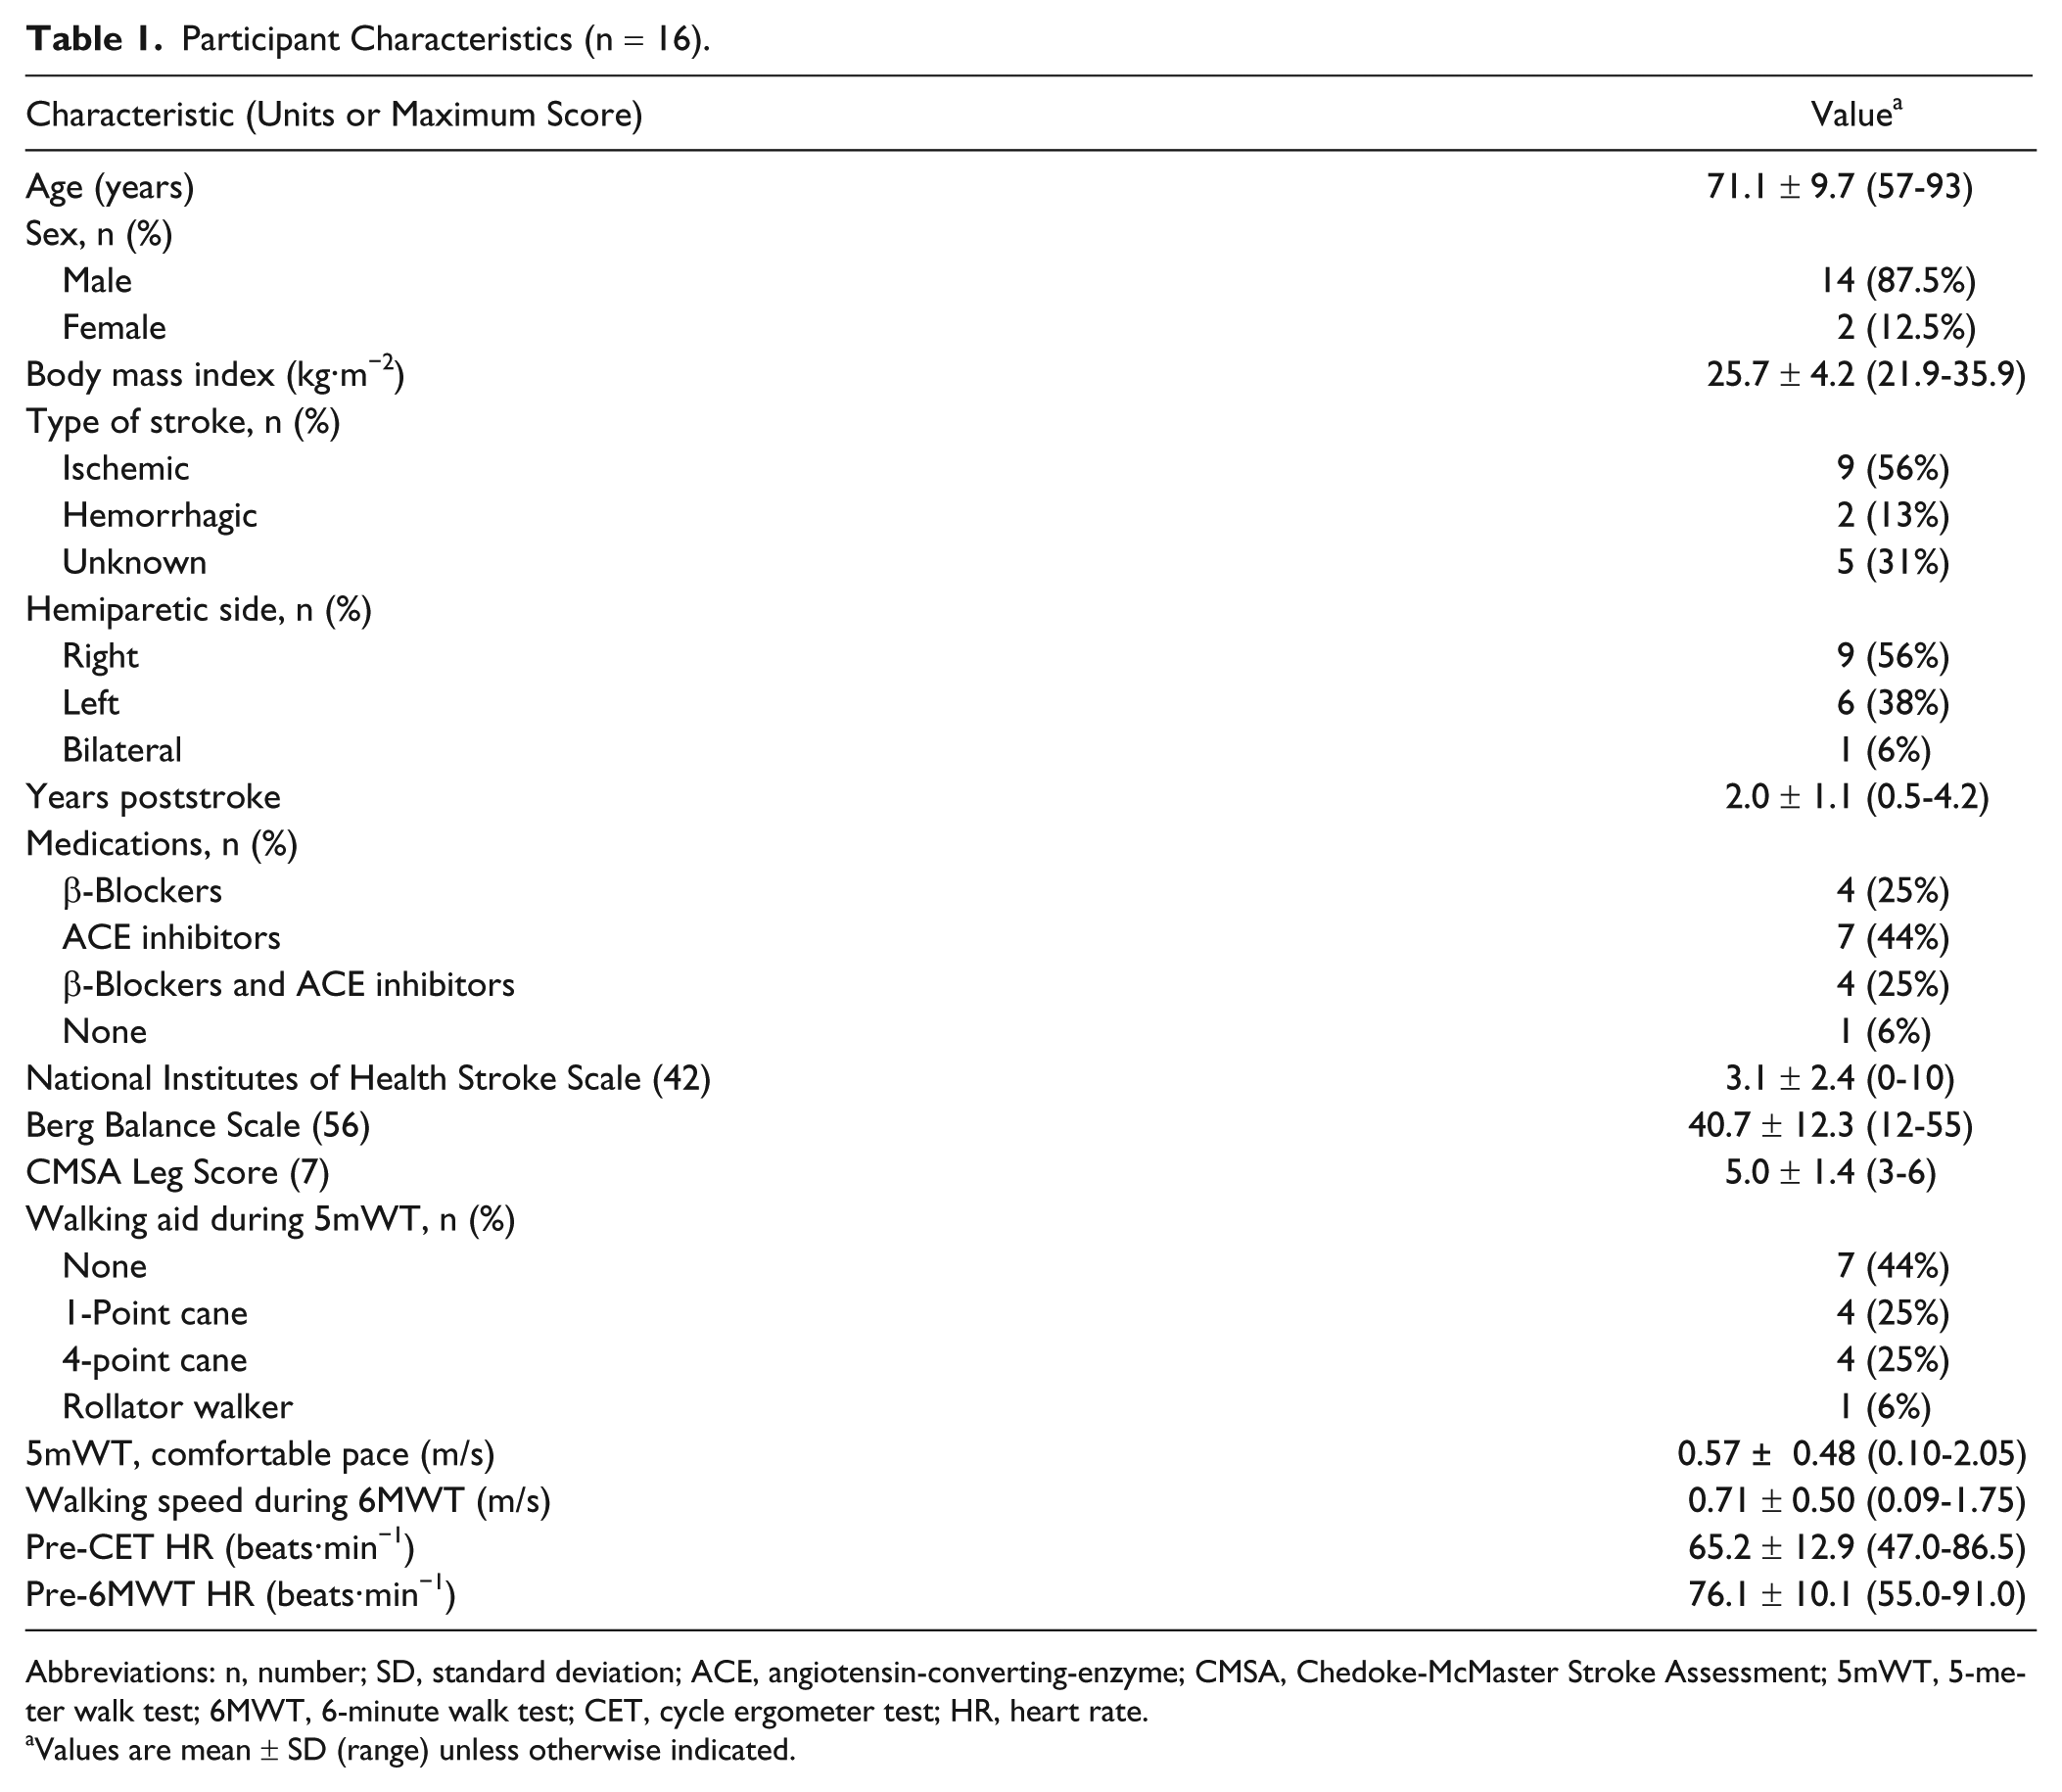
Abbreviations: n, number; SD, standard deviation; ACE, angiotensin-converting-enzyme; CMSA, Chedoke-McMaster Stroke Assessment; 5mWT, 5-meter walk test; 6MWT, 6-minute walk test; CET, cycle ergometer test; HR, heart rate.
Values are mean ± SD (range) unless otherwise indicated.
In Table 2, we compare the cardiorespiratory responses during the CET and the 6MWT. On the CET and the 6MWT, values of VO2peak were 69.8% ± 22.5% predicted and 60.1% ± 24.0% predicted, respectively. The 6MWT VO2peak was 87% ± 22% of the CET VO2peak. Distance walked on the 6MWT was 254.9 ± 180.9 m (41.1% ± 28.8% predicted) and ranged from 32.0 to 631.0 m. In all, 9 participants with 6MWT distances ranging from 32.0 to 631.0 m demonstrated a higher HRpeak during the 6MWT than during the CET. End-test HR for the 6MWT, available for 15 participants, was 103.7 ± 13.0 beats·min−1 (range = 79-118 beats·min−1) and was not statistically different from the CET HRpeak (98.3 ± 17.1 beats·min−1, P = .248).
Comparing Cardiorespiratory Responses to CET and 6MWT (n = 16).
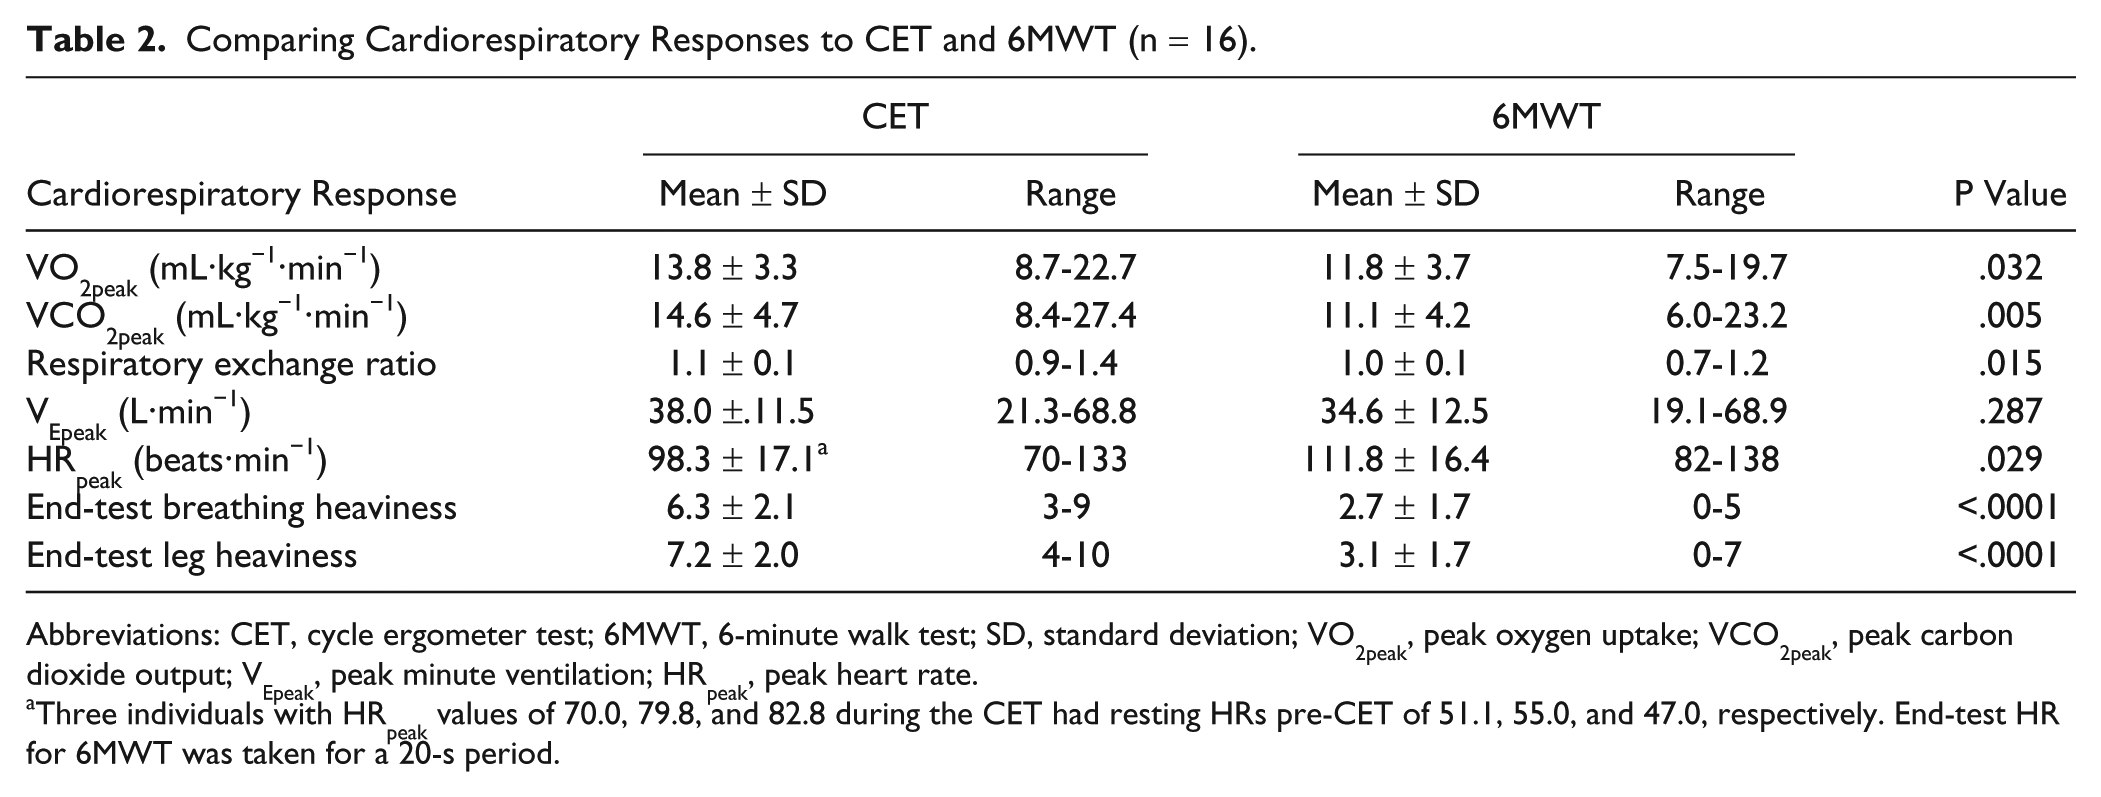
Abbreviations: CET, cycle ergometer test; 6MWT, 6-minute walk test; SD, standard deviation; VO2peak, peak oxygen uptake; VCO2peak, peak carbon dioxide output; VEpeak, peak minute ventilation; HRpeak, peak heart rate.
Three individuals with HRpeak values of 70.0, 79.8, and 82.8 during the CET had resting HRs pre-CET of 51.1, 55.0, and 47.0, respectively. End-test HR for 6MWT was taken for a 20-s period.
Figure 1 shows plots of mean VO2, VCO2, VE, and HR throughout the CET and 6MWT. The incremental duration of the CET was 8.1 ± 3.1 minutes (range = 4.8-15.3 minutes).
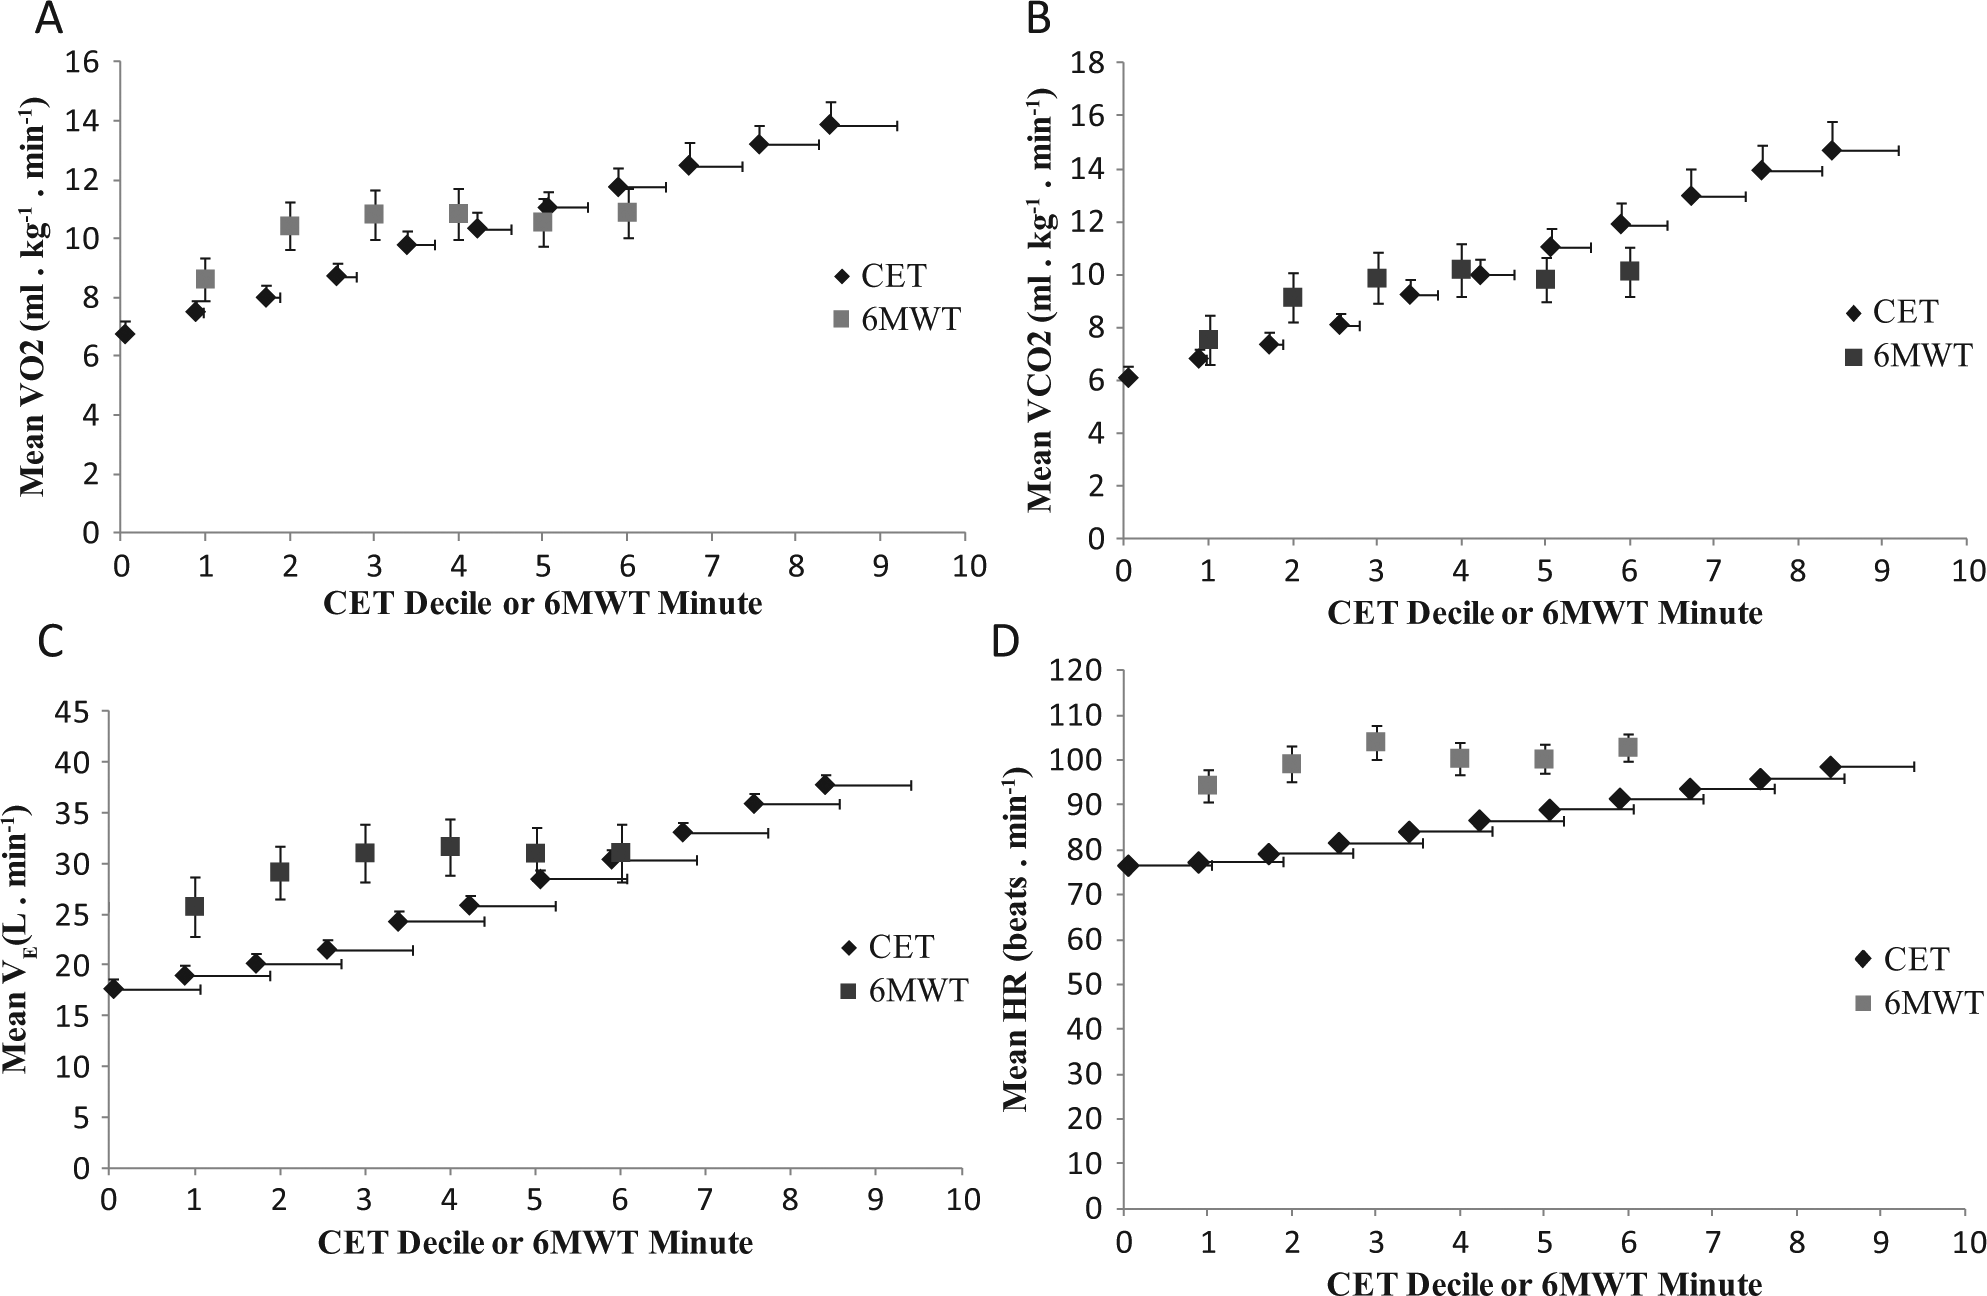
Mean (A) VO2, (B) VCO2, (C) VE, and (D) HR in each decile of time for the CET and in each minute of the 6MWT. Vertical bars represent ± 1 standard error. Note that there are error bars in both directions with smoothed data because time is also a mean.
A total of 15 participants provided accelerometry data. One individual wore the accelerometer for 3 days, and 1 person wore it for 2 days instead of 5 days. Participants wore the accelerometer 12.0 ± 2.1 h/d over the 5-day period (range = 7.2-15.4 h/d). The time spent upright per day was 188.8 ± 135.9 minutes (range = 0-467.8 minutes). Accelerometry output indicated 0 minutes spent upright over the 5-day period for 1 participant who used a motorized wheelchair.
Figure 2 displays the mean of VO2 from the 6MWT expressed as a percentage of the VO2peak from the CET for each minute of the 6MWT. Table 3 presents the number and percentage of individuals whose level of VO2 was 0% to 39%, 40% to 70%, 71% to 100%, and >100% of VO2peak observed on the CET in each minute of the 6MWT.
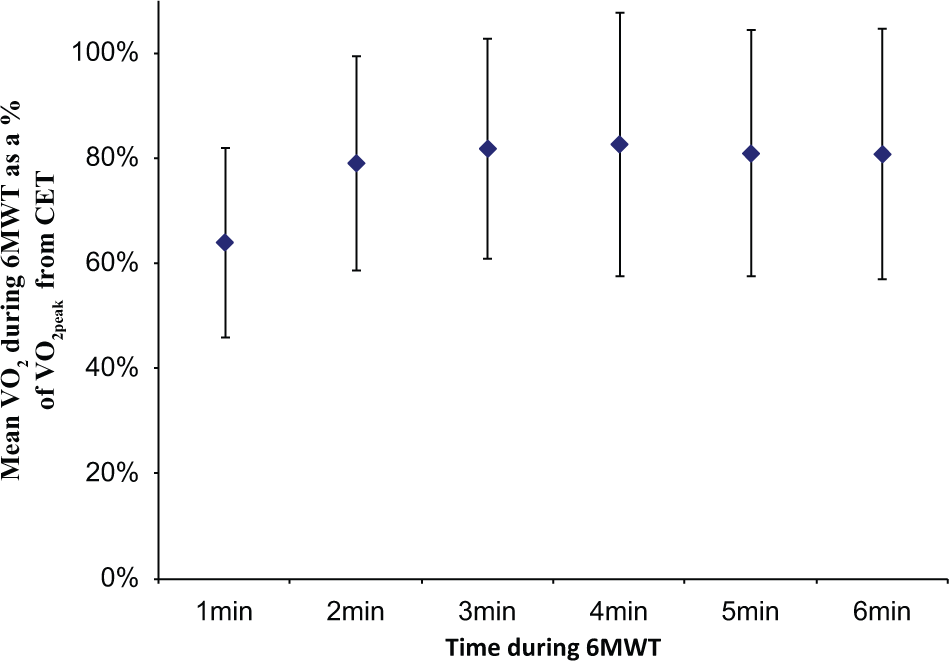
Mean VO2 from the 6MWT expressed as a percentage of VO2peak from the CET for each minute of the 6MWT: vertical bars represent ± 1 standard deviation.
Intensity of Walking Performance Throughout the 6MWT (n = 16).
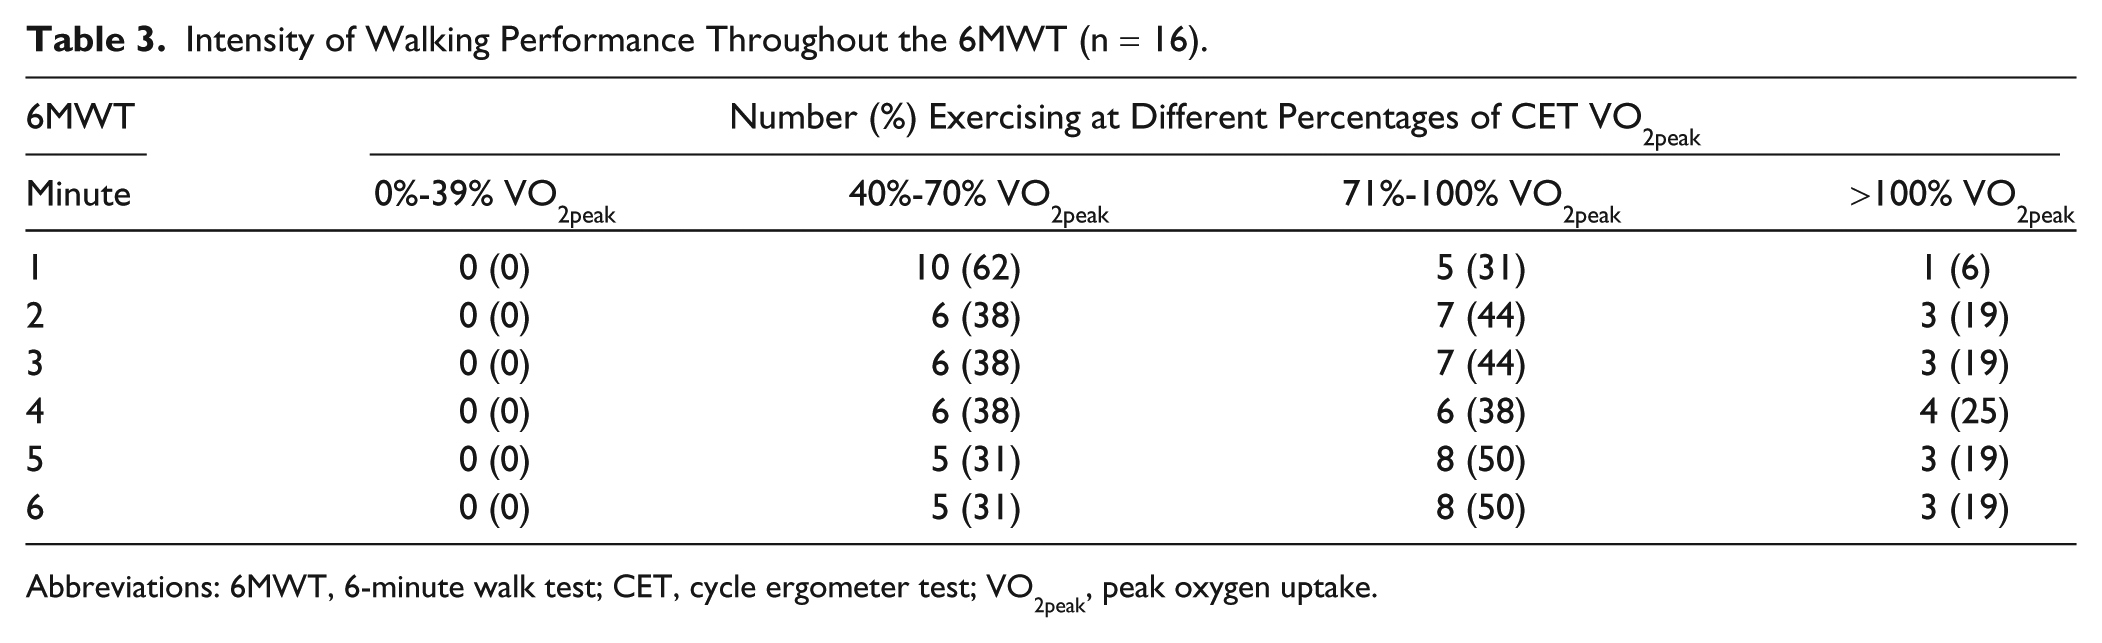
Abbreviations: 6MWT, 6-minute walk test; CET, cycle ergometer test; VO2peak, peak oxygen uptake.
Table 4 presents the correlations between CET and 6MWT outputs and estimated daily physical activity. Peak VO2 from the CET was moderately associated with VO2peak from the 6MWT (r = 0.531; P = .033) but not distance walked (r = 0.271; P = .316). Peak power from the CET was moderately correlated with VO2peak from the 6MWT (r = 0.528; P = .034) and 6MWT distance (r = 0.552; P = .025).
Pearson Correlation Between CET and 6MWT Outputs and Time Spent Upright Per Day (n = 15). a
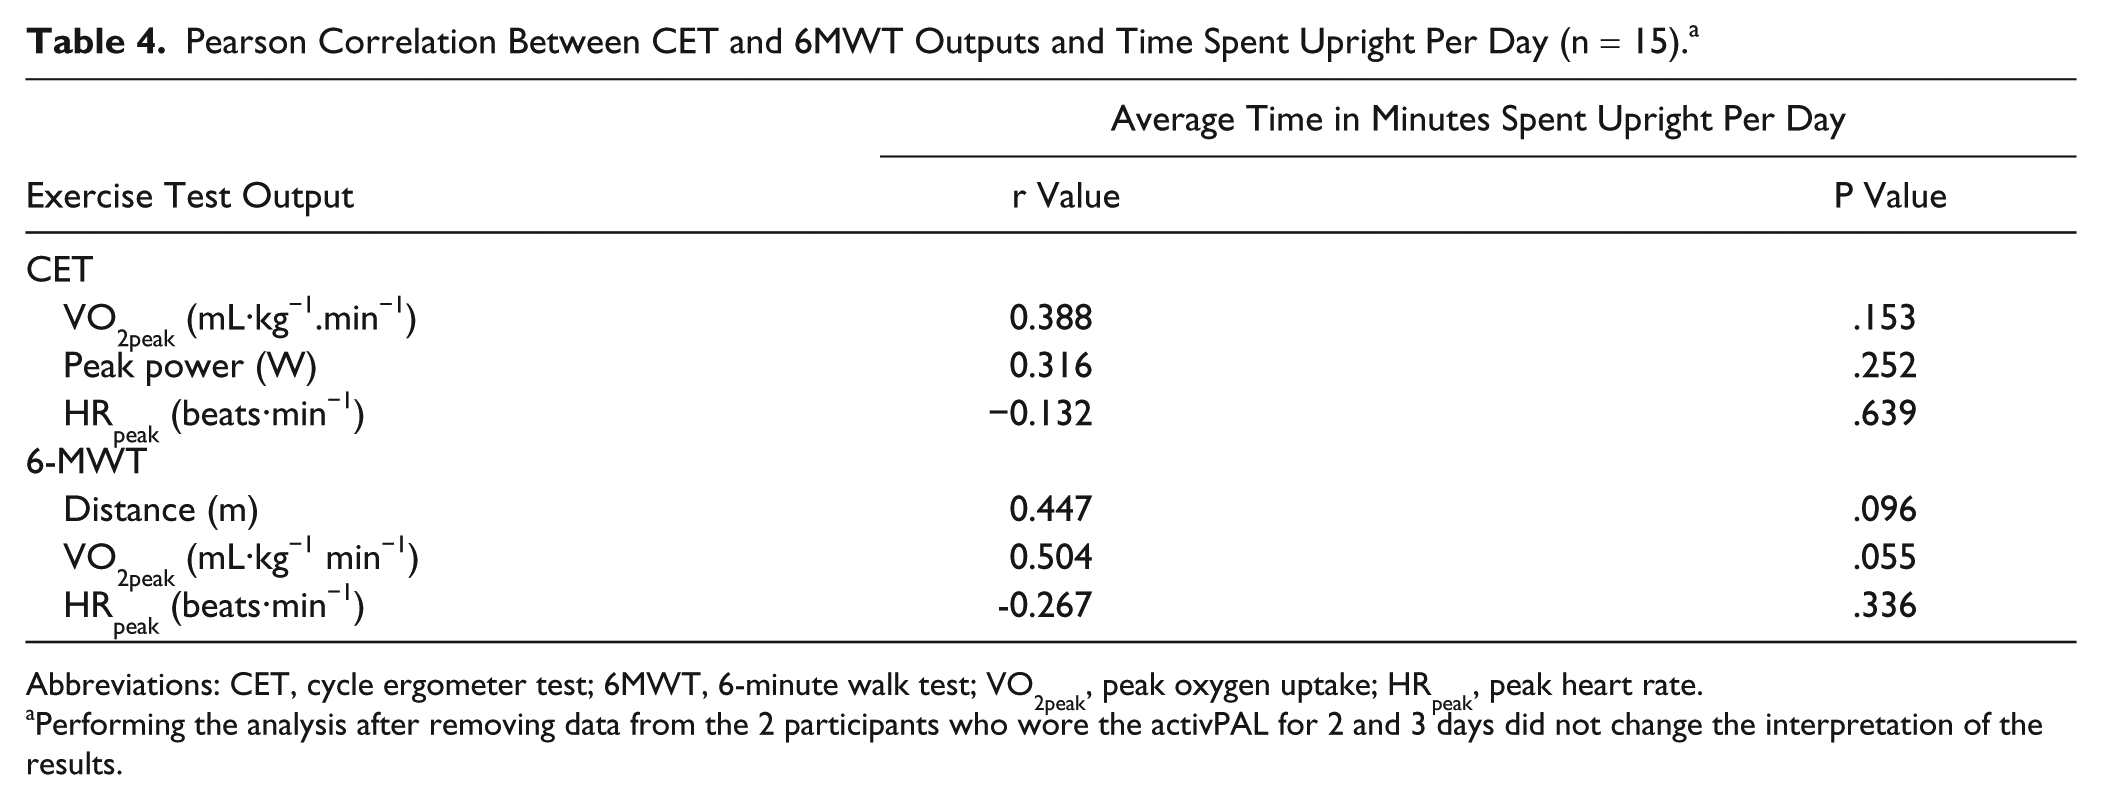
Abbreviations: CET, cycle ergometer test; 6MWT, 6-minute walk test; VO2peak, peak oxygen uptake; HRpeak, peak heart rate.
Performing the analysis after removing data from the 2 participants who wore the activPAL for 2 and 3 days did not change the interpretation of the results.
Discussion
This study aimed to determine the cardiorespiratory responses of people with stroke throughout the 6MWT and compare them with responses during the CET. The study also aimed to increase understanding of the association between cardiorespiratory responses to the 6MWT and the CET and physical activity in daily life. Findings indicate that the conventional CET elicits a higher level of VO2peak, VCO2peak, respiratory exchange ratio, and symptoms of breathing and leg heaviness than the 6MWT, whereas the 6MWT elicits a greater HRpeak than the CET. None of the CET or 6MWT responses correlated significantly with daily physical activity estimated using time spent upright. The largest correlation coefficient observed was between VO2peak from the 6MWT and time spent upright (r = 0.504, P = .055).
The different pattern of cardiorespiratory responses during the CET and the 6MWT reflected the unique aerobic challenge of each test. During the progressive CET, cardiorespiratory response levels increased, as expected, in a linear pattern owing to the relationship between metabolic and mechanical power. At the end of the test, when resistance was highest, mean ratings of breathing and leg heaviness were 6.3 and 7.2 out of 10, respectively, suggesting that both aerobic capacity and lower-extremity motor function limited performance on the CET. In contrast, the pattern of cardiorespiratory responses to the self-paced 6MWT suggests that people with stroke rapidly increase their cardiorespiratory effort within the first 2 minutes and maintain their cardiorespiratory response thereafter. This approach yielded ratings of breathing and leg heaviness that were less than half the values observed post-CET. These findings suggest that in people with moderate-to-severe motor deficits poststroke, metabolic values at the end of the 6MWT are similar to and can be used to approximate peak values during the 6MWT. People with less severe motor deficits than observed in the current study (self-selected gait speed 0.80 ± 0.26 vs 0.57 ± 0.48 m/s in the current study; Berg Balance Scale score 49.2 ± 3.5 vs 40.7 ± 12.3 in the current study) demonstrate a similar rapid initial rise in HR in the first 2 minutes of the 6MWT. 35 After this point, however, HR continues to gradually increase, with the peak occurring at 6 minutes. 35
Our finding of a greater VO2peak during the CET than during the 6MWT agrees with earlier reports.10,11 Participants in the current study, however, more closely approximated their CET VO2peak during the 6MWT than individuals in previous studies. In the current study, 6MWT VO2peak was 87% of the CET VO2peak, on average, whereas Eng et al 11 and Pang et al 10 reported values of 70% and 67.7%, respectively. This can be primarily explained by the lower level of VO2peak achieved on the CET in the current study (13.8 ± 3.3 mL·kg−1·min−1) compared with previous studies (17.2 ± 3.0 mL·kg−1·min−1 [Eng et al 11 ]; 22.0 ± 4.8 mL·kg−1·min−1 [Pang et al 10 ]). Levels of 6MWT VO2peak across studies were closer in value. It is not surprising that our participants achieved lower levels of CET VO2peak than participants in the studies by Eng et al 11 and Pang et al, 10 given that our participants were older and demonstrated a greater degree of motor impairment compared with the individuals in these previous studies.10,11 A diminished cardiorespiratory response is observed in people with lower-limb paresis caused by stroke. 14 A study of 1-legged cycling poststroke has shown that the use of the paretic lower limb leads to lower, but valid, mean values of VO2peak, HRpeak, maximal workload, and total exercise time compared with cycling with the nonparetic lower limb. 14
A related result is that our study participants demonstrated a significantly greater HRpeak during the 6MWT than during the CET, which contrasts with findings from previous studies.9-11,14 This result was surprising because every other cardiorespiratory parameter (ie, VO2peak, VCO2peak, respiratory exchange ratio, VEpeak, and self-reported perceived breathing/leg heaviness) was higher, on average, during the CET than during the 6MWT. One can speculate that participants in the current study, who had more severe motor and balance deficits than individuals in previous studies, experienced anxiety related to maintaining their balance while walking and turning, unsupported, during the 6MWT. The same level of anxiety would not have been experienced while sitting securely on the recumbent stationary bicycle, thus, explaining why HRpeak was higher during the 6MWT when compared with the CET.
A notable contribution of this study is illustration of the extent to which aerobic capacity is challenged throughout the 6MWT. All participants in the current study walked at an exercise intensity that was greater than the minimum level of 40% of VO2peak recommended for aerobic training poststroke, 36 with several individuals exceeding 100% of the CET VO2peak throughout the 6MWT. If people with moderate-to-severe motor deficits poststroke achieve lower values of VO2peak on the CET than people with less-severe deficits, then it is not surprising that select individuals would surpass their CET VO2peak during the 6MWT owing to the physical challenge posed by the test.10,19,35,37 Although our results suggest that a timed walking task may represent a clinically feasible mode for aerobic training, the greater cardiorespiratory responses achieved during the CET by the majority of participants indicates that pedaling a stationary bicycle represents a more efficient mode of aerobic training than walking poststroke.
Controversy exists in the literature regarding the association between 6MWT distance and VO2peak from the CET. Our findings would support the conclusion arrived at by some11,14 that 6MWT distance is not an optimal indicator of aerobic capacity in community-dwelling people with stroke. It is unclear what factors may be responsible for the variation in the magnitude of correlations observed. Studies in which a moderate or high correlation was found9,12,13,15 included participants that were similar 13 or younger9,12,15 in age, similar 12 or better9,13,15 in 6MWT performance, and better 12 or worse9,15 in fitness levels compared with participants in the current study.
Our findings do not align with previous studies showing a significant moderate correlation between 6MWT distance and physical activity.16 -18 Participant characteristics do not appear to explain this discrepancy because participants across studies were similar with respect to age, time poststroke, and level of gait deficit.16 -18 Because of our small sample size, our study was likely underpowered to detect the correlation we observed between 6MWT distance and time spent upright (r = 0.447, P = .096). In previous research,16 -18 6MWT distance has explained more than 45% of the variability in physical activity, which suggests that targeting improved 6MWT performance in stroke rehabilitation may contribute to promoting physical activity on discharge home. Identifying additional physical, mental, social, and environmental factors that could account for the unexplained variability in physical activity would improve our understanding of how to increase physical activity in people living in the community after stroke.
Our results did not support a relationship between CET VO2peak and physical activity, which is consistent with the findings of Michael and colleagues19,20 who measured steps per day using a step activity monitor strapped to the ankle. Michael and Macko 20 found low statistically significant correlations between VO2peak and physical activity in people with low and high but not medium step activity intensity, suggesting that the relationship, although weak, may vary by level of physical activity. In contrast, Katoh et al 21 found a moderate correlation between VO2peak and physical activity measured over a 12-day period, which may have yielded more representative estimates of daily activity compared with those obtained over a 5-day period in the current study.
Study limitations in addition to those already described should be considered. The estimated daily physical activity for the 2 individuals who wore the accelerometer for 2 or 3 days may be less representative than estimates obtained over a period of 5 days. Analyses conducted after removing data from these 2 individuals from the data set, however, did not change the interpretation of the results. Finally, the generalizability of study findings is limited to people who can ambulate independently, with or without a gait aid, after stroke.
Conclusions
In community-dwelling people with moderate-to-severe motor deficits poststroke, the 6MWT elicits a lower VO2peak and a higher HR response than the CET. The level of VO2 throughout the 6MWT, however, may be sufficient for aerobic training. Cardiorespiratory responses during the 6MWT and CET did not correlate with daily physical activity, although the study was underpowered to detect low-to-moderate correlations. Future studies should explore use of the 6MWT and externally paced tests, such as the shuttle walk test, to prescribe aerobic training poststroke.
Footnotes
Acknowledgements
We acknowledge the assistance of Dr Ada Tang and Dr William McIlroy in the conceptualization of the study and Dr Christopher Boulias for referring patients to the study.
Declaration of Conflicting Interests
The authors declared no potential conflicts of interest with respect to the research, authorship, and/or publication of this article.
Funding
The authors disclosed receipt of the following financial support for the research, authorship, and/or publication of this article: This research was supported by a grant from the Ministry of Health and Long-Term Care–Ontario Stroke System. Dr Brooks is supported by a Canada Research Chair.