
Abstract
Background. In the past several years, several randomized controlled trials (RCTs) have been reported regarding the efficacy of treadmill-based walking-specific rehabilitation programs, either individually (TT) or combined with body weight support (BWSTT), over control group therapies poststroke. No clear consensus exists as to whether treadmill-based interventions are superior in rehabilitating walking speed (WS) poststroke. Objective. To review published RCTs examining TT and BWSTT poststroke and describe the effects on improving and retaining WS. Methods. A systematic literature search in computerized databases was conducted to identify RCTs whose methodological quality was assessed with PEDro. Pre- and post-WS, change in WS, functional outcomes, and follow-up speed were extracted and calculated from each study. Additionally, statistical results of each study were examined, and the intragroup and intergroup effect sizes (ESintra and ESinter, respectively) were calculated. Results. All studies (8 TT; 7 BWSTT) met the inclusion criteria, and their methodological quality was generally good, with a mean PEDro score 6.9/10. Of the 15 studies, 8 studies (4 TT; 4 BWSTT) reported intragroup significant increases of WS, whereas only 4 (4 TT) found superiority of treadmill interventions. Nine studies demonstrated large ESintra (4 TT; 5 BWSTT), yet only 3 showed large ESinter (1 TT; 2 BWSTT). Four studies (2 TT and 2 BWSTT) reported retention of gains in WS, regardless of intervention. Conclusions. Treadmill-based interventions poststroke may increase and retain WS, but their universal superiority to other control group therapies has failed to be established.
Introduction
Using a treadmill as a component of behavioral and physical rehabilitation is common for walking-specific rehabilitation research poststroke. Treadmill-based training may be used either alone (TT) or in combination with body weight support (BWSTT). 1 Walking on the treadmill allows a person with a neurological condition to perform stepping that is more repetitive and at a higher speed than would be easily attained over ground.2,3 BWSTT is hypothesized to increase the utility of the treadmill environment by assisting with balance control and eliminating the need for assistive devices. A unique characteristic of BWSTT is the reduction of the body weight during training, creating a “permissive environment” in which people may perform repetitive step training at an intensity and independence difficult to achieve in traditional rehabilitation environments. 4
Despite these unique characteristics and theoretically sound modes of action, there is limited evidence to date demonstrating superiority of treadmill training over control group therapies in walking-related outcomes in people poststroke.5,6 Previous reviews of case reports, small group designs, and non–randomized controlled trials (RCTs) have implied promising results. However, a meta-analysis, 6 which examined if treadmill interventions promoted greater improvements in walking and quality of life–related outcomes in people poststroke compared to control group therapies, reported no significant differences between the interventions. Similarly, a critical review, 5 which reported the post-speed, follow-up speed, and the respective functional category 7 of each group, found no differences in posttreatment self-selected walking speed (SSWS) across widely used rehabilitation modalities, including TT and BWSTT. Therefore, it was implied that control group therapies, which might be more cost-efficient, result in similar functional increases in SSWS as treadmill interventions. For this reason, it has been suggested that the potential application and widespread use of treadmill training as a rehabilitation mode in people poststroke should be reconsidered outside of the scientific environment. 8
In spite of these important findings, these reviews had several limitations. Not all studies included in the meta-analysis 6 were RCTs, and intergroup differences and change in SSWS were not reported in the critical review; rather, the results relied simply on the discharge SSWS. 5 Furthermore, there has been no analysis of effect sizes (ES), either within experimental groups or between experimental and control groups, enabling a comparison between studies of varying sample sizes and power. At the time of these original reviews, there was a need for large-scale RCTs that could determine the potential effects of treadmill interventions, TT or BWSTT, on walking-related outcomes in people poststroke. However, with multiple RCTs now available for inspection, an additional systematic review is required to assess the current best level of evidence. Consequently, such detailed analysis will be novel to the literature and will allow for interpretations and summaries previously not possible.
The objectives of this systematic review were to examine the available RCTs of treadmill-based interventions in people poststroke and (a) to evaluate the effectiveness of TT and BWSTT by assessing final walking speed (post-speed), change in walking speed (ΔSpeed), and retention of walking speed changes for those studies that reported such findings; (b) to calculate ES to assess the effect of the intervention (ESintra) and the group differences between the experimental (ExG) and control (CG) groups (ESinter); and (c) to assess post-speed, Δspeed, and ESintra among studies to compare TT to BWSTT relative to chronicity, duration of training, initial severity, and intensity of training.
Methods
Literature Search Methods
This systematic review is based on studies that were published from the establishment of the database through May 2012 and were selected after a computerized search strategy in the following databases: PubMed and CINAHL. The following Medical Subject Headings and CINAHL headings were used: (“stroke”) AND (“treadmill”) AND (“walking” OR “locomotion” OR “gait” OR “body weight support”). LIMITS: RCTs, English, and humans. The abstracts were screened by 2 independent reviewers (CCC and HSB), and in the case of disagreement the judgment of a third reviewer (MGB) was sought. Only studies that met inclusion criteria were selected and used for further analysis.
Eligible Studies
Inclusion criteria were the following: (a) All participants in the study were clinically diagnosed with stroke, whether they were ambulatory or nonambulatory and regardless of the time since stroke. (b) The studies selected and included were RCTs with parallel design. (c) People poststroke were randomly allocated to either treadmill training group (TT or BWSTT) or control group therapy, even if interventions were in addition to usual care. Studies that combined treadmill-based interventions with either a technological approach (eg, robotics, virtual environment), a behavioral therapeutic intervention (eg, Bobath training, etc), split-belt training, or stepping over obstacles were excluded. Mechanically assisted walking is beyond the scope of this review (for additional information on this subject, see Ada et al 9 ). (d) Studies measured over ground walking speed (WS), either SSWS or fastest walking speed (FWS), at pre- and postintervention. Studies that measured pre-speed and reported ΔSpeed were also included. Post-SSWS indicates the functional category (<0.4 m/s; 0.4 to 0.8 m/s; and >0.8 m/s) 7 to which the participant belongs, whereas ΔSpeed demonstrates the treatment gain or loss in WS.
Data Extraction and Analysis
Depending on the availability, sample demographics, design characteristics, intervention content, pre-speed, post-speed, and ΔSpeed were extracted from each study. For continuous data, both the mean and SD were extracted. Additionally, ESintra (the difference between the group mean pre-speed and post-speed divided by the SD of pre-speed) and ESinter (the difference of mean post-speed between ExG and CG divided by the pooled SD) were calculated to compare the intragroup and intergroup effects of treatment (small, <0.41; moderate, 0.41-0.70; or large, >0.70). 10 When applicable, follow-up speed measured at least 1 month after the completion of the intervention was also extracted, and the mean change in WS between follow-up speed and post-speed (ΔSpeedfu) was calculated.
The methodological quality of each study was assessed by the PEDro scale, using published guidelines. 11 All studies were assessed and graded from poor to excellent on the basis of the final score (poor, <4; fair, 4-5; good, 6-8; excellent, 9-10) independently by 2 researchers. The PRISMA (Preferred Reporting Items for Systematic Reviews and Meta-Analyses) guideline was used throughout the review. 12
Results
Flow of Studies through the Review
The search process identified 159 articles. After elimination of duplicates (n = 24), exclusion of irrelevant studies (n = 113), and screening for fit with the selection criteria (n = 7), 15 studies, which recruited 1139 participants, were included in this review (Figure 1). Of the 15 studies, nine13-21 were published prior to 2010 whereas the rest were published after 2010.
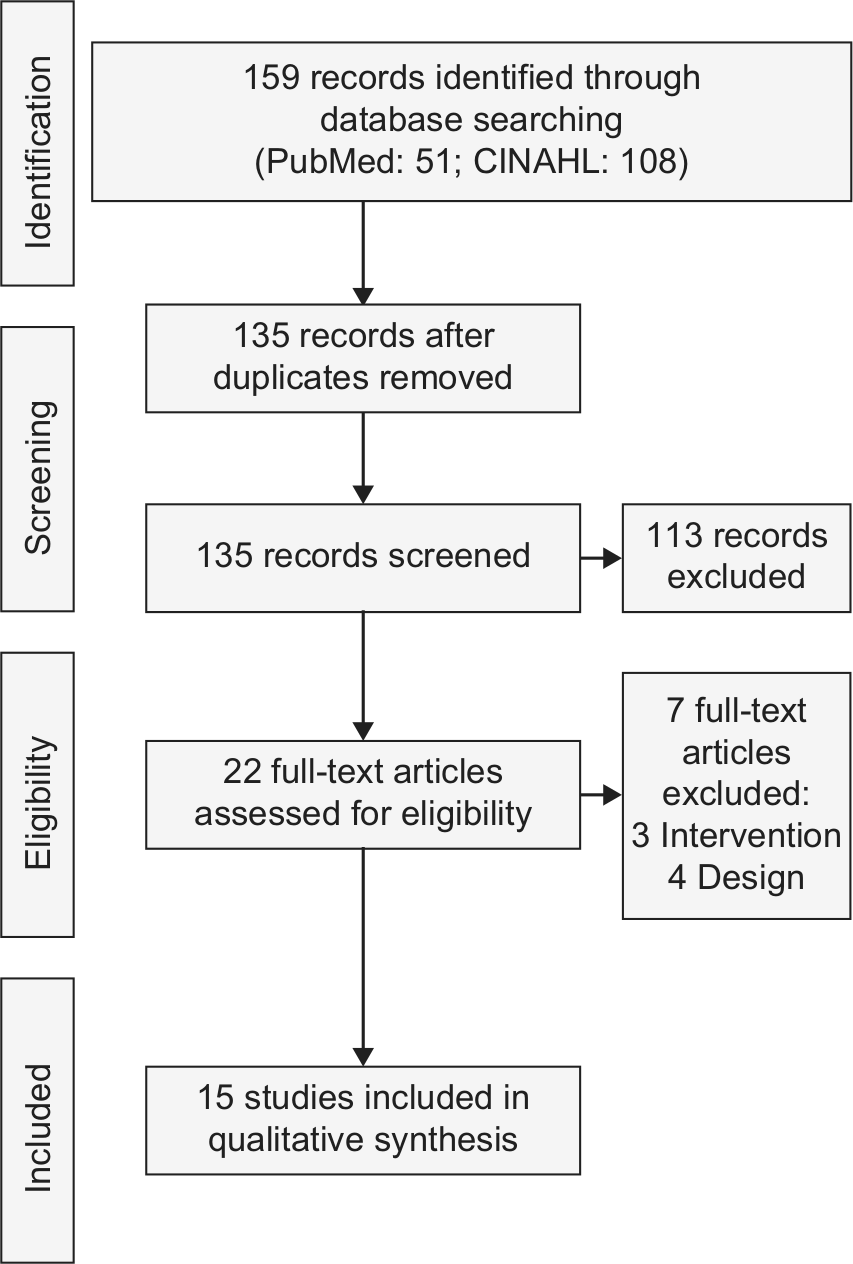
Flow of studies through the review.
The total PEDro score ranged from 5 (n = 2) to 8 (n = 4), with a mean of 6.9/10 and SD of 1.0. Of the 15 studies analyzed, no study rated excellent in methodological quality while all studies were rated good except 2 studies,18,21 which rated fair. The score in each criterion and summary of the methodological quality of each study analyzed are presented in Table 1.
Quality of included studies based on PEDro. a
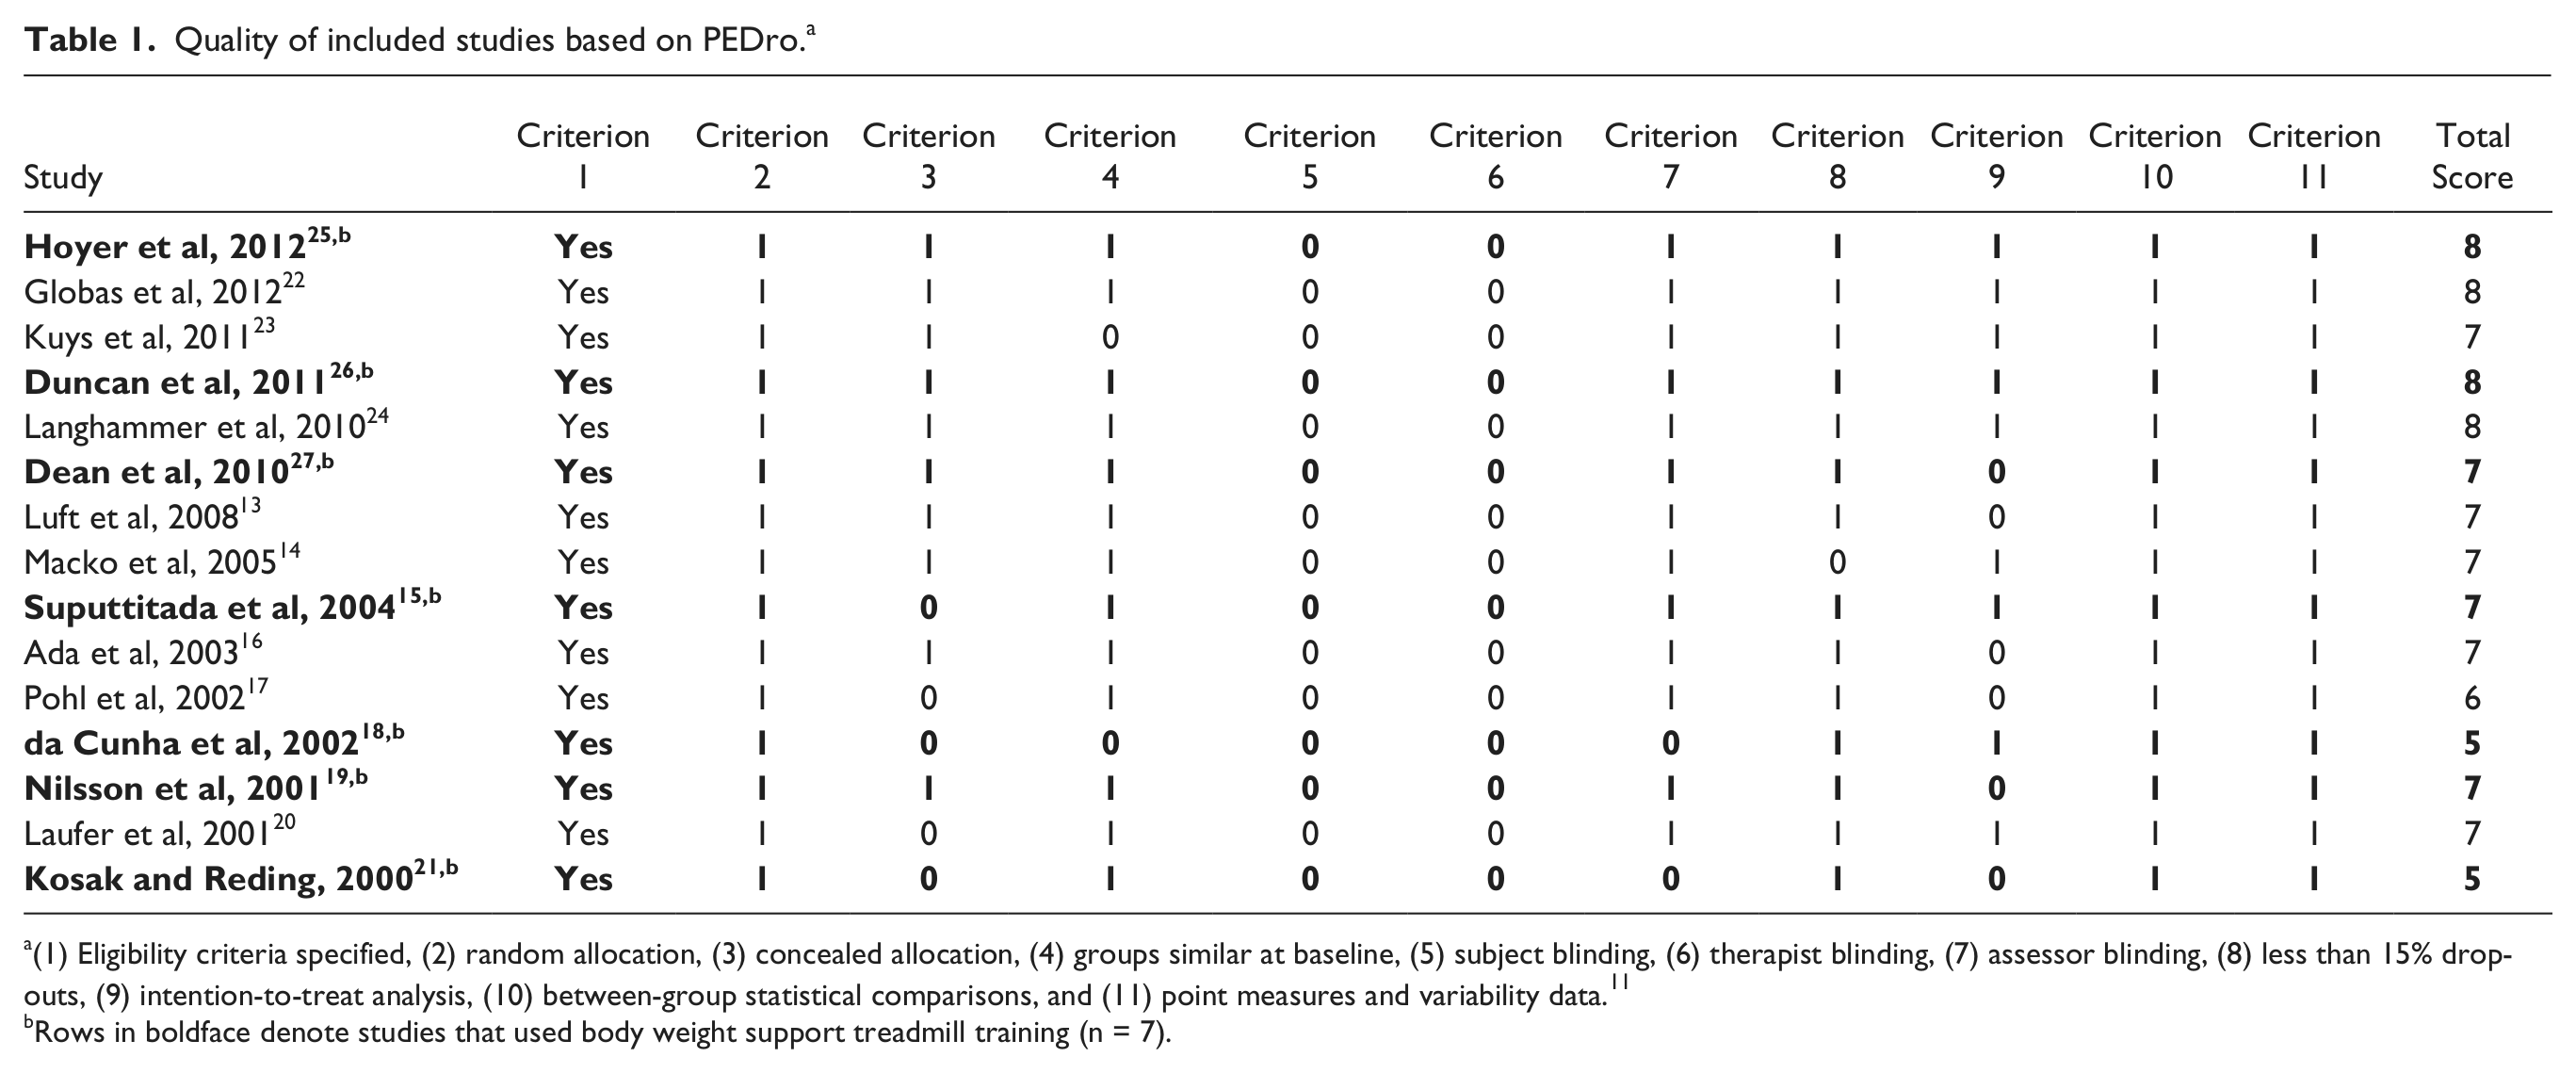
(1) Eligibility criteria specified, (2) random allocation, (3) concealed allocation, (4) groups similar at baseline, (5) subject blinding, (6) therapist blinding, (7) assessor blinding, (8) less than 15% dropouts, (9) intention-to-treat analysis, (10) between-group statistical comparisons, and (11) point measures and variability data. 11
Rows in boldface denote studies that used body weight support treadmill training (n = 7).
Participant Characteristics of Analyzed Studies
Number of participants recruited to each study and allocated to each arm ranged from 13 to 408 and from 7 to 143, respectively. Less than the half of the sample were females (43%), the mean age of the participants was 65 years (range = 52-75 years), and the mean time since stroke onset was 16 months (range = 0.5-70 months). Less than half of the participants had residual left paresis (44%). Within studies, there were no reported intergroup differences in participant characteristics. Detailed information about the characteristics of the participants in the analyzed studies is presented in Table 2.
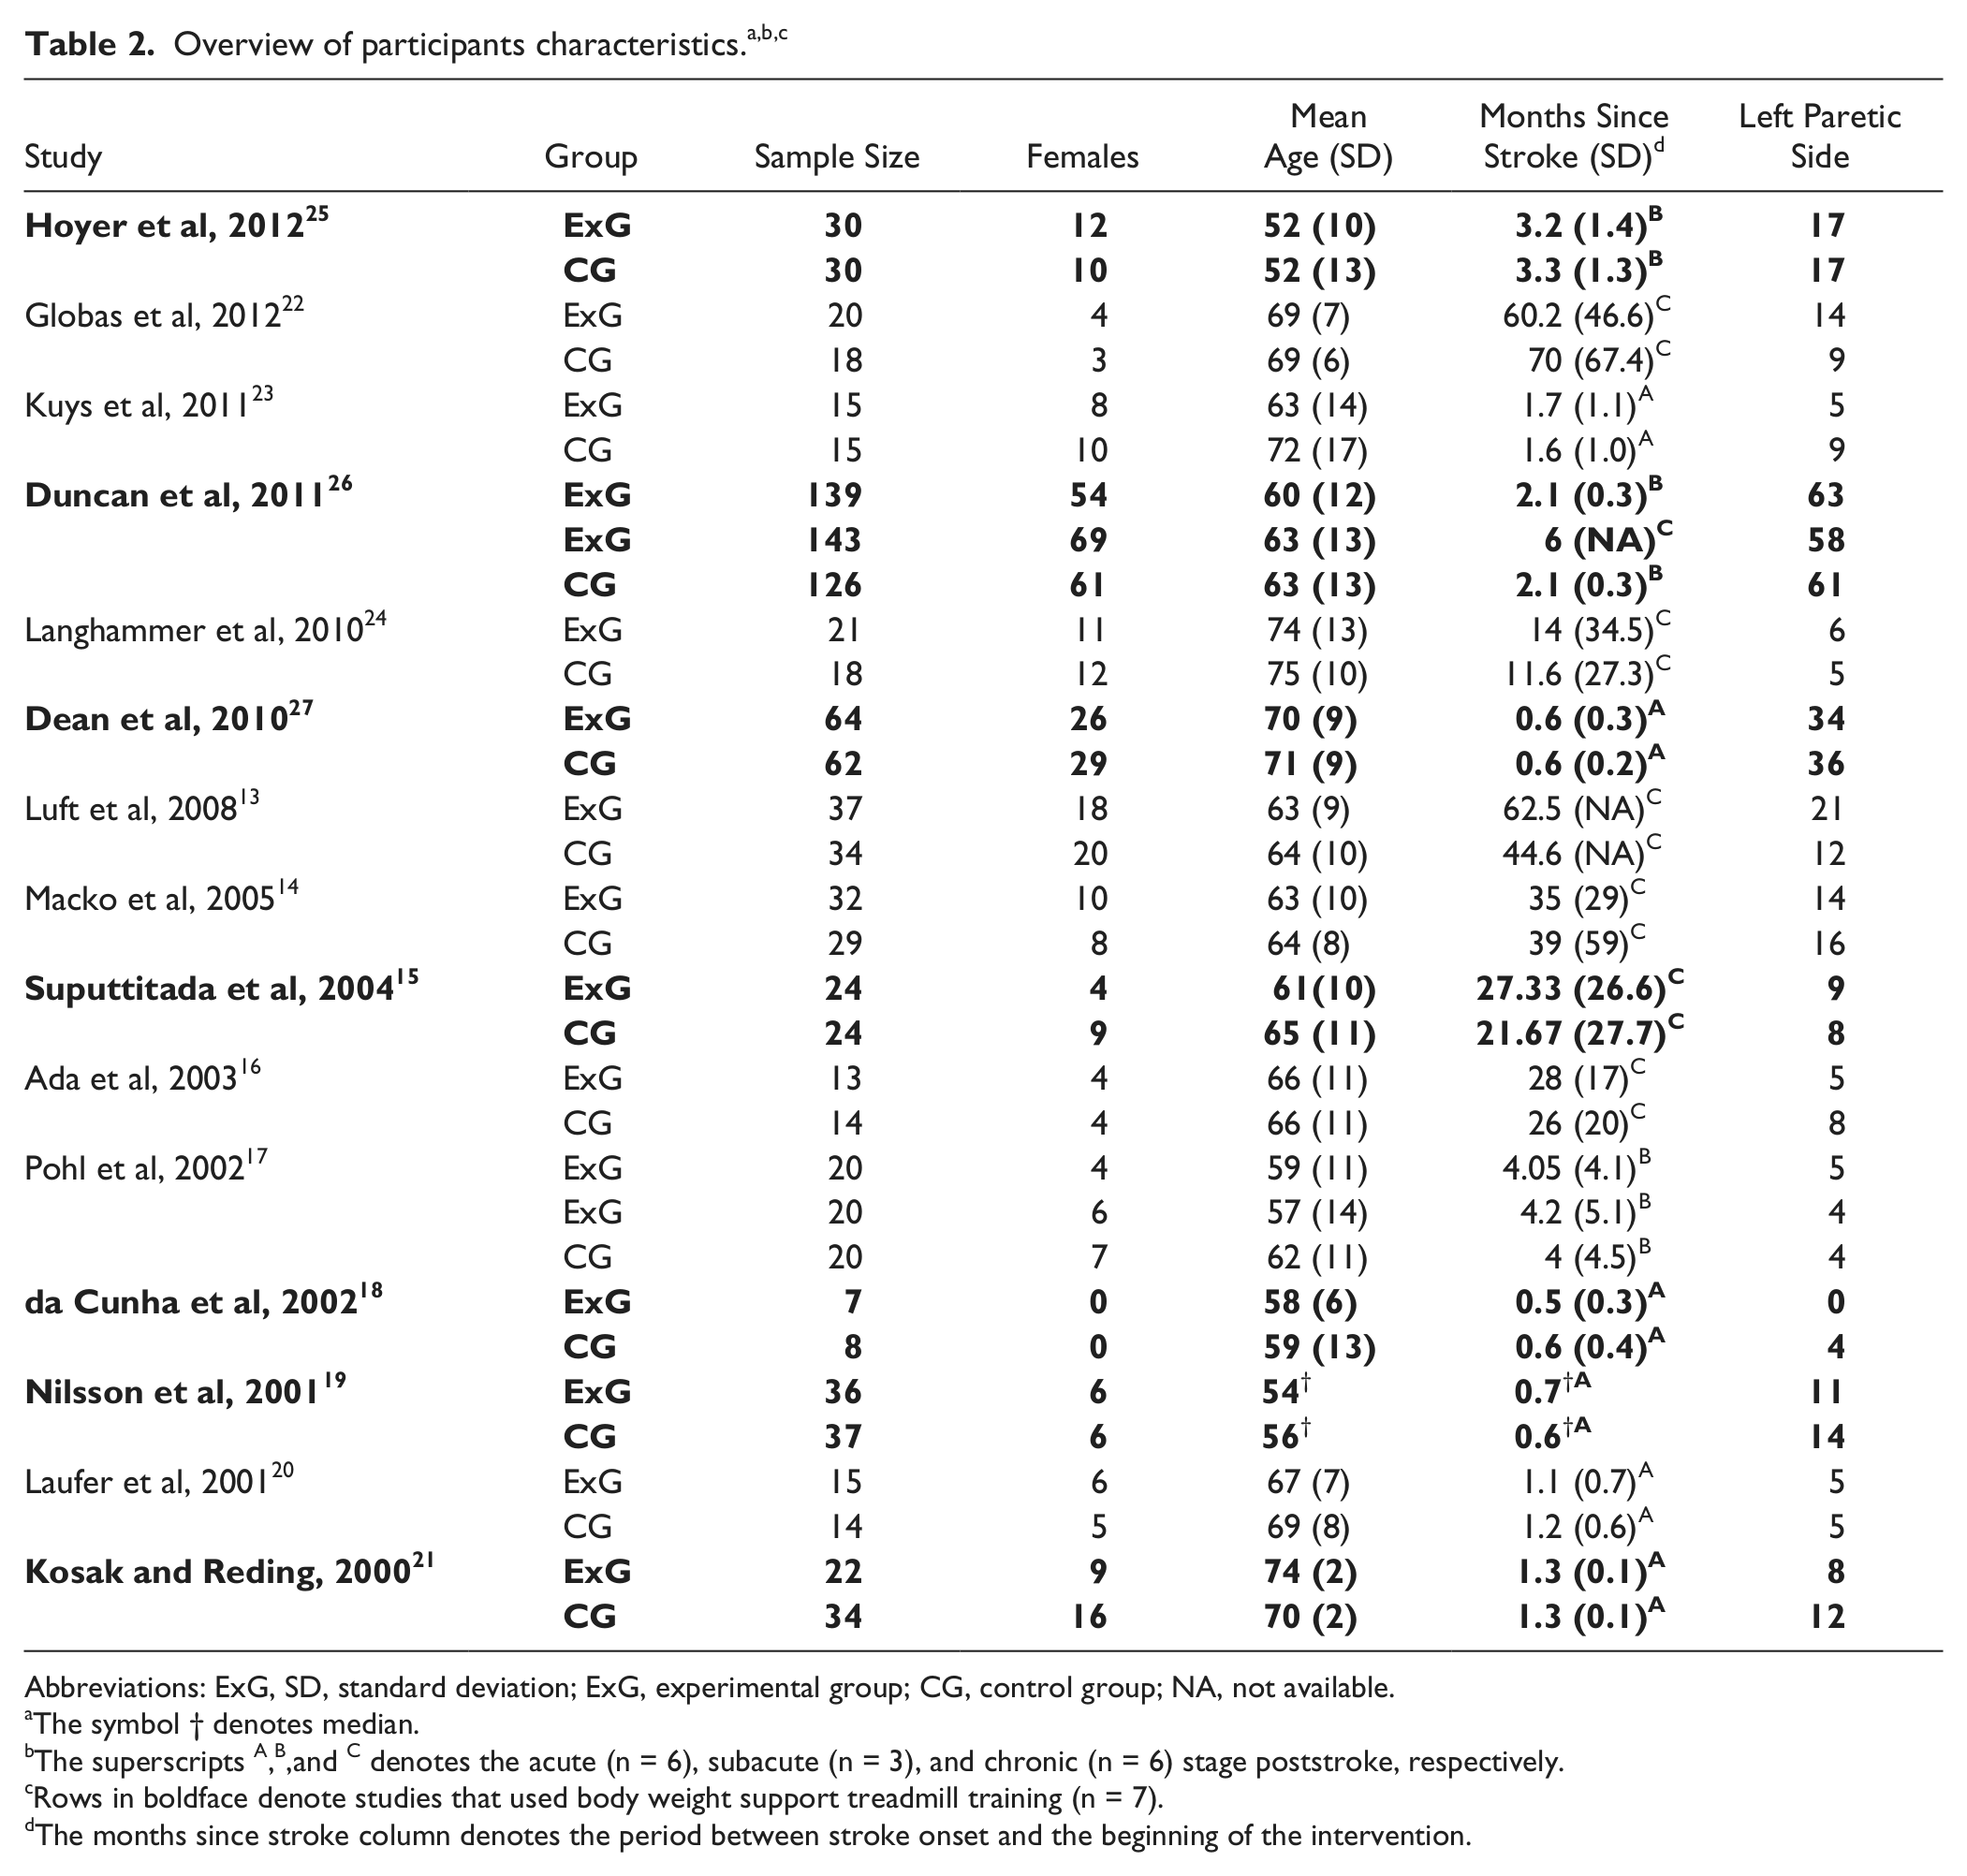
Abbreviations: ExG, SD, standard deviation; ExG, experimental group; CG, control group; NA, not available.
The symbol † denotes median.
The superscripts A,B,and C denotes the acute (n = 6), subacute (n = 3), and chronic (n = 6) stage poststroke, respectively.
Rows in boldface denote studies that used body weight support treadmill training (n = 7).
The months since stroke column denotes the period between stroke onset and the beginning of the intervention.
Training Interventions and their Components
The sample had a total of 32 groups (17 ExG; 15 CG). ExG in 8 studies received TT,13,14,16,17,20,22-24 and the remaining received BWSTT.15,18,19,21,25-27 Conversely, CG received various interventions such as home exercise programs, over ground walking, and unspecified “conventional gait training.”
The duration of each single session varied across studies (20-90 minutes), while the frequency (ie, sessions per week) ranged from 1 to 5. Of the 15, 7 studies15-18,20,21,24 trained their participants for less than 4 weeks, while Dean et al 27 trained their participants not until a fixed endpoint, but until independent walking was achieved. Whereas the total number of sessions varied across studies, the total sessions and training compliance (attended sessions/planned sessions) did not differ between groups. All interventions incorporating BWSTT used some degree of manual assistance when walking on the treadmill. An overview of the training interventions and their components used in each study is presented in Table 3.
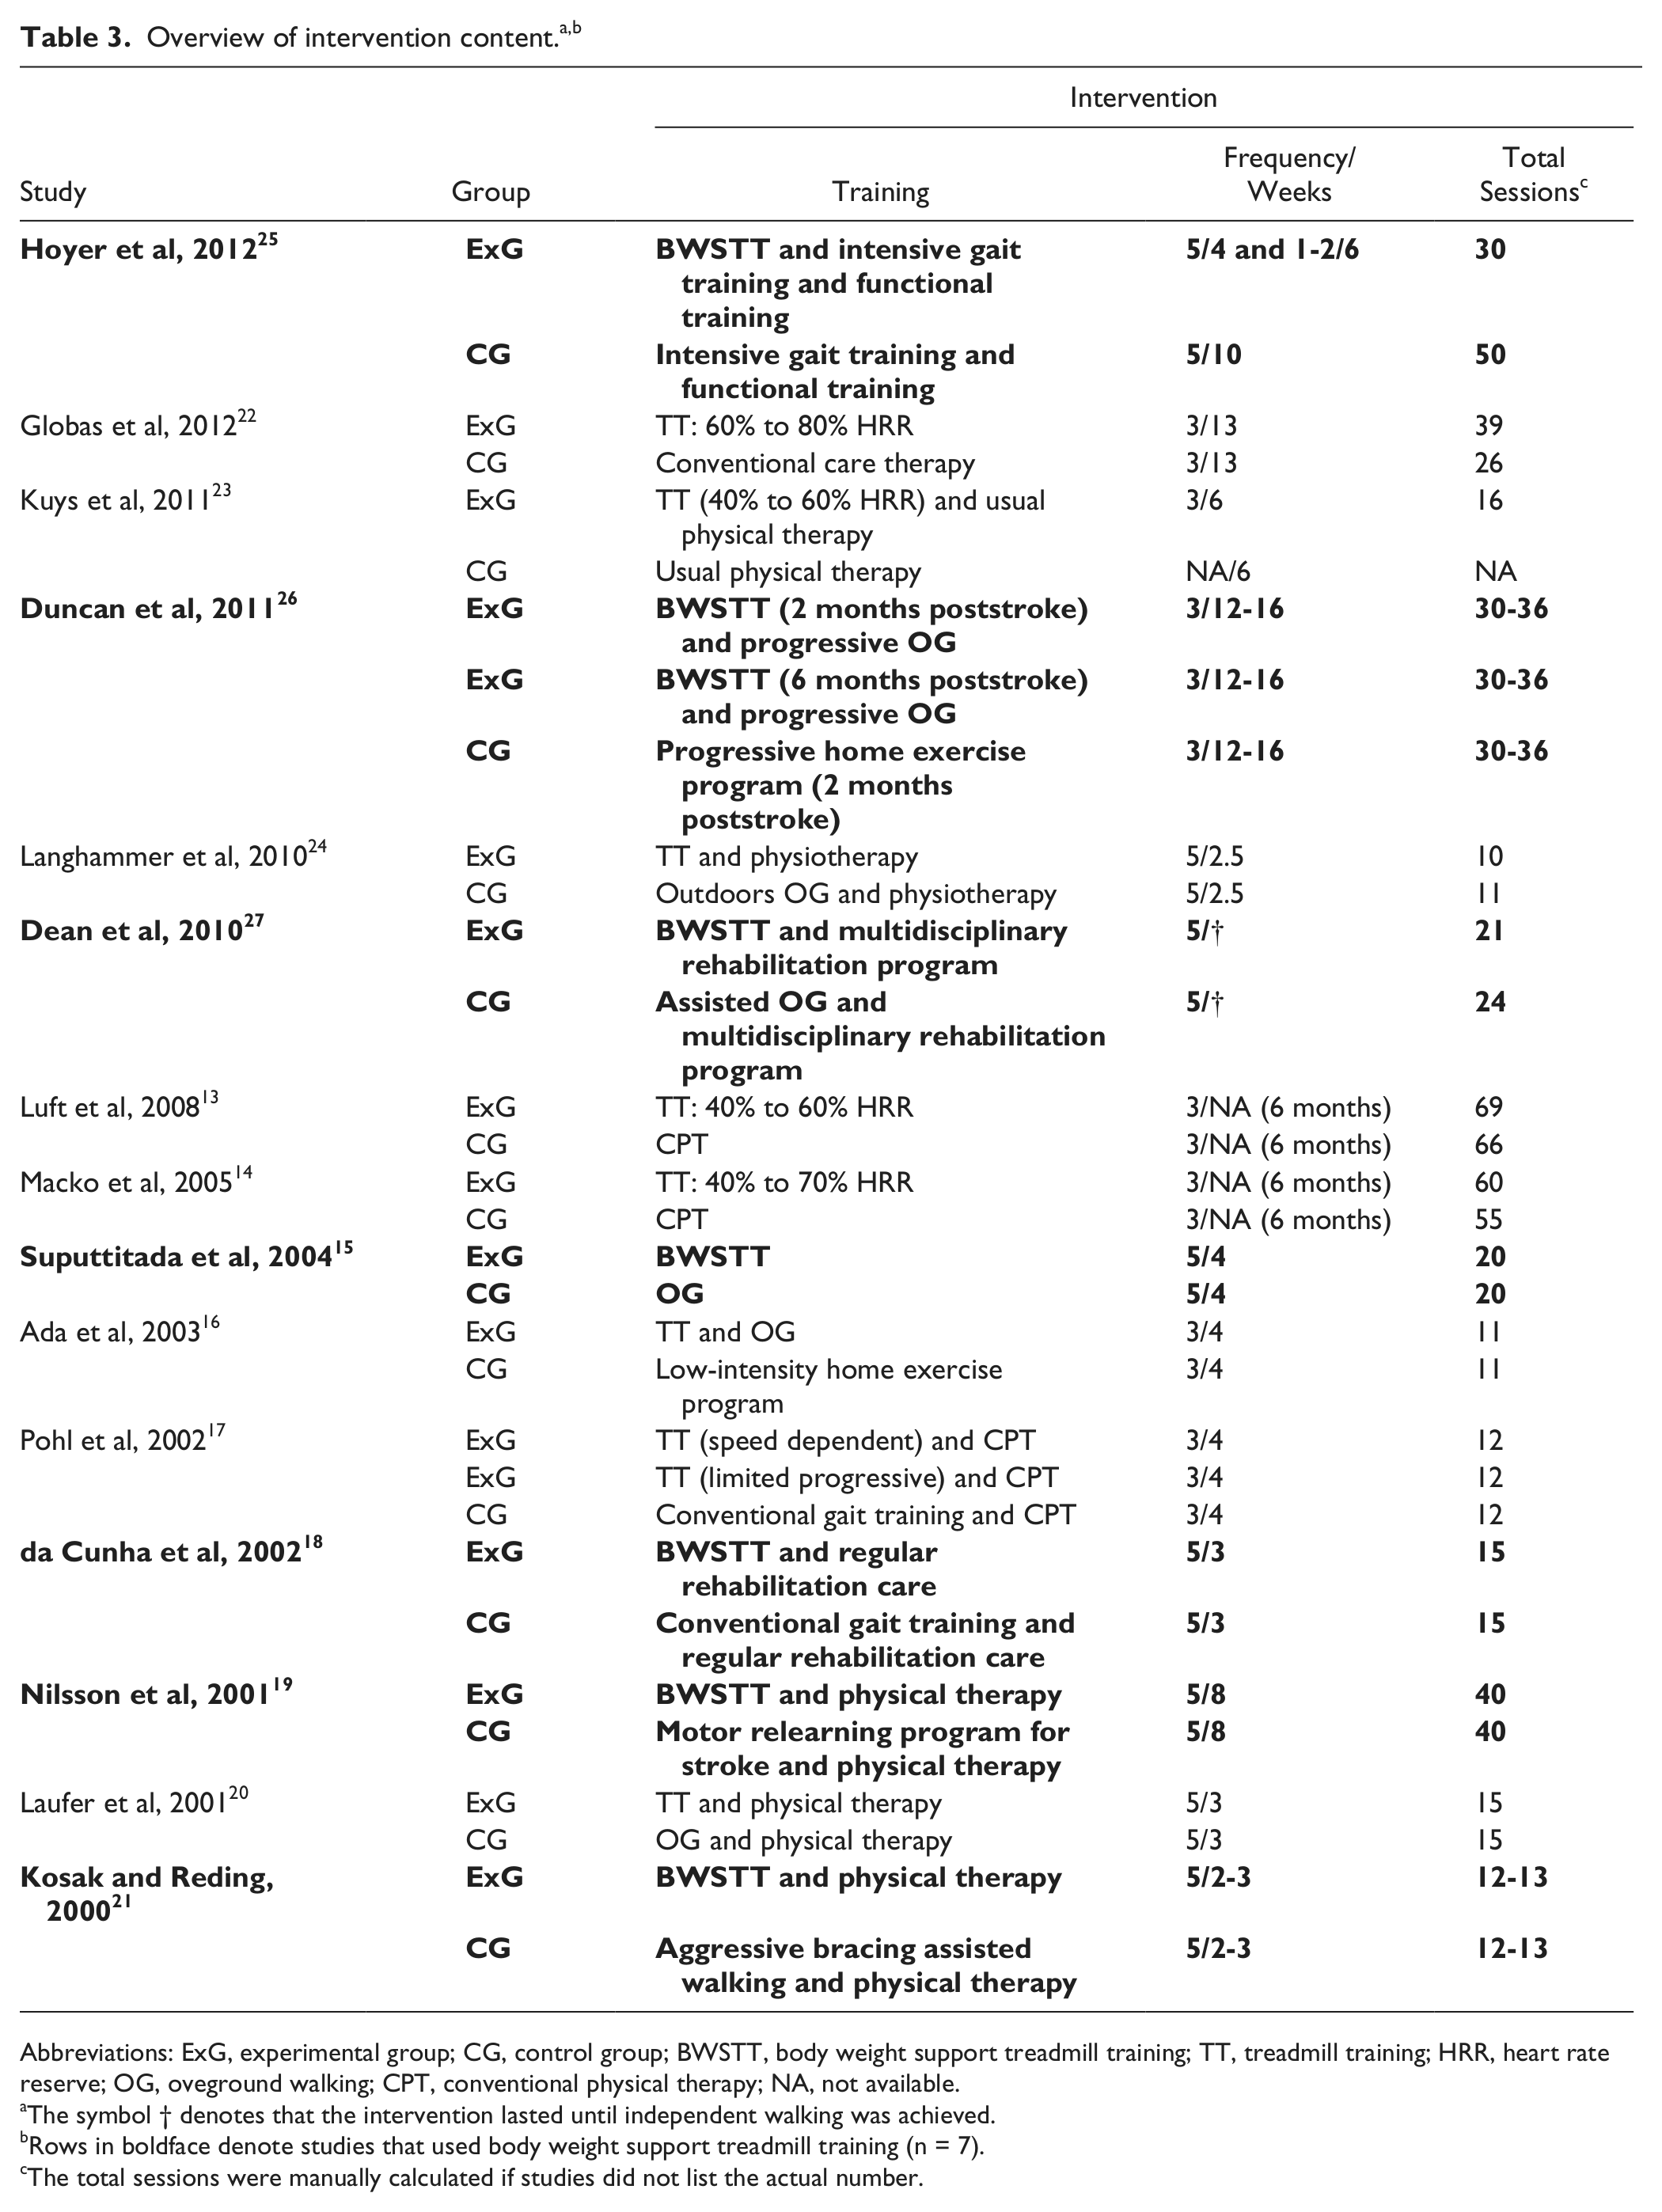
Abbreviations: ExG, experimental group; CG, control group; BWSTT, body weight support treadmill training; TT, treadmill training; HRR, heart rate reserve; OG, oveground walking; CPT, conventional physical therapy; NA, not available.
The symbol † denotes that the intervention lasted until independent walking was achieved.
Rows in boldface denote studies that used body weight support treadmill training (n = 7).
The total sessions were manually calculated if studies did not list the actual number.
Walking Speed Outcomes
All studies measured and reported either the SSWS (n = 10) or FWS (n = 5). Each group’s mean pre-speed (n = 14) and post-speed (n = 15) were reported while ΔSpeed (n = 14) was calculated. Since the sample size across studies varied, and some studies might contribute more than other studies, the weighted mean (by sample size) for all 3 outcomes of each group is presented. The weighted mean pre-speed was 0.47 m/s for ExG (TT: 0.62 m/s; BWSTT: 0.40 m/s) and 0.23 m/s for CG. The weighted mean post-speed was 0.67 for ExG (TT: 0.92 m/s; BWSTT: 0.57 m/s) and 0.57 m/s for CG, while the weighted mean ΔSpeed was 0.22 m/s for ExG (TT: 0.29 m/s; BWSTT: 0.19 m/s) and 0.16 m/s for CG. Participants accomplished a transition to a higher functional category 7 by the end of the intervention in 2 studies23,26 (ExG: 1 TT and 1 BWSTT; CG: 1), and their treatment gain was greater than 0.16 m/s (ie, minimal clinically important difference in SSWS; MCID) 28 in 4 studies19,23,24,26 (ExG: 2 TT and 2 BWSTT; CG: 2). Detailed descriptions of WS-related outcomes are presented in Table 4.
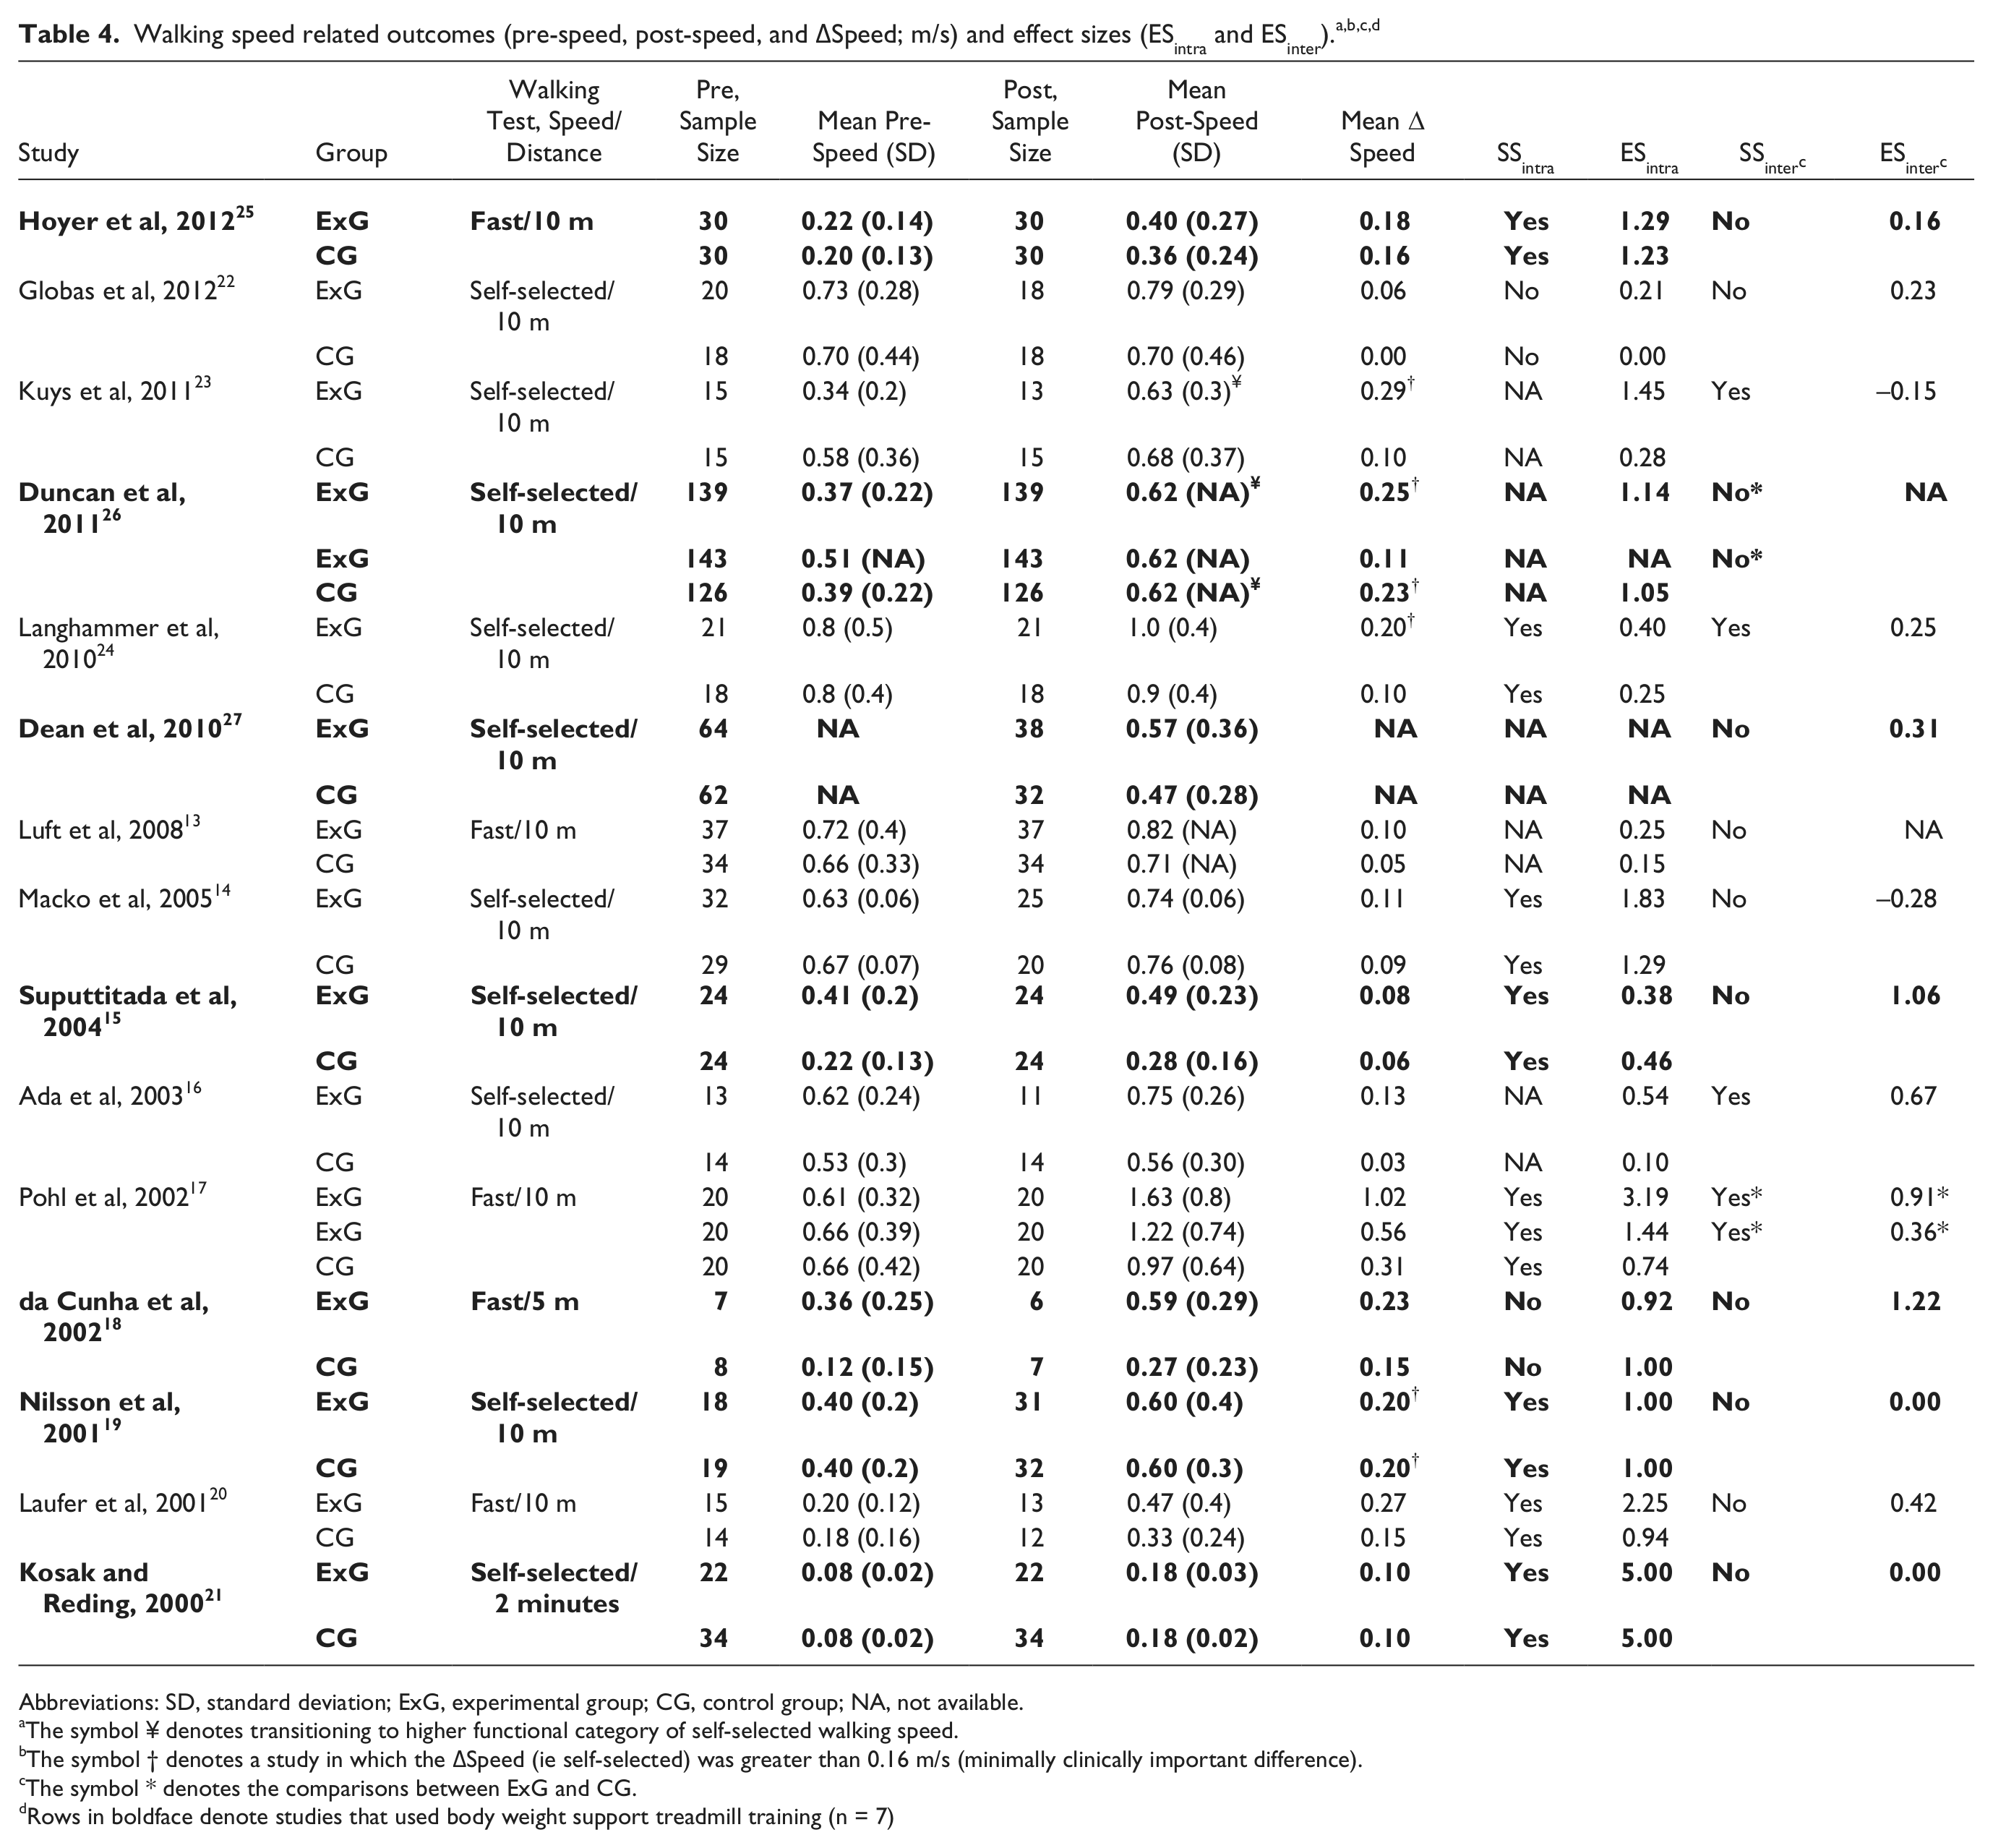
Abbreviations: SD, standard deviation; ExG, experimental group; CG, control group; NA, not available.
The symbol ¥ denotes transitioning to higher functional category of self-selected walking speed.
The symbol † denotes a study in which the ΔSpeed (ie self-selected) was greater than 0.16 m/s (minimally clinically important difference).
The symbol * denotes the comparisons between ExG and CG.
Rows in boldface denote studies that used body weight support treadmill training (n = 7)
Intragroup and Intergroup Statistics
Of the 15 studies, only 10 studies reported intragroup statistical results and 8 studies14,15,17,19-21,24,25 found statistically significant intragroup differences in both groups (ExG: 4 TT and 4 BWSTT; CG: 8), demonstrating that individuals statistically improved from baseline as a result of the intervention. In those studies, ΔSpeed ranged from 0.08 to 1.02 m/s in ExG and from 0.06 to 0.31 m/s in CG. In the 5 studies13,16,23,26,27 for which intragroup comparisons were not reported, the ΔSpeed ranged from 0.13 to 0.29 m/s in ExG and from 0.03 to 0.23 m/s in CG.
All studies reported intergroup statistical results, yet only 4 studies16,17,23,24 found statistical significance indicating superiority of treadmill-based interventions. All 4 studies used TT as the ExG: post-speed ranged from 0.63 to 1.62 m/s in ExG and from 0.56 to 0.97 m/s in CG; and ΔSpeed ranged from 0.13 to 1.02 m/s in ExG and from 0.03 to 0.31 m/s in CG. No studies examining BWSTT found superiority over the control group therapies. Intragroup and intergroup statistical significances are presented in Table 4.
Intragroup and Intergroup Effect Sizes
The ESintra and ESinter were not calculated for all studies, but were calculated when possible. ESintra could not be calculated from Dean el al 27 because the pre-speed was not reported, whereas ESinter was not calculated for 2 studies13,26 because the post-speed SD was not reported.
Most ESintra, which ranged from 0.21 to 5 in ExG and from 0 to 5 in CG, were large (ExG: 5 TT and 5 BWSTT; CG: 8) while the rest were either moderate (ExG: 1 TT; CG: 1) or small (ExG: 3 TT and 1 BWSTT; CG: 5). In six14,17,19-21,25 of the 8 studies that showed significant intragroup differences, the ESintra was large, with the remaining studies15,24 demonstrating small (ExG: 2; CG: 1) and moderate (CG: 1) ESintra. In the 2 studies that showed no significant intragroup differences, the ESintra was large 18 and small, 22 respectively. Studies13,16,23,26 that did not report intragroup differences demonstrated both large (ExG: 2; CG: 1) and small (ExG: 1; CG: 2) ESintra. On the contrary, ESinter were typically either small14,17,19,21-25,27 or moderate16,20 and ranged from −0.15 to 1.24. Three studies15,17,18 had large ESintra, yet only one 17 of them reported significant intergroup difference. Detailed description of the ESintra and ESinter is presented in Table 4.
Retention of Walking Speed
Of the 15 studies, only 4 studies (2 TT and 2 BWSTT) reported the self-selected follow-up-speed after 3 months,16,23 9 months, 26 and 10 months. 19 In 3 of the 4 studies, ExG16,19,23 and CG16,19,26 follow-up-speed was higher than the post-speed while in the fourth ExG 26 and CG 23 speed decreased by 0.02 m/s. Information about the follow-up test is presented in Table 5.
Walking speed related outcomes (Follow-up-speed and ΔSpeedfu; m/s) of studies which examined the retention of walking speed at least 1 month after the cessation of the intervention. a
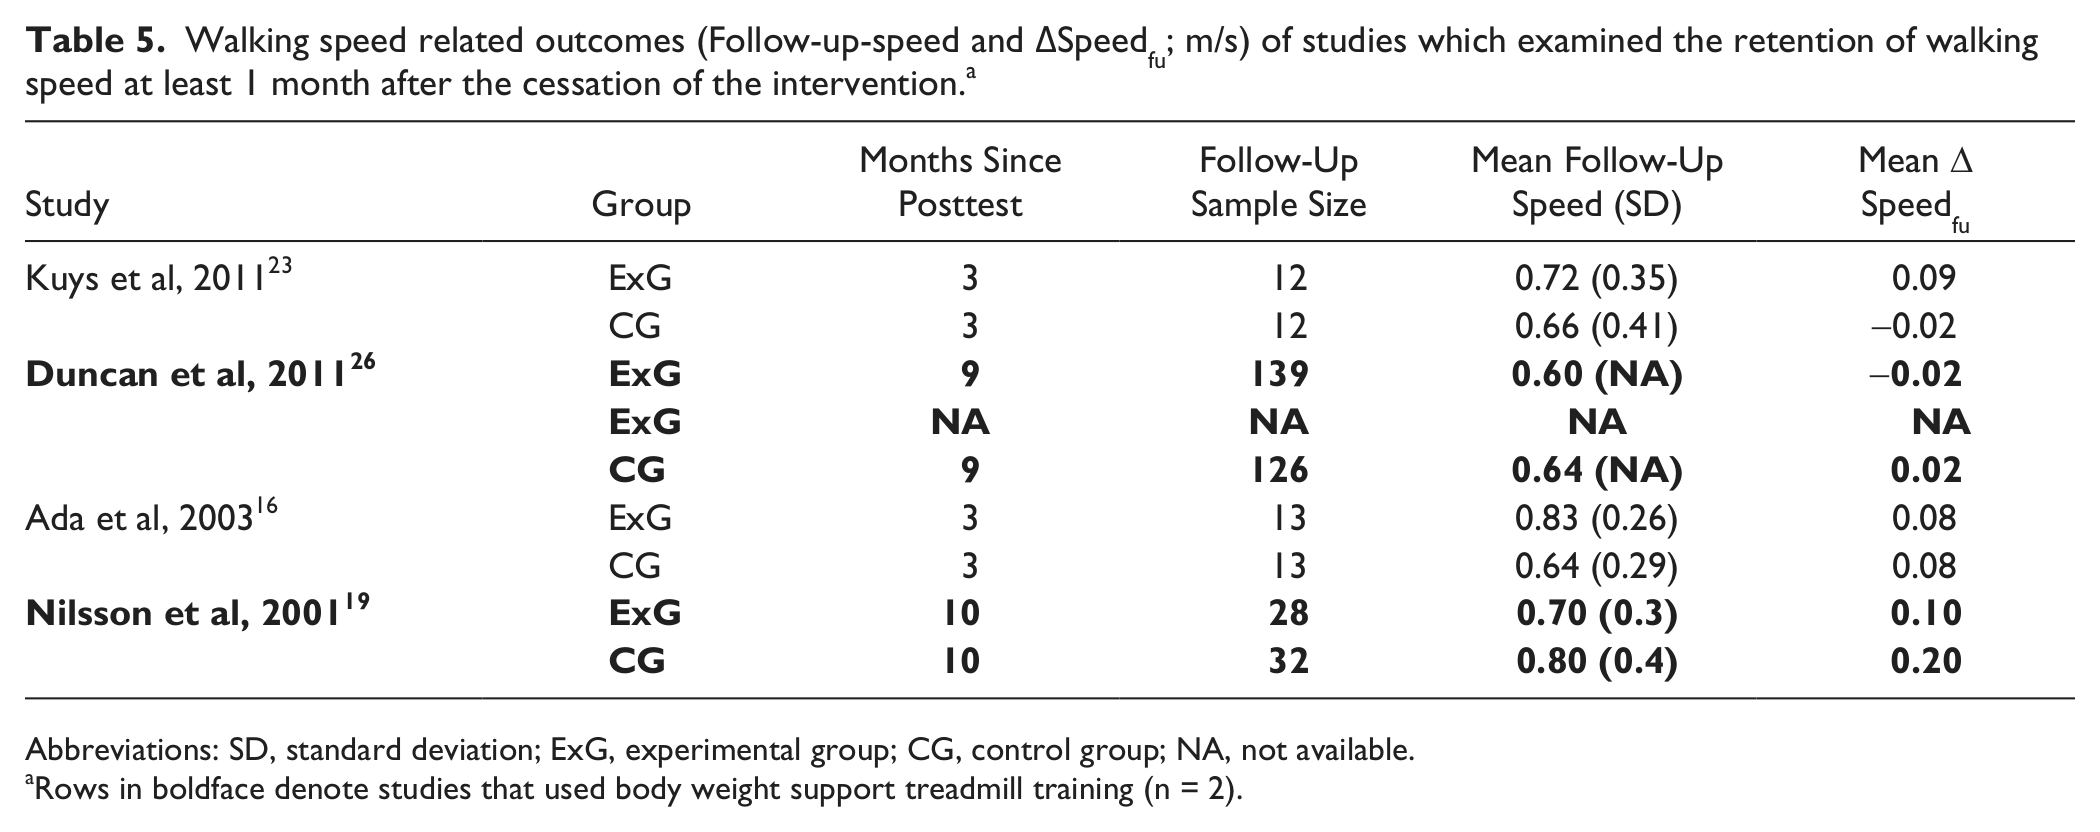
Abbreviations: SD, standard deviation; ExG, experimental group; CG, control group; NA, not available.
Rows in boldface denote studies that used body weight support treadmill training (n = 2).
Comparisons Between Treadmill-Based Interventions
No statistics were performed to compare the ExG between TT and BWSTT, but the comparisons are graphically presented for the post-speed, the ΔSpeed, and the ESintra (Figure 2). Data are stratified by chronicity (time since stroke onset at the beginning of the intervention), duration of training (mean total number of sessions), initial severity (baseline SSWS for the 10 studies that measured SSWS), and intensity of training (final speed of treadmill). TT interventions demonstrated a pattern of improved outcomes of post-speed, ΔSpeed, and ESintra for interventions as a whole (Figure 2A), in those who were <6 months poststroke (Figure 2B), and those who received less than 15 sessions (Figure 2C). No clear patterns emerged from plots of initial severity (Figure 2D). Additionally, those in the TT interventions training at fast speeds performed very well, but there were only 2 studies and no comparison were made to BWSTT interventions (Figure 2E). Note that one BWSTT intervention had a very large ESintra (5.00), 21 but this reflects a very small standard deviation (0.02 m/s) and change in speed that did not reach the MCID (0.10 m/s).
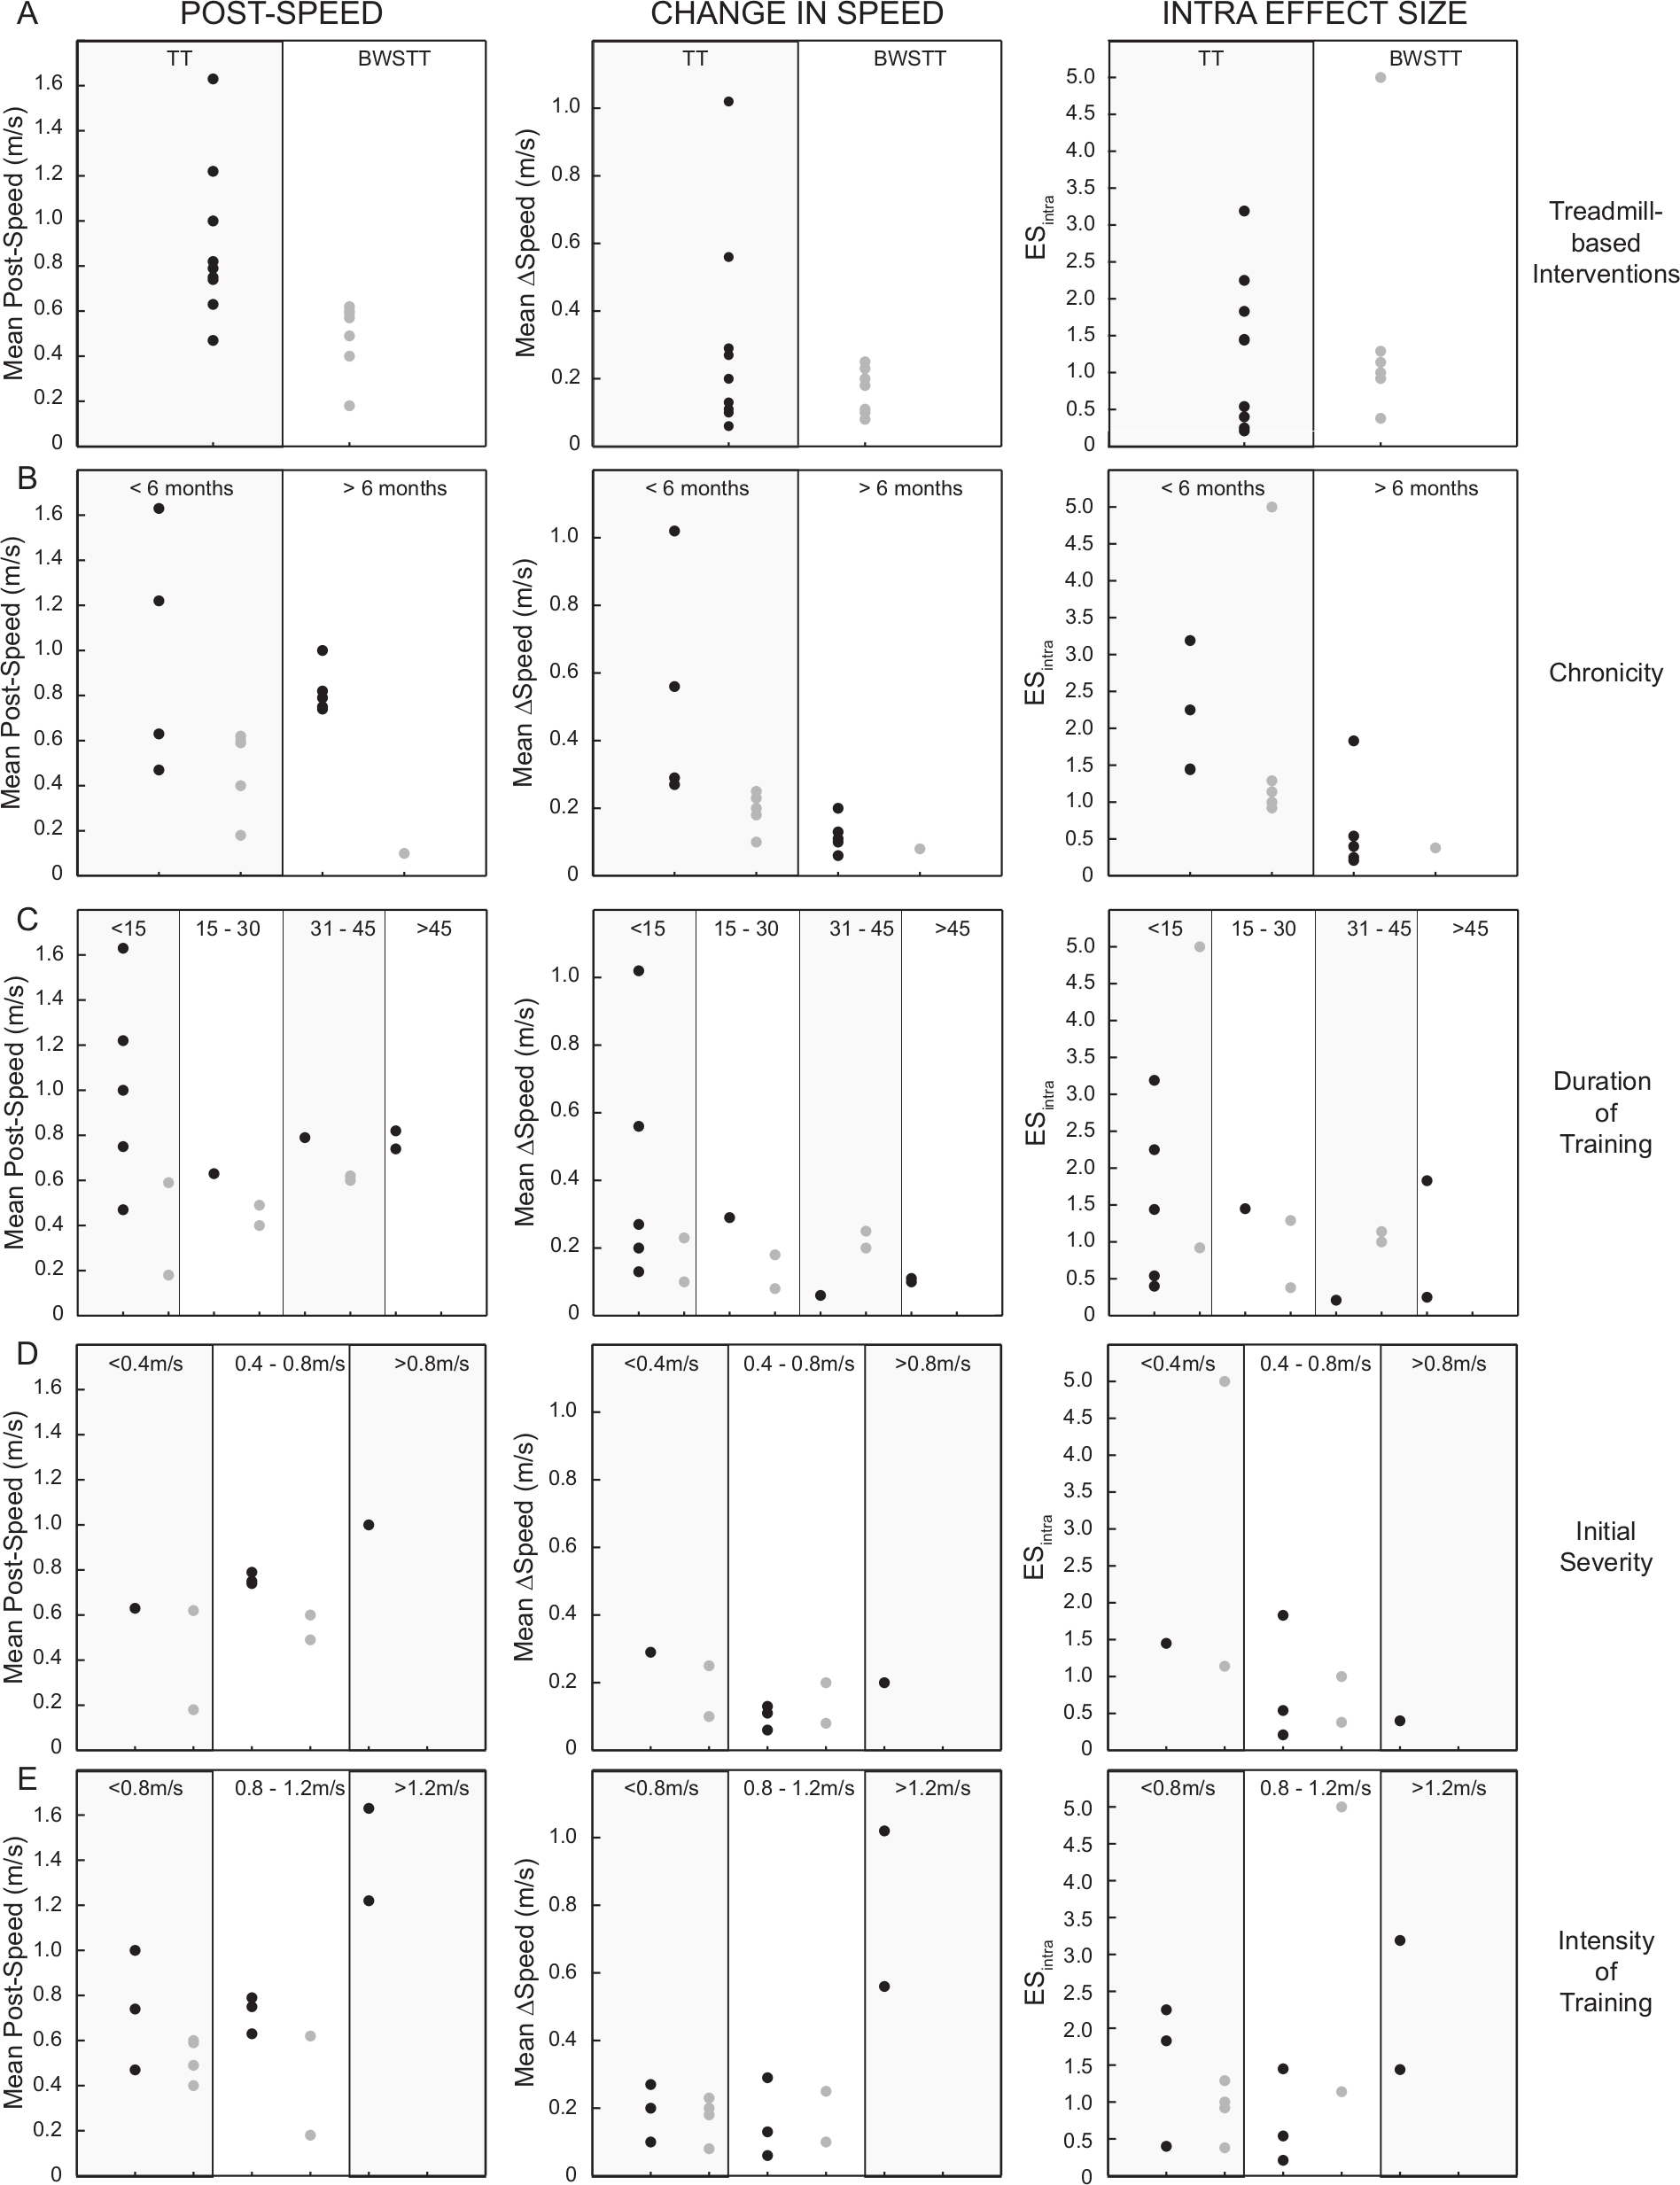
Post-speed (left column), change in speed (middle column), and intra effect size (right column) patterns among (A) the experimental groups as a whole, treadmill training (TT; black dots) and body weight support treadmill training (BWSTT; dark gray dots), as well as stratified relative to (B) chronicity (time since stroke in months), (C) duration of training (number of sessions), (D) initial severity (baseline SSWS), and (E) intensity of training (treadmill speed during training sessions).
Discussion
This review aimed to describe the effect of treadmill-based interventions for improving WS poststroke. After reviewing 15 studies, results revealed that in more than half of the studies, treadmill-based interventions poststroke significantly improved WS outcomes (post-speed and ΔSpeed), but when compared to control group therapies only 4 studies showed superiority of treadmill-based interventions (all TT interventions). In terms of clinical meaningfulness, few studies demonstrated the ability of treadmill interventions to facilitate transitions to higher functional category or reach MCID in SSWS. The ESintra of most studies were large but only 3 studies had large ESinter. The studies that measured follow-up speed demonstrated that WS gained due to the intervention, either treadmill related or control, was retained. In terms of statistical significance and clinical meaningfulness, these findings conclude that treadmill-based interventions are at least as effective as other walking training approaches for improving WS in people poststroke.
Implementation of TT or BWSTT poststroke can be an efficacious approach for improving WS, yet this and other reviews5,6 suggest that it is not superior to other commonly used behavioral rehabilitation strategies. In ExG, the weighted mean post-speed was 0.67 m/s, whereas in CG the respective post-speed was 0.57 m/s. Similarly, the weighted mean gain is larger in the ExG compared to the CG (0.22 m/s to 0.16 m/s); however, excluding the very large changes seen in the Pohl et al study, 17 the values change to 0.18 m/s and 0.15 m/s, respectively. These data indicate that people poststroke in either group responded with increases in SSWS to structured, progressive interventions. While transition to higher functional category was accomplished in ExG in 2 studies23,26 only Duncan et al 26 reported that the CG mean transitioned to higher functional category. Additionally, in the 4 studies19,23,24,26 in which the mean participant either reached or passed the MCID in ExG, only half19,26 reported a ΔSpeed greater than 0.16 m/s in CG. In the 2 studies23,26 in which ExG interventions promoted both transition to higher functional category and mean WS changes exceeding the MCID, only the CG in the Duncan et al 26 study resulted in these changes.
While no statement can be made regarding the superiority of TT over BWSTT with regard to walking speed–related outcomes, clear patterns emerge when comparing the post-speed, ΔSpeed, and ESintra overall and when stratified according to chronicity, duration of training, and intensity of training. Additional work is required to examine a spectrum of outcome measures to make a definitive comparison. However, if increases in walking speed are the desired outcome of an intervention, it may be that fewer sessions of intensely focused repetitive stepping on a treadmill without body weight support or physical assistance may be sufficient, particularly in patients with subacute stroke training at fast walking speeds.
This review only addresses the outcome of walking speed, and no interpretation may be made regarding the quality or coordination of movement. It may be argued that BWSTT is designed to improve the kinematic patterns of walking through aided normalization of movement. 29 However, there are no systematic outcome measures routinely applied to clinical trials of walking rehabilitation to be able to make statements regarding the quality of the movement. The lack of universal superiority for treadmill interventions over other approaches can possibly be explained because WS improvements may occur due to a variety of recovery mechanisms. Interpretations of future interventions should consider not only the behavioral endpoints of the outcome measures but also the underlying mechanisms of functional recovery that can be identified by using the appropriate measurement tools. 30
Both intragroup and intergroup statistics and ES added quantitative evidence that treadmill interventions can increase WS in people poststroke, yet both confirmed the lack of the universal superiority of treadmill interventions to control group therapies. While more than half of the studies reported significant intragroup differences, only 4 studies that used TT found significant intergroup difference. Similarly, the majority of the studies had large ESintra, yet only 3 had large ESinter. The ESintra and ESinter confirmed the reported statistical results for the majority of studies, but there were few exceptions.17,18,20,23,24 For example, da Cunha et al 18 found neither significant intragroup nor intergroup differences, but both ESintra (ExG: 0.92; CG: 1.00) and ESinter (1.22) were large. Other examples are the Pohl et al 17 and Laufer et al 20 studies, which had moderate ESinter (0.36 and 0.42, respectively), but only the former 17 reported a significant intergroup difference. Furthermore, among the 3 studies15,17,18 that had large ESinter, only Pohl et al 17 found significant intergroup difference (ie, superiority of speed-dependent TT). A possible explanation for these conflicts between statistical findings and the ES is the small sample size in each group, which limits the ability to detect statistical differences. Calculations of the ES are illustrative in that they provide additional evidence for interpreting the reported results and allow for direct comparison between studies. 31
Retention of rehabilitation gains is critical in establishing ecological validity of an intervention, but unfortunately, only 4 studies16,19,23,26 measured the follow-up-speed, and the duration of follow-up testing varied among studies (3-10 months). These results demonstrated that people poststroke who receive treadmill training for a period of 4 to 16 weeks can retain the SSWS gains up to 10 months (weighted mean of follow-up speed and ΔSpeedfu was 0.64 m/s and 0.01 m/s, respectively), but is inconclusive because of the small number of studies and variability of the retest period. Similarly, WS gains due to control group therapies can be also retained (weighted mean of follow-up speed and ΔSpeedfu was 0.67 m/s and 0.05 m/s, respectively).
The superiority of a rehabilitation approach is determined by the presence of statistical significance, yet the clinical decision about a specific rehabilitation approach may also be guided by 3 pragmatic factors: safety, cost, and ease of the treatment’s delivery. Studies analyzed in this review did not report any information about the last 2 factors, whereas only 4 studies reported safety data such as adverse events and falls. Globas et al 22 and Kuys et al 23 reported no treatment-related serious adverse events and 2 falls without injury (ExG). In Dean et al, 27 the mean number of falls was similar between the 2 groups. In Duncan et al, 26 adverse events and multiple falls in patients with moderate walking impairment at baseline were similar across groups, yet multiple falls in patients with severe impairment at baseline in the early BWSTT occurred more frequently than in patients allocated to the other 2 groups. Overall, these limited reports are insufficient to definitively assess the differential safety factors between treadmill-based interventions and control group therapies.
This review is novel from previous reviews,5,6 which investigated a similar topic of the effects of rehabilitation interventions on WS. First, only RCTs were included. Analyzing and interpreting results only from RCTs strengthens the outcome of this review. Second, both post-speed and ΔSpeed were reported and analyzed. Measuring and reporting information from both outcomes can inform clinical decision making and guide future walking-specific rehabilitation interventions. Third, ESintra and ESinter were calculated allowing direct comparisons within and between studies and providing additional statistical analyses to the significance testing. ESintra testing was particularly beneficial in comparing within-group treatment effects for both ExG and CG therapies, which were not often reported in the primary publications. Fourth, the follow-up speed and ΔSpeedfu were extracted and calculated when either outcome was measured and reported in a study. While follow-up speed identified the functional ambulation category at follow-up, ΔSpeedfu determined the amount of retention. Fifth, serious adverse events and falls were reported to examine if either approach is safer than the other.
The present review contains some potential limitations that should be considered when interpreting the findings. Though strict criteria and guidelines were used for selecting and screening the studies, certain parameters of the sample used in this review varied. First, the test used for measuring WS across times differed slightly among studies. Ten studies14-16,19,21-24,26,27 measured SSWS while the rest measured FWS. All studies except one measured WS by using the 10-meter walking test, while Kosak and Reding 21 measured WS as calculated during the 2-minute walking test. Second, there was tremendous variability in the total sessions (range 10-69) and intensity (ie, training speed manipulation in one study only) 17 across studies. Nevertheless, almost all studies9,17,18,20,24 with 15 total sessions or less had ES similar to those studies with more total sessions. Similarly, the Pohl et al study, 17 in which intensity was manipulated by the training speed, had ES similar to those studies in which intensity was not manipulated by the training speed. Thus, the interstudy variability might not skew the overall results.
The main outcomes of this review suggest 3 themes that future work should consider. First, further and detailed analysis of the adverse events caused by the treadmill interventions and control treatments should be completed to determine which approach is safer. Second, a cost-effectiveness analysis should be conducted to determine which approach, treadmill training interventions or control group therapies, is cost-effective. Last, future work in walking-specific rehabilitation needs to take into consideration the mechanisms by which people poststroke improve and retain WS so that treatment programs can be tailored to patient-centered deficits.
In conclusion, this systematic review showed that treadmill-based interventions can improve functional outcomes of WS and its retention in people poststroke, but their universal superiority to other control group therapies again has failed to be established. Also, recordings of the post-speed and treatment gains are equally important regardless of the treatment as they can guide clinical decision making while simultaneous use of ES can assist in better interpretation of a treatment’s effectiveness. Finally, measuring follow-up speed may elucidate the process of walking-specific motor learning.
Footnotes
Acknowledgements
The authors would like to thank Lindsay Perry, PT, DPT, NCS, and Aaron Embry, PT, DPT, MSCR, for their assistance in reviewing the extracted data, and Eric R. Wade, PhD, for his insightful comments and revisions during the manuscript preparation.
Authors’ Note
The contents do not represent the views of the Department of Veterans Affairs or the US government. We certify that no party having a direct interest in the results of the research supporting this article has or will confer a benefit on us or on any organization with which we are associated.
Declaration of Conflicting Interests
The author(s) declared no potential conflicts of interest with respect to the research, authorship, and/or publication of this article.
Funding
The author(s) disclosed receipt of the following financial support for the research, authorship, and/or publication of this article: This material is the result of work supported with resources and the use of facilities at the Ralph H. Johnson VA Medical Center in Charleston, SC. This work was supported by NIH Grant Numbers KL2 RR029880 and KL2 TR000060 (HSB), VA RR&D A6776S (SAK), and VA RR&D B7177M (MGB).