
Abstract
Background. Safe community ambulation requires the capacity to adapt gait to environmental changes on short notice. Reduced adaptability may contribute to an increased risk for falls. Objective. This study investigated gait adaptability in community-dwelling persons poststroke and sought to understand some of the mechanisms of reduced adaptability. Methods. Participants were 25 poststroke persons (Functional Ambulation Categories score 5) and 25 healthy controls of similar age. During treadmill walking, 30 obstacles were suddenly dropped in front of the affected leg or left leg of controls. The participants had to avoid the obstacle by either lengthening or shortening the ongoing stride. The obstacle avoidance success rates were determined. Electromyography activity of bilateral biceps femoris, rectus femoris, tibialis anterior, and gastrocnemius medialis muscles was recorded as well as concomitant knee and hip angle courses and spatial characteristics of the avoiding stride. Results. Poststroke persons demonstrated markedly decreased obstacle avoidance success rates, most prominently under time pressure. They showed normal avoidance strategies but had delayed and reduced electromyography responses, smaller joint angle deviations from unperturbed walking, and smaller horizontal margins from the foot to the obstacle. Conclusions. Even in persons who were only mildly affected by stroke, gait adaptability may be reduced, which may place them at risk of falling. Delayed and decreased muscle responses were identified as one possible mechanism with diminished ability to adapt the length of the avoiding stride. Rehabilitation interventions could focus on these impairments.
Introduction
People in the chronic phase of stroke are at an increased risk of falling compared with healthy age-matched peers. 1 This high risk is evident even among well-recovered community-dwelling individuals. 2 For independent and safe community ambulation, it is particularly important to be capable of adapting the gait pattern to environmental demands and constraints, as confirmed by reports of an increased fall risk in people with reduced gait adaptability. 3
It has been shown that gait adaptability is reduced in people with stroke.4-6 People with stroke demonstrated deficits in visually 4 or auditorily5,7 evoked online step adjustment. In good walkers, current clinical tests usually fail to demonstrate these more subtle gait impairments. Hence, gait adaptability tests that challenge people at the limits of their capacity may uncover problems that otherwise remain unnoticed in common observational clinical evaluation.
Although there is strong evidence that gait adaptability is compromised after stroke, the underlying mechanisms are still largely unknown. Deficits in movement execution were demonstrated when people with stroke had to approach and cross an obstacle that was positioned several strides ahead. 8 However, deficits in step adaptations became even more prominent when they had to be executed under time pressure.4,9 Therefore, a delay in the commencement of the adaptation most likely further reduces their gait adaptability. Indeed, in healthy older individuals, both decreased response amplitudes and delayed reaction times have been associated with reduced gait adaptability. 10
It is important to elucidate the mechanisms underlying reduced gait adaptability after stroke, because this knowledge adds to our understanding of the problems that these people experience while walking in the community and may provide targets for intervention. Hence, in the current study, we aimed to study gait adaptability in community-dwelling people with stroke. In particular, we aimed to address some of the mechanisms underlying the expected decrease in gait adaptability. A time-constrained obstacle avoidance paradigm on the treadmill has often been used to evaluate gait adaptability3,4,11-14 and may predict falls in daily life. 3 Moreover, treadmill walking is considered a valid method for detecting motor control deficits post stroke. 15 Therefore, the present study compared the ability to avoid sudden obstacles during treadmill walking between poststroke persons and healthy control subjects. We used electromyography (EMG) to investigate muscle response times and amplitudes, and we explored the relationship of EMG with kinematic and spatial characteristics of the avoidance maneuver.
Methods
Participants
The experimental group consisted of 25 persons with hemiparesis at least 6 months poststroke. The data of this group were collected as part of a study comparing functional electrical stimulation (FES) of the peroneal nerve with an ankle–foot orthosis (AFO),16,17 so all participants demonstrated stroke-related foot drop during gait. In addition, candidates had to be able to walk independently without a walking aid for more than 10 minutes on even and uneven surfaces (Functional Ambulation Categories score 5 18 ) and to walk comfortably on the treadmill without handrail support at 2 km/h or faster. Exclusion criteria that were relevant for the current study were visual impairments and an impaired understanding of instructions. Other FES-related exclusion criteria were a demand-type pacemaker, pregnancy, psychological disorders (depression or psychosis), and, related to the paretic limb, less than 30° of passive ankle motion, inability to load the heel while standing upright, severe hypertonia of the calf (Modified Ashworth Scale scores 4-5 19 ), skin lesions at the electrode sites, and inability to stimulate the peroneal nerve. The following clinical measures were obtained: muscle tone of the knee and ankle muscles (Modified Ashworth Scale 19 ), lower extremity muscle strength (Motricity Index 20 ), lower extremity motor selectivity (Fugl-Meyer Assessment 21 ), balance (Berg Balance Scale 22 ), and comfortable walking speed. For the control group, we recruited 25 healthy participants of similar age. All participants gave written informed consent. The experimental protocol was approved by the regional medical-ethical committee.
Experimental Setup
The participants with stroke walked on a treadmill with their AFO at either 2 or 3 km/h, depending on their individual walking capacity (Figure 1A). The controls walked at both 2 and 3 km/h. We post hoc “matched” controls to the persons with stroke and only analyzed the series performed at the same speed. All participants wore comfortable shoes and a safety harness that did not support any body weight. Just above the treadmill, an obstacle (length, width, and height: 40, 30, and 1.5 cm, respectively) was held by an electromagnet.23,24 The participants were instructed to maintain a sagittal distance of about 10 cm between the hanging obstacle and the avoiding foot at the moment of foot strike (Figure 1A).
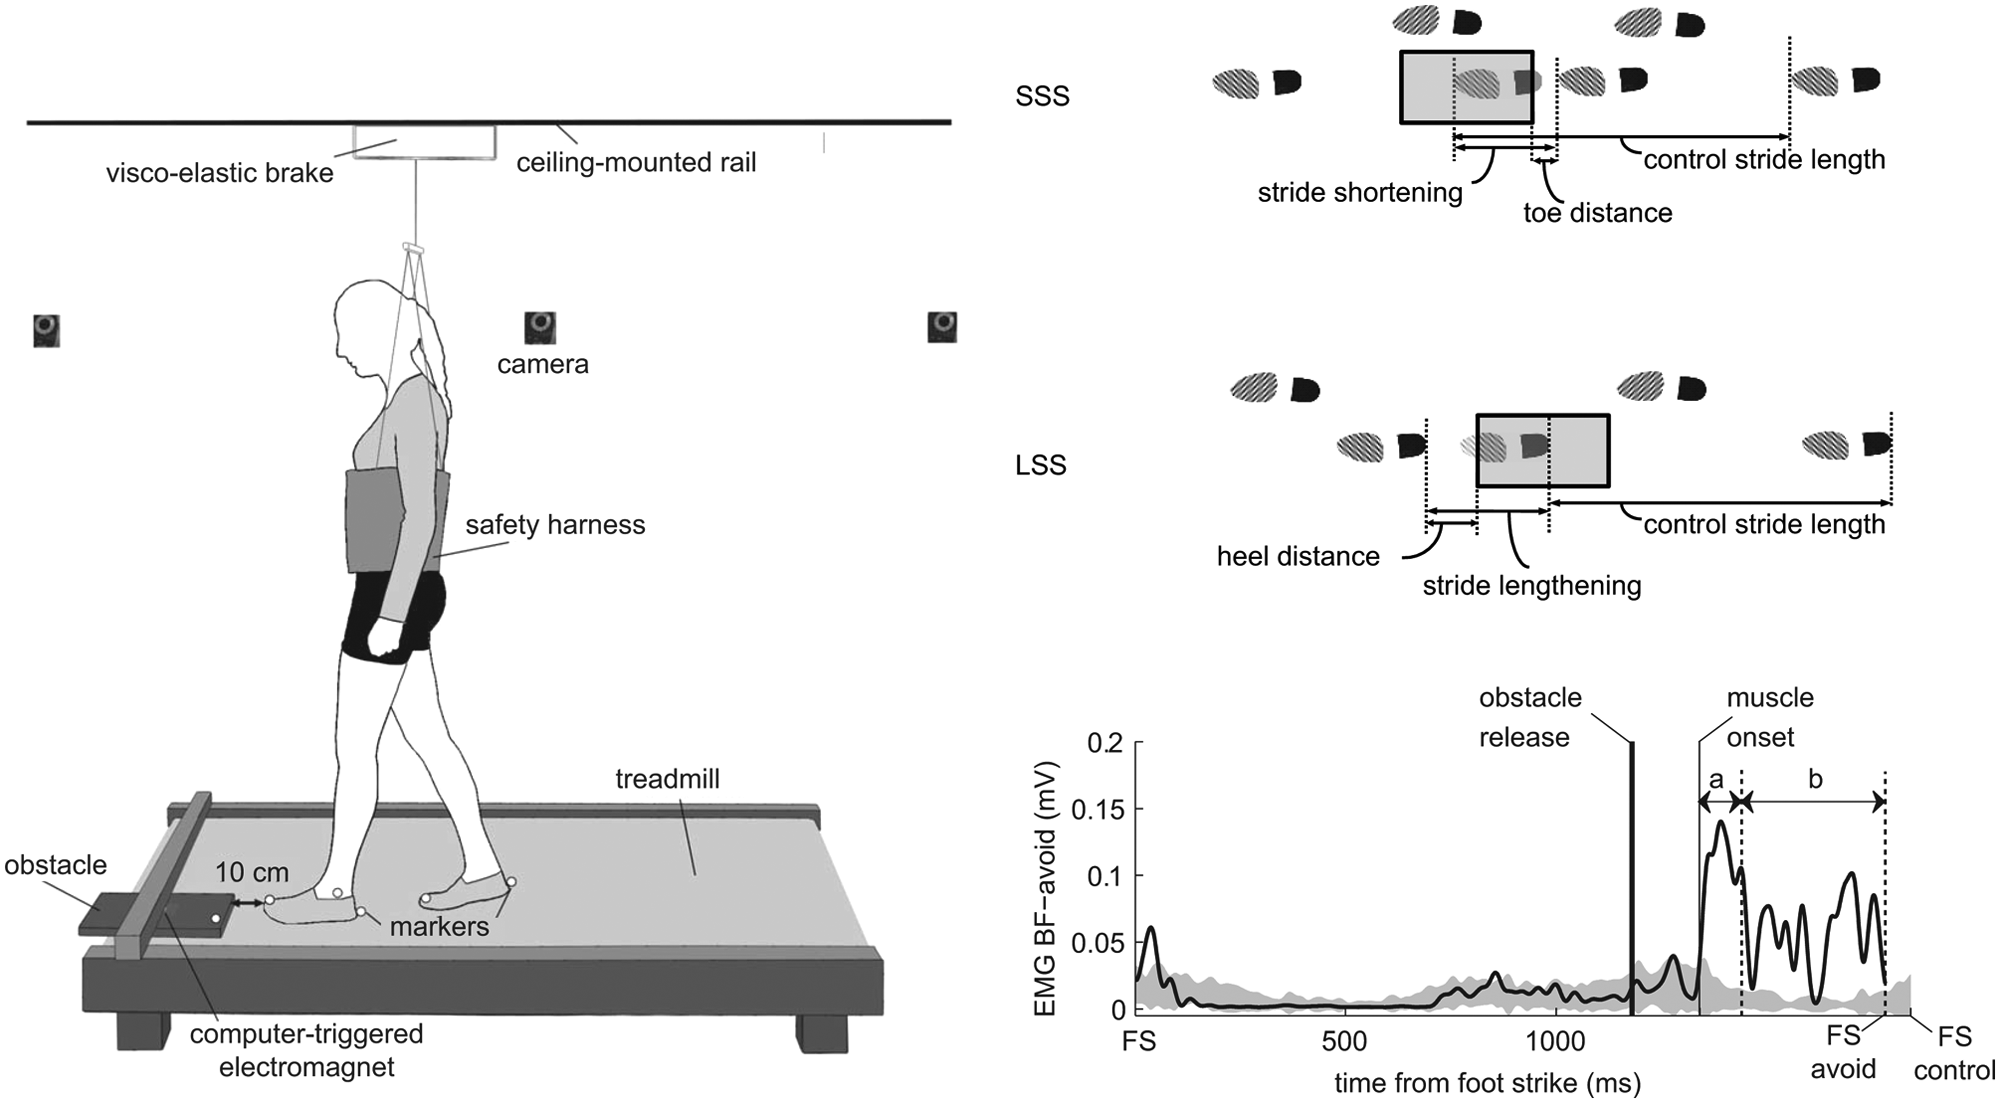
(A) Schematic diagram of the experimental setup. (B) Schematic diagram of the avoidance strategies. Short stride strategy (SSS): an additional shortened stride is performed before the actual crossing stride. Long stride strategy (LSS): the stride is lengthened to cross the obstacle. (C) Example of electromyography (EMG) onset detection in a control subject. The solid trace represents an example of left biceps femoris response (BFavoid) to obstacle release (from foot strike to foot strike of the avoiding stride). This BF-avoid trace is superimposed on a gray area representing the EMG activity of this muscle during unperturbed gait (ie, mean ± 2 SD of control strides). The thin vertical solid line gives the start of BF-avoid deviation from this area (muscle onset). Muscle onset latency is the time difference between muscle onset and obstacle release. Arrow a indicates the 100-ms-period over which the “initial” response amplitude was computed. Arrow b indicates the period of the avoiding stride over which the “late” response amplitude was computed. FS = foot strike; FS avoid = foot strike of the avoiding stride; FS control = foot strike of the control stride.
Three reflective markers were attached at the most anterior, posterior, and lateral part of each shoe, and 1 additional marker was placed at the front edge of the obstacle. A 6-camera 3D motion analysis system (Vicon Motion Systems, Oxford, UK) recorded the marker positions at 100 Hz. Foot marker data were processed in real time to determine the instant and position of foot strike. Computer algorithms used this information to trigger obstacle release unexpectedly (after 5-15 unperturbed strides) in 1 of 3 phases of the gait cycle: mid-stance, stance-swing transition, and mid-swing. Later instants of obstacle release reduced the time available to respond to the obstacle and, consequently, increased the level of difficulty of the trial. The 3 phases of obstacle release corresponded with available response times (ART) of 450 to 600, 300 to 450, and 150 to 300 ms, respectively. ART was defined as the time span between obstacle release and the moment that the toe would have crossed the front edge of the obstacle in case of an unaltered walking pattern.
The obstacle always fell in front of the affected leg of the poststroke persons and the left leg of the controls, which will be referred to as the “avoiding leg.” Participants were instructed to avoid stepping on the obstacle, while stepping aside with the avoiding leg was not allowed. The other leg, called the “stance leg,” was not obstructed by the obstacle. Contact of the foot with the obstacle and steps beside the obstacle with the avoiding leg were classified as failures, which was judged by 2 assessors. In the case of any uncertainty, we checked the marker position data and video recordings of the respective trial to underscore a final decision. At the beginning of each session, the participants were provided time to familiarize with treadmill walking, and in addition, they performed 5 practice obstacle avoidance trials. Subsequently, they performed 30 experimental obstacle avoidance trials in which the instants of obstacle release (mid-stance, stance-swing transition, and mid-swing) were randomly distributed over the trials. Total walking time was approximately 20 minutes, and breaks were permitted whenever needed.
Electromyography (EMG) recordings were made of bilateral biceps femoris (BF), rectus femoris (RF), tibialis anterior (TA), and medial head of gastrocnemius (GM) muscles. We used self-adhesive electrodes (Tyco Arbo ECG; Brainclinics Diagnostics, Nijmegen, Netherlands) that were attached according to SENIAM guidelines. 25 Furthermore, flexion–extension movements of the hips and knees were measured with goniometers (Biometrics SG150 and SG110/A; Biometrics Ltd, Ladysmith, Virginia). EMG and goniometer signals were recorded synchronously with the marker data at a sample rate of 1000 Hz.
Data Processing
Individual avoidance success rates were calculated for each of the ART categories. From the marker data, it was determined for each trial whether the subject had avoided the obstacle by shortening (short stride strategy [SSS]) or by lengthening (long stride strategy [LSS]) the ongoing stride (Figure 1B). The LSS is generally used at long ARTs, whereas the SSS is used at short ARTs.26,27 In 5.1% of the trials, a strategy was applied that could not be classified as either SSS or LSS. These trials were discarded from the analysis. For each ART category, the proportions of LSS and SSS trials were computed.
Spatial outcomes included the distance from the toe to the obstacle (toe distance) for SSS trials, from the obstacle to the heel (heel distance) for LSS trials, and the amount of stride shortening (SSS) or lengthening (LSS), defined as the deviation from the mean control stride length (ie, length of the stride prior to obstacle release for each trial; averaged over all 30 trials).
Goniometer data were low pass filtered (6 Hz; zero lag, fourth-order Butterworth). Subsequently, we determined the maximum hip and knee flexion angles during the swing phase of the avoiding leg and the maximum knee flexion and hip extension angles during the stance phase of the stance leg. Outcomes were computed for each trial as the deviation from the mean control stride (ie, averaged over 30 trials) and were averaged within each subject over all SSS and LSS trials.
The EMG signals were band-pass filtered (20-450 Hz; zero lag, fourth-order Butterworth), full-wave rectified, and low-pass filtered (25 Hz; zero lag, fourth-order Butterworth). For each muscle and each participant we calculated the average (±2 SD) trajectory over the 30 control strides. Muscle onsets were detected by a computer algorithm with visual inspection as a control. Onset was defined as the moment at which the EMG activity of the perturbed step exceeded the mean plus 2 SDs of the control strides at the respective instant of the step cycle for at least 30 ms (Figure 1C). Onset latency was the time between obstacle release and muscle onset. We calculated the EMG amplitudes over the initial 100 ms following response onset (Figure 1C, arrow a), because we expected that this time period would be essential to successful performance due to the time-critical nature of the avoidance task. In addition, we calculated the “late” response amplitudes from 100 ms after response onset until foot strike (Figure 1C, arrow b). For both initial and late muscle response amplitudes, the extra amplitude (ie, additional to the average control stride) was normalized to the mean control amplitude of the corresponding phase of the stride.
Statistical Analysis
First, success rates and the proportions of LSS and SSS were compared between the groups by means of a 2-way analysis of variance (ANOVA) with ART (150-300, 300-450, 450-600) as a within-subjects factor and Group as a between-subjects factor. All trials, irrespective of successfulness, were further analyzed. Spatial outcomes were compared between the groups with Student t tests. Furthermore, we subjected each of the kinematic outcomes to a 2-way ANOVA (Strategy × Group).
EMG onset latencies and initial response amplitudes were subjected to a 2-way ANOVA with Muscle (8 levels) as a within-subjects factor and Group as a between-subjects factor. In this analysis, the results were collapsed over both avoidance strategies, because the activation sequence was not different between LSS and SSS (Strategy × Muscle on onset latencies, P = .275), nor were there any differential effects of strategy between the groups (Strategy × Group × Muscle, P ≥ .302). In contrast, late response amplitudes were compared between the groups by means of 2-way ANOVAs for SSS and LSS trials, separately. The significance level in these analyses was adjusted to 0.025% to correct for multiple testing.
Post hoc analyses were performed using Student t tests with Bonferroni correction for multiple comparisons. For all primary tests, the (uncorrected) α level was set at .05.
Results
Participants
Table 1 summarizes the characteristics of the participants. The groups did not differ in age, sex, weight, or body height. All but one participant with stroke wore an AFO to correct drop foot. In one participant, a trip occurred during one of the assessments. This single obstacle avoidance trial was excluded from the analysis.
Characteristics of the Participants
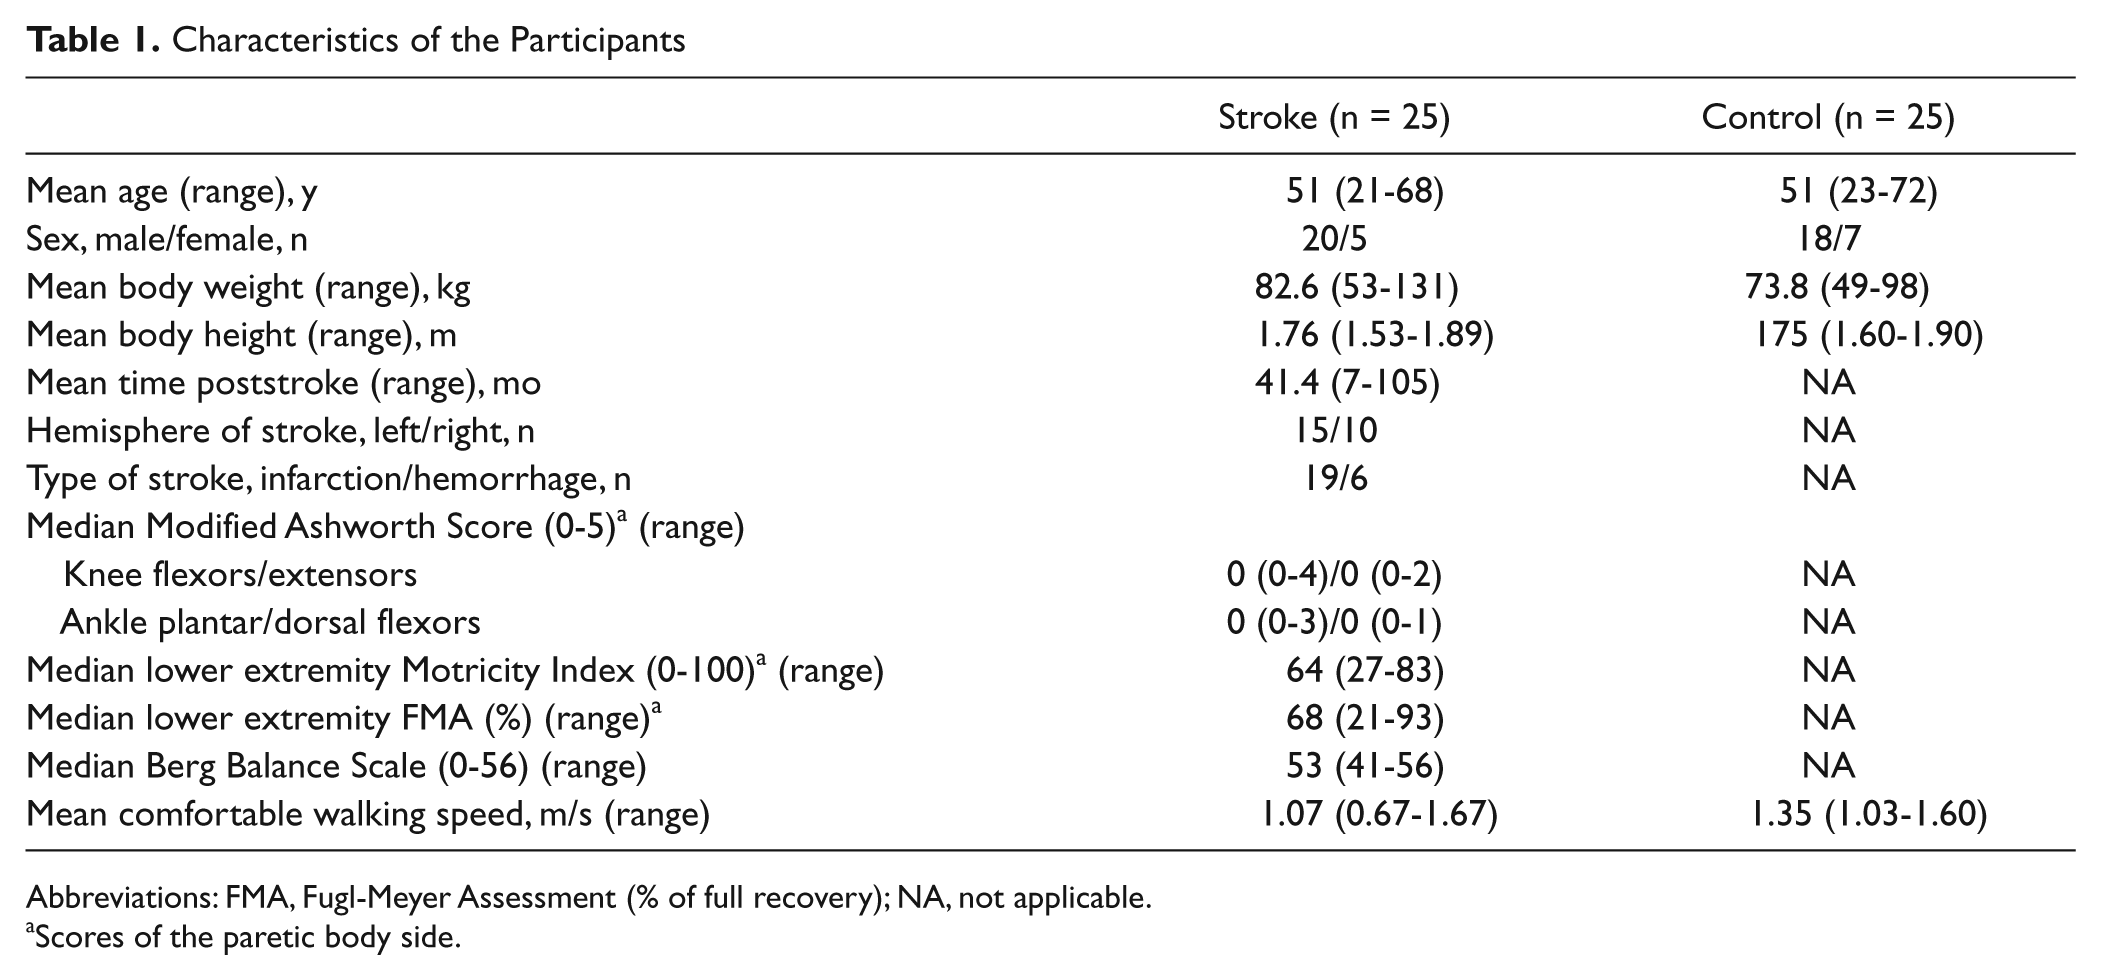
Abbreviations: FMA, Fugl-Meyer Assessment (% of full recovery); NA, not applicable.
Scores of the paretic body side.
Obstacle Avoidance Success Rates and Avoidance Strategy
The controls hardly ever touched the obstacle (average success rate 96.9 ± 1.0%), whereas the people with stroke were successful in merely 30.3 ± 4.7% of the trials (Group main effect, F(1, 48) = 192.02, P < .001, η p 2 = 0.80; Figure 2). The difference in success rates increased with increasing time pressure (Group × ART, F(2, 96) = 15.38, P < .001, η p 2 = 0.243).
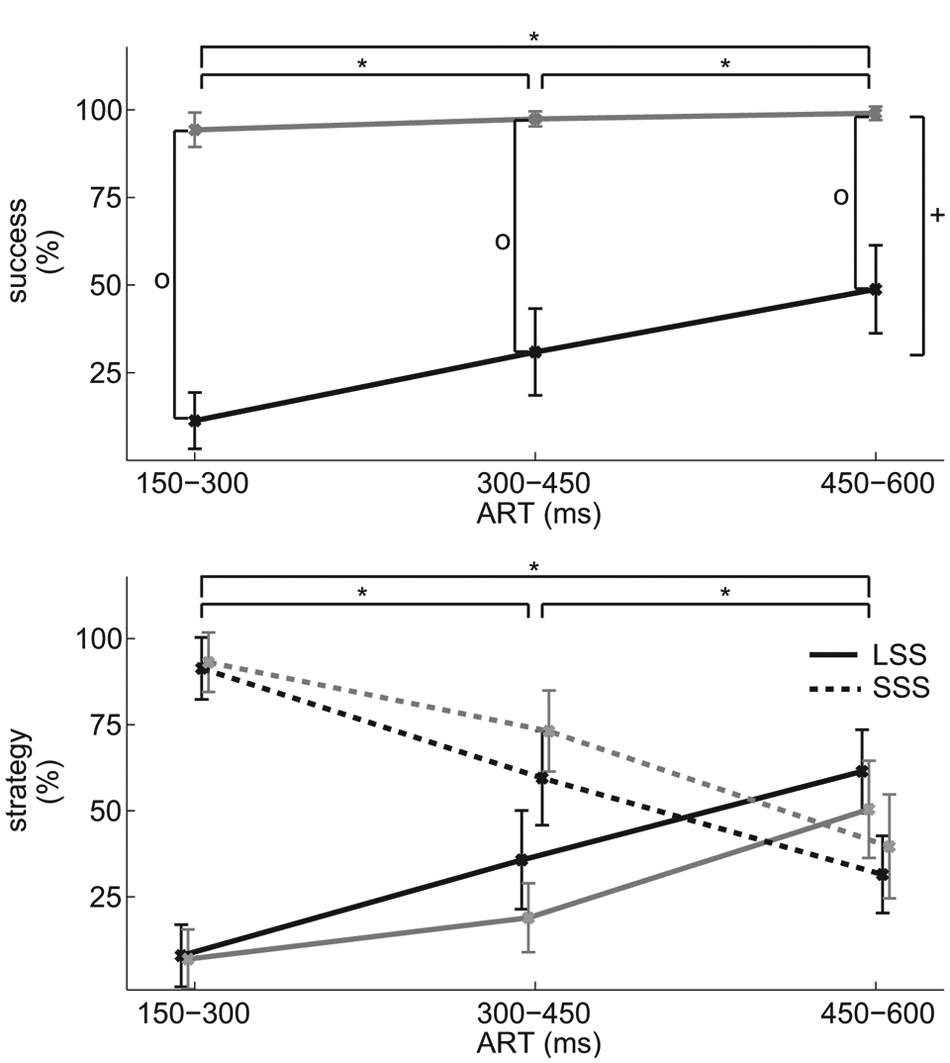
(A) Obstacle avoidance success rates (mean [CI]) for each of the available response time (ART) categories. (B) Rates of obstacle avoidance strategy (mean [CI]) for each of the groups and ART categories. All outcomes for the stroke group are shown in black and for the controls in gray. The long stride strategy (LSS) is shown in solid lines and the short stride strategy (SSS) in dotted lines. Significant main effects are indicated for Group (plus-sign) and ART (asterisks). In case of a significant Group by ART interaction, significant post hoc effects between the groups are indicated with a circle.
The strategy used to avoid the obstacle was not different between the participants with stroke and controls (Group main and interaction effects, F < 1.98, P > .143), and ART was not different between the groups, neither for LSS (t(42) = 0.76, P = .452) nor for SSS (t(46) = 1.08, P = .285). The strategy used depended on ART, with the SSS being more prevalent at shorter ART (F(2, 96) = 88.53, P < .001, η p 2 = 0.65 Figure 2).
Spatial Characteristics
In Table 2, spatial characteristics of the avoidance maneuver are shown. In SSS, participants with stroke decreased their precrossing stride length to a lesser extent than controls (t(46) = 7.228, P < .001). Consequently, in successful trials their toe distances were significantly shorter (t(36) = 2.710, P = .010). In LSS, they demonstrated less stride lengthening (t(42) = 5.463, P < .001) and heel distances in successful trials tended to be smaller compared with the control subjects (t(39) = 1.864, P = .07). Averaged over all trials, the participants with stroke showed negative values for both heel and toe distances, indicating that the foot landed on the obstacle in the majority of the trials.
Spatial Characteristics of the Obstacle Avoidance Parameters a
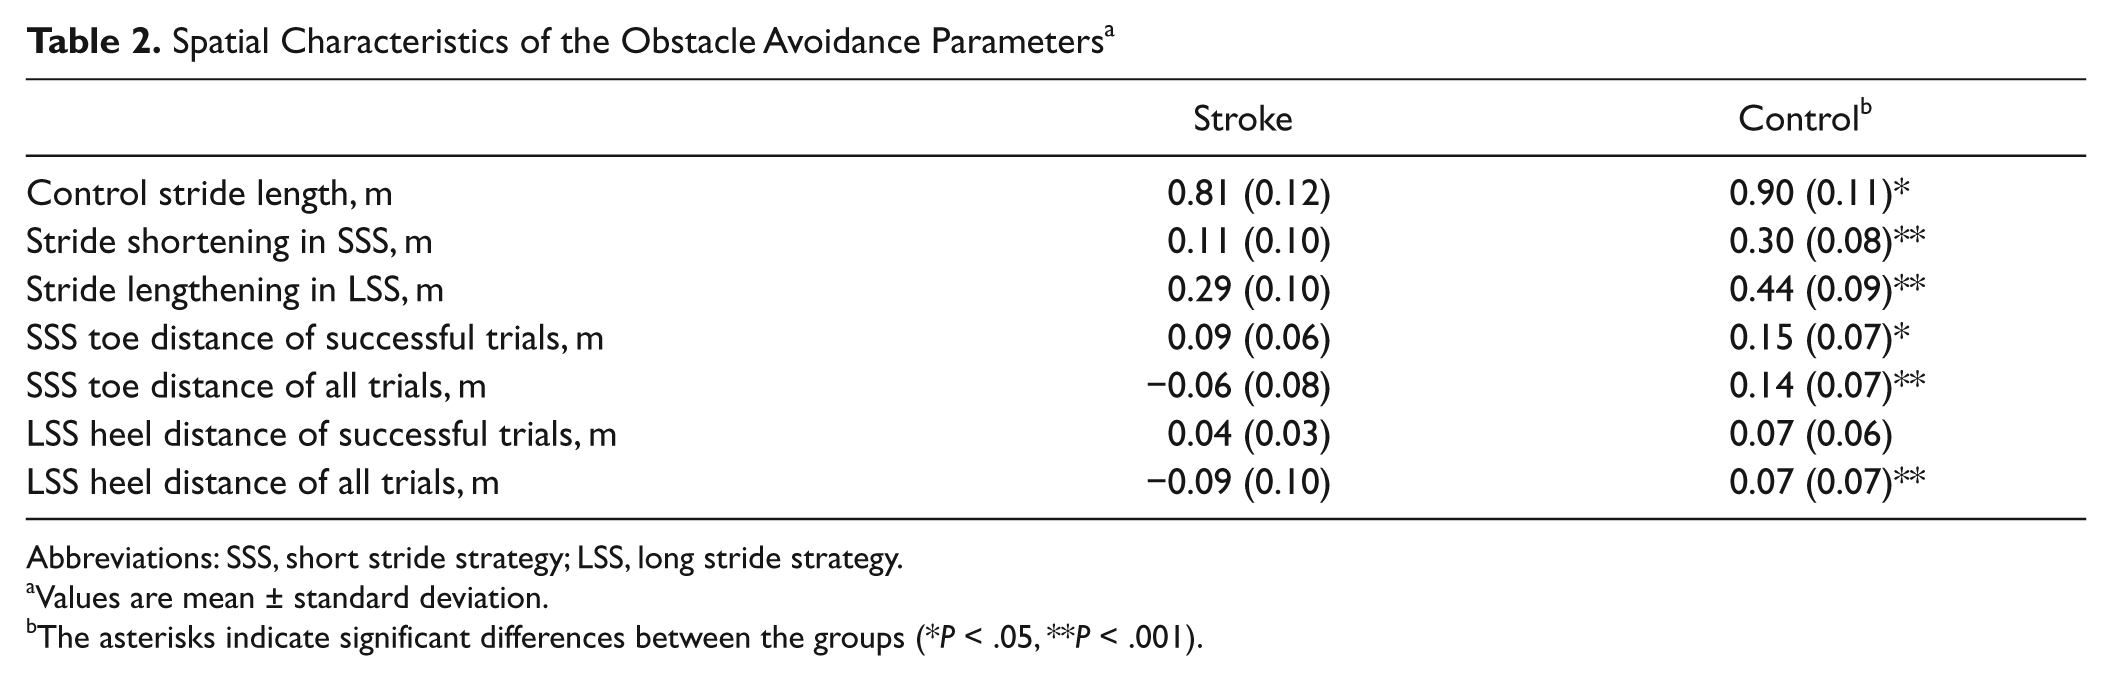
Abbreviations: SSS, short stride strategy; LSS, long stride strategy.
Values are mean ± standard deviation.
The asterisks indicate significant differences between the groups (*P < .05, **P < .001).
Kinematics
Bilateral joint angle courses of the hips and knees are shown in Figure 3. In SSS, the knee of the avoiding leg landed in a more flexed position at foot strike compared with unperturbed walking. This phenomenon was more prominent in the controls (+28.2 ± 1.5°) than in the stroke group (+4.5 ± 1.2°, P < .001). Furthermore, maximum hip flexion became less, again more prominently in the controls (−4.2 ± 0.5°) than in the stroke group (−0.3 ± 0.8°, P < .001). As for the stance leg, the hip was less extended in late stance compared with unperturbed walking. The 7.0 ± 0.5° decrease in hip extension angles in the controls was larger than in the participants with stroke (4.1 ± 0.8°, P = .004).
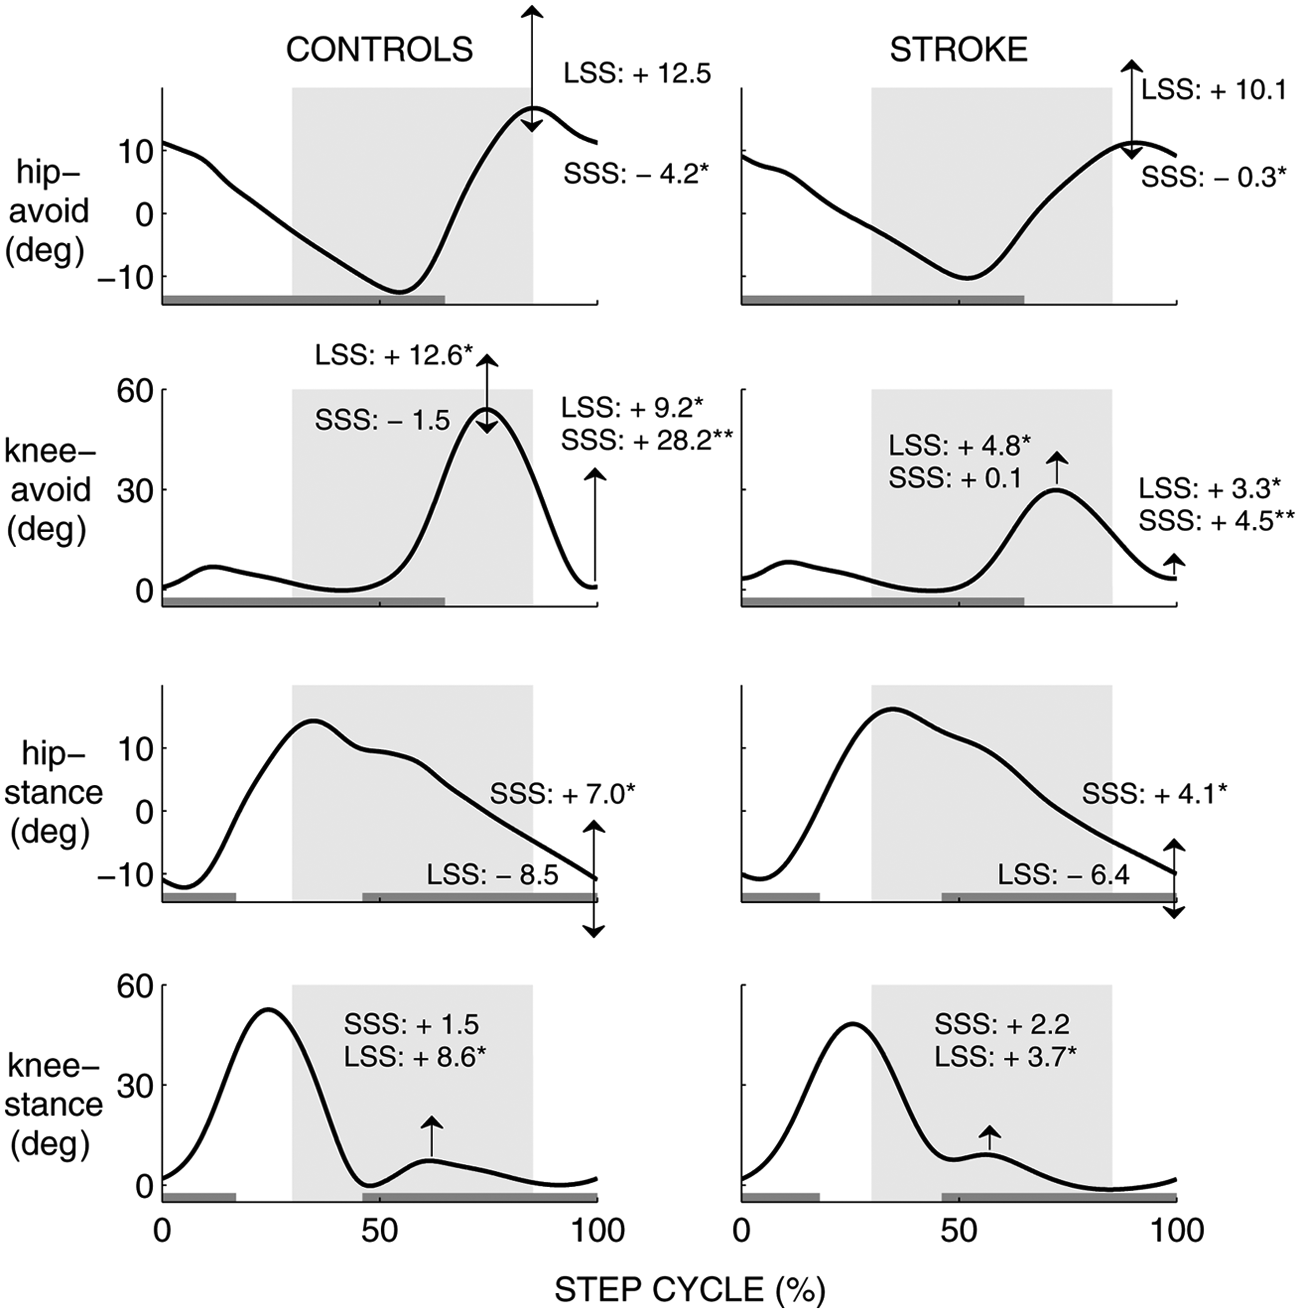
Bilateral joint angle courses (hip, knee) from foot strike to foot strike of the avoiding leg during control strides. The mean individual trajectories were averaged over the healthy controls (left) and stroke group (right). Arrows indicate the mean increase or decrease in maximum joint angles (°) during short stride strategy (SSS) and long stride strategy (LSS) compared with the control stride. Increases or decreases that differed significantly between the groups are indicated with an asterisk. Gray horizontal bars indicate the stance phase of the leg. The time span within which an obstacle may be dropped is depicted as a shaded area for each of the windows. The extension “-avoid” to the joints indicates the leg in front of which an obstacle was dropped, which was the affected leg for the stroke group and the left leg for the controls. The other leg is indicated with the extension “-stance.”
In LSS, knee flexion angles during the swing phase increased in the avoiding leg compared with unperturbed walking, which tended to be more pronounced in the controls (+12.6 ± 10.7°) than in the stroke group (+4.8 ± 2.2°, P = .036). In the stance leg, the knee was more flexed during the stance phase, which was more pronounced in the controls (+8.6 ± 1.8°) than in the participants with stroke (+3.7 ± 1.0°, P = .018).
EMG Muscle Responses
In the healthy controls, the first response to the obstacle was consistently observed in BF-avoid and RF-stance (Figure 4B). These muscles also demonstrated the highest rates of occurrence (Figure 4A) and the largest response amplitudes (Figure 4C). Responses in the other muscles followed after ~30 to 80 ms in a variable sequence.
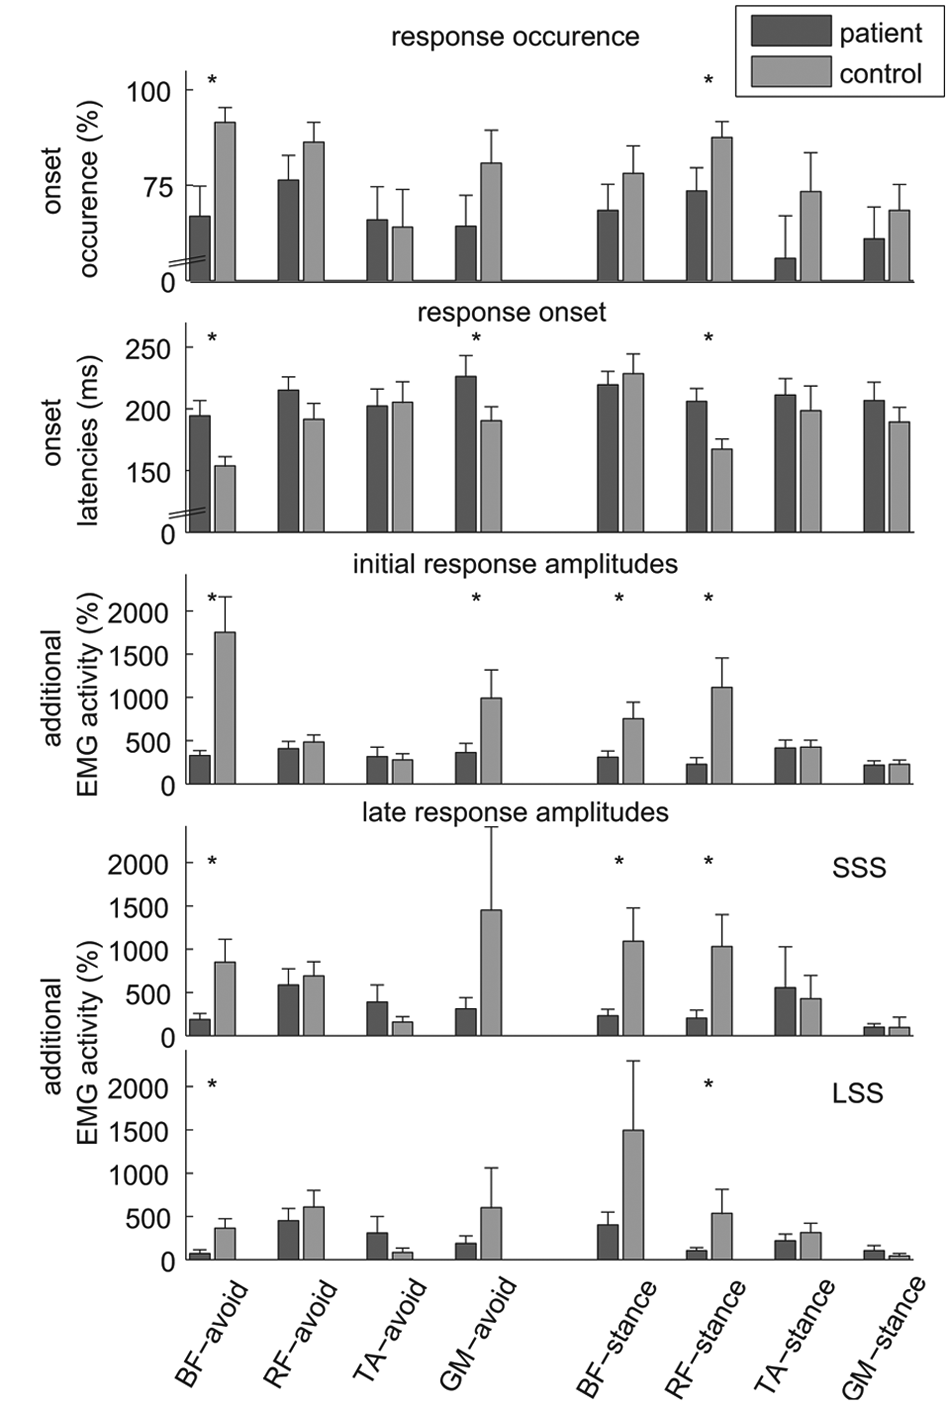
Electromyography (EMG) muscle responses to the obstacle (mean ± CI). (A) Percentage of trials in which an EMG onset could be detected. (B) Onset latencies, the time span between the moment of obstacle release and start of EMG deviation from control stride during unperturbed gait. (C) Response amplitudes computed over a time span of 100 ms following EMG onset. (D and E) Response amplitudes computed between EMG onset and subsequent foot strike for short stride strategy (SSS; D) and long stride strategy (LSS; E). Response amplitudes were normalized with respect to the average (over 30 strides) amplitude in the corresponding phase of the step cycle during unperturbed gait. Values represent the amount of additional EMG activity compared with unperturbed gait. BF, biceps femoris; RF, rectus femoris; TA, tibialis anterior; GM, medial head of gastrocnemius. “Avoid”: muscle of the avoiding leg; “Stance”: muscle of the stance leg. The Bonferroni corrected level of significance in post hoc t tests was 0.006 (A-C) and 0.003 (D and E). Significant differences between the groups are indicated with asterisks.
In persons with stroke, the number of trials in which an EMG onset could be detected was generally lower and the activation sequence was less consistent than in controls. The onsets of particularly BF-avoid, RF-stance, and GM-avoid were delayed in the stroke group compared with the controls by 41, 39, and 36 ms, respectively, without significant delays in the other muscles (BF-avoid [mean ± SD] 194 ± 32 vs 154 ± 19 ms; RF-stance 206 ± 26 vs 167 ± 21 ms; GM-avoid 226 ± 43 vs 191 ± 29 ms for stroke and control groups, respectively; Group × Muscle, F(5.46, 256.77) = 4.99, P < .001, η p 2 = 0.096).
The initial response amplitudes (in the first 100 ms from onset; Figure 4C) were lower for persons with stroke, particularly in BF-avoid (328 ± 143% vs 1754 ± 1042% for stroke and control groups, respectively) and RF-stance (226 ± 197% vs 1115 ± 871%). Significantly lower amplitudes were also observed in GM-avoid (361 ± 274% vs 994 ± 826%) and BF-stance (309 ± 182% vs 755 ± 482%; Group × Muscle, F(3.44, 161.67) = 17.86, P < .001, η p 2 = 0.275).
Late response amplitudes were analyzed for SSS and LSS separately. In SSS (Figure 4D), most muscles demonstrating lower initial response amplitudes in the stroke group also showed significantly lower late response amplitudes (ie, BF-avoid, RF-stance, and BF-stance; Group × Muscle, F(2.01, 80.34) = 5.55, P = .005, η p 2 = 0.122). In contrast, late response amplitudes in TA-avoid tended to be larger in the stroke group (with 390 ± 460%) than in the controls (156 ± 160%, P = .007).
Late response amplitudes in LSS (Figure 4D) were also lower for BF-avoid and RF-stance in the participants with stroke compared with the controls (BF-avoid 71 ± 103% vs 363 ± 261%; RF-stance 104 ± 83% vs 535 ± 648%, respectively; Group × Muscle, F(1.97, 66.8) = 6.81, P = .002, η p 2 = 0.167). In contrast and similar to the results for late response amplitudes in SSS, the stroke group demonstrated larger TA-avoid amplitudes (308 ± 456%) compared with controls (84 ± 104%, P = .012). This effect, however, was not significant because of the corrected alpha level.
Discussion
Our study demonstrated that poststroke participants had major difficulties avoiding obstacles while walking, particularly when there was little time to execute the stride adjustment. This reduced gait adaptability confirms earlier reports of obstacle avoidance problems in people with stroke. 4 In addition, we identified some of the underlying motor impairments that explain the frequently observed obstacle contacts. Participants with stroke demonstrated delayed and reduced EMG responses, smaller changes in hip and knee joint angles (compared with unperturbed walking), and smaller horizontal margins of the foot to the obstacle. In contrast to the study of Den Otter and coworkers, 4 we found no between-group differences concerning the avoidance strategies used. Hence, the decreased success rates in the participants with stroke were probably not related to the application of inappropriate avoidance strategies.
The SSS was predominantly applied in the most difficult trials (ie, with short ARTs; Figure 2B). The stride shortening was achieved by a quick deceleration of the forward swing of the avoiding leg such that the hip was flexed less and the knee at foot contact was flexed more than in normal gait. However, in the people with stroke, these changes in joint angles were less pronounced than in the controls. This was most likely due to their BF-avoid delayed onsets and decreased activation levels (both initial and late response amplitudes). As a result, they often failed to sufficiently shorten their stride and landed on the obstacle with the toes (Table 2). With respect to the lower-leg muscles, the controls presumably activated their GM-avoid early and at high amplitudes in preparation for weight bearing on the forefoot, as the stride shortening (with considerable knee flexion) often resulted in a forefoot landing at initial contact. In contrast, the people with stroke landed on the obstacle with their toes in most SSS trials, with the knee almost as extended as in the control strides. The use of an AFO may have prevented them from using a strategy with ankle plantar flexion and knee flexion. These participants may have attempted to avoid the obstacle by activating TA-avoid to hold the forefoot above the obstacle, while keeping the heel on the treadmill surface. In this perspective, the larger TA-avoid amplitudes in the stroke group may be regarded as a compensatory strategy for the delayed and decreased activity of BF-avoid. Nevertheless, this compensation was unsuccessful in the vast majority of trials, which is probably due to insufficient strength of the TA muscle on the affected side. In addition, the AFO may have hampered ankle dorsiflexion beyond 90°.
With respect to the stance leg during SSS, between-group differences in EMG onsets and amplitudes were most pronounced in RF. The knee extensor moment generated by this muscle may contribute to the deceleration of walking. 28 In SSS, deceleration of walking would save time to make the additional stride in front of the obstacle. Hence, the delayed RF-stance onsets and reduced amplitudes (both initial and late) in the stroke group may indicate that they decelerate walking less effectively than controls. Ground reaction forces, however, are needed to provide conclusive evidence on the consequences of the RF-stance deficits in the persons with stroke.
The LSS was most frequently applied in the easier trials, with longer ARTs. In contrast to SSS, foot contact was postponed in LSS, and the foot was positioned after the obstacle. The increase in knee flexion angles that was observed during the obstacle crossing swing phase was less prominent in the participants with stroke than in the controls, which is likely related to their decreased BF-avoid amplitudes. High TA-avoid response amplitudes in the participants with stroke might be interpreted as part of a flexion synergy. Synergistic leg flexion may have assisted foot clearance with respect to the obstacle, where selective knee flexion failed. Furthermore, to lengthen the crossing stride, additional extensor activity has to be provided by the stance leg. This is presumably reflected in the large late response amplitudes of BF-stance, generating large hip extension moments. 28 In the participants with stroke, BF-stance response amplitudes tended to be smaller than in controls, which may have reduced trunk progression, which is in line with earlier reports. 29 This may have contributed to decreased 30 and often insufficient stride lengthening leading to more frequent landing of the heel on the rear end of the obstacle.
In spite of the clear kinematic differences between LSS and SSS, the muscle activation sequence was similar for both strategies, with BF-avoid and RF-stance being activated first and at high amplitudes. This observation is in agreement with previous research reporting an early and a later class of responses to adjust an ongoing movement of the arm 31 or leg. 32 The early, automatic response was modifiable in size but not in direction, whereas the later response changed the direction of movement according to the subjects’ intention. In line with this reasoning, the initial responses in the current study may be interpreted as a fast, generic “safety” response to the obstacle in order to retract the swing limb (BF-avoid) and slow down the ongoing hip extension of the stance limb (RF-stance). In contrast, the late muscle responses in the current study may be strategy specific.
Participants with stroke demonstrated delayed responses to the obstacle, particularly in those muscles that are considered to be the prime movers. Previous research has also reported delayed onsets of step adjustments in people with stroke in response to a displacement of the stepping target. 9 It has been suggested that in healthy people these online step adjustments represent a special class of reflex-like responses that are faster than voluntary reactions 14 and may, therefore, be under automatic rather than cognitive control.14,32,33 In this perspective, the delayed responses in the people with stroke suggest that they use different neural pathways for online step adjustments, which might involve cognitive control. This suggestion is supported by the observation that people with stroke needed disproportionate amounts of attention during obstacle crossing. 34
In the control group, we observed similar early onset latencies for the left and right leg (ie, BF-avoid and RF-stance). It suggests that the first, generic reaction to an obstacle involves bilateral coordinated responses rather than independently organized unilateral responses. These primary responses were bilaterally delayed in the people with stroke. This finding may explain why the capacity to avoid sudden obstacles seems to be affected in people with stroke irrespective of whether the paretic or the nonparetic leg is used as the lead limb. 4 As a consequence, unilateral damage to the pathways involved in the avoidance response may necessitate people with stroke to resort to different (slower) neural circuits for the control of both legs.
A limitation of this study is that all but one participant in the stroke group wore an AFO, which complicated the interpretation of the TA-avoid and GM-avoid activity. Future studies should evaluate the ankle kinematics in persons with stroke who are not dependent on the use of an orthosis. Second, all poststroke participants in this study were community walkers, which limits the generalizability to persons with poorer gait capacity. Nevertheless, our conclusions are pertinent because online step adjustments are particularly important for community-dwelling subjects. Third, we did not have brain images of our participants to identify the exact location of the brain lesions. Such knowledge might have been informative with regard to the neural pathways involved in the step adjustments. Finally, the findings on RF-stance activity call for further research including measurement of ground reaction forces during online gait adjustments.
Conclusions
Reduced gait adaptability under time pressure involves both delayed and reduced activity of the prime movers, which coincides with essential kinematic changes that explain why participants with stroke are less able to adequately adjust their stride length in response to a sudden obstacle. Prevention of falls with gait training is a major rehabilitation focus. 35 Gait adaptability might be improved with time-critical obstacle training, for example, on a treadmill with visual objects projected on the belt 36 and, in poststroke drop foot, with FES. 16 Future research is needed to evaluate whether such training translates to safer community ambulation.
Footnotes
Declaration of Conflicting Interests
The author(s) declared no potential conflicts of interest with respect to the research, authorship, and/or publication of this article.
Funding
The author(s) disclosed receipt of the following financial support for the research, authorship, and/or publication of this article: This work has been supported by small unrestricted grants from Ness Netherlands B.V. (now Bioness) and Unu B.V. in the Netherlands.