
Abstract
Background and purpose. Augmenting changes in recovery is core to the rehabilitation process following a stroke. Hence it is essential that outcome measures are able to detect change as it occurs, a property known as responsiveness. This article critically reviewed the responsiveness of functional outcome measures following stroke, specifically examining tools that captured upper-extremity (UE) functional recovery. Methods. A systematic search of the literature was undertaken to identify articles providing responsiveness data for 3 types of change (observed, detectable, and important). Results. Data from 68 articles for 14 UE functional outcome measures were retrieved. Larger percentage changes were required to be considered important when obtained through anchor-based methods (eg, based on patient opinion or comparative measure) compared with distribution methods (eg, statistical estimates). Larger percentage changes were required to surpass the measurement error for patient-perceived functional measures (eg, Motor Activity Log) compared with laboratory-based performance measures (eg, Action Research Arm Test). The majority of rehabilitation interventions have similar effect sizes on patient-perceived UE function and laboratory-based UE function. Conclusions. The magnitude of important change or change that surpasses measurement error can vary substantially depending on the method of calculation. Rehabilitation treatments can affect patient perceptions of functional change as effectively as laboratory-based functional measures; however, larger sample sizes may be required to account for the larger measurement error associated with patient-perceived functional measures.
Introduction
Functional recovery following stroke is complex, with wide variation in natural recovery and response to treatment across individuals. Optimizing or augmenting changes in recovery is core to the rehabilitation process following a stroke. Hence it is essential that outcome measures are able to detect change as it occurs, a property known as responsiveness.1,2
Detecting change over time or from an intervention is one of the most critical requisites of an outcome measure; it is necessary information for selecting the best instrument for practice or research and for determining sample size for clinical studies. Furthermore, there is growing recognition that traditional reporting of statistical significance tests and effects sizes should be accompanied by methods for determining meaningful or important change. 3
Beaton et al 1 argue that responsiveness is a context-specific characteristic that is influenced by factors such as the specific sample, treatment, and the type of change captured by an instrument. The authors outline 3 major types of change in their responsiveness taxonomy. They are as follows: (1) observed change, (2) important change, and (3) detectable change. Figure 1 depicts the interrelationship between the 3 types of change and the common metrics used to quantify them. Observed change is the amount of change observed in a population in which change is expected to occur (ie, after a treatment of known efficacy or a specific period within the natural recovery pattern). Traditional methods have captured this type of change with an effect size. 1 Important change is the observed change estimated to be meaningful and is often quantified as a minimally clinically important difference (MCID) value. For example, important change may reflect the value that patients, clinicians, or society places on the recovery (or partial recovery) of a task, such as the ability to bring a spoon to the mouth. Finally, detectable change takes into consideration the measurement error associated with a tool and is often quantified as a minimal detectable change score (MDC) or limit of agreement. Calculation of the MDC value associated with a measure varies depending on the confidence level selected. The most common confidence levels selected are 95% and 90% and are denoted by the subscripts MDC95 and MDC90. Confidence that true functional change has been observed in a clinical study is increased when the observed change is equal to or surpasses a measure’s detectable change values. 1
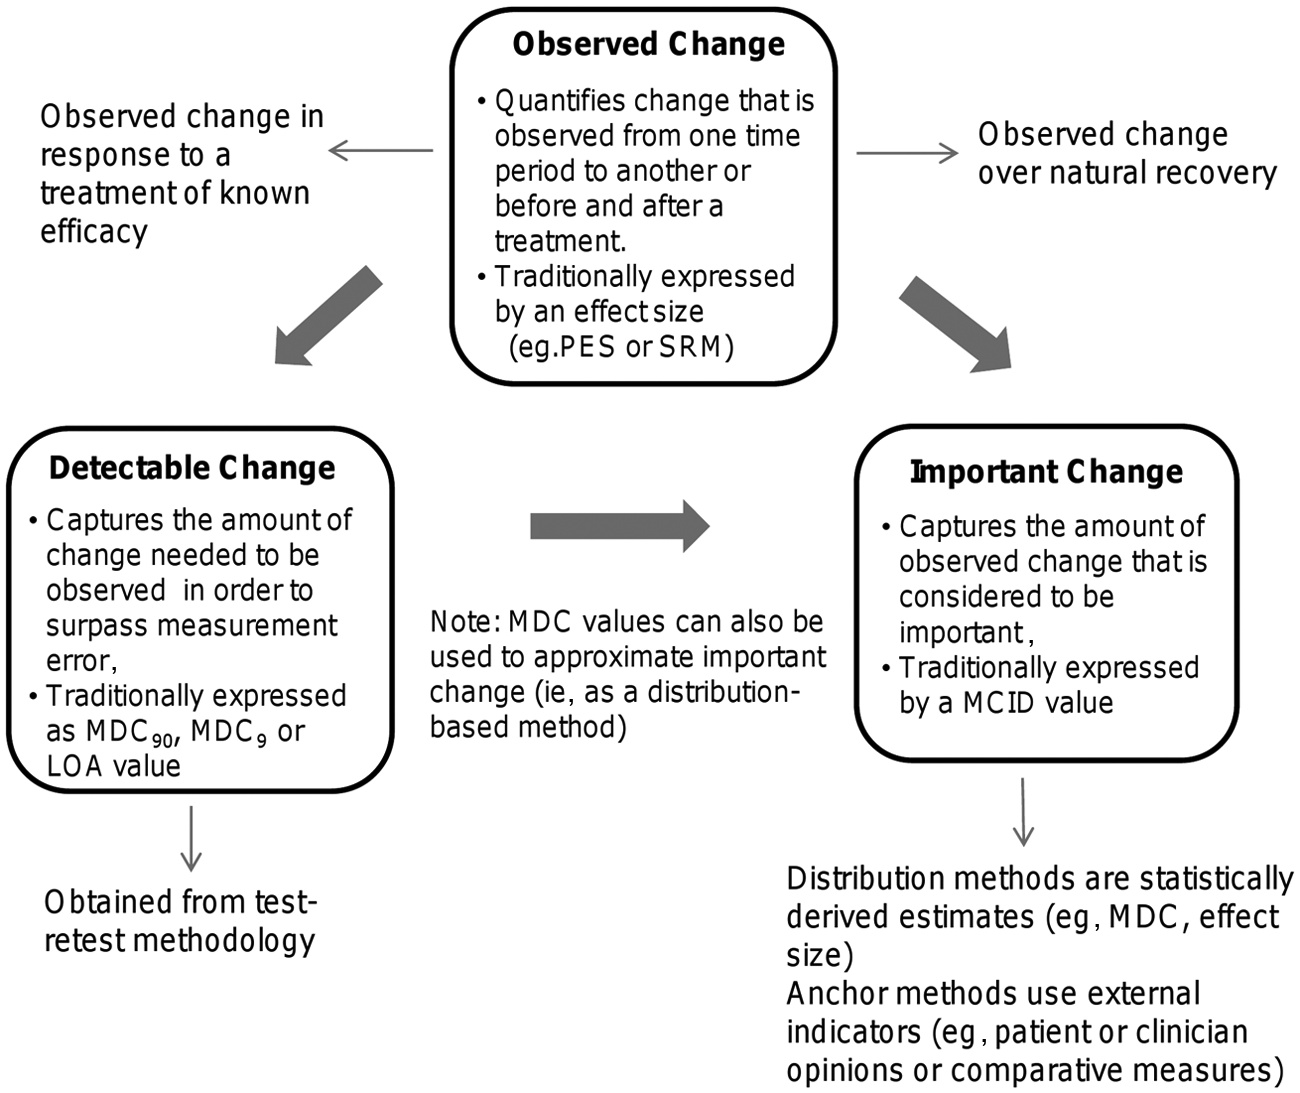
Graphic representation of observed, detectable, and important change. Abbreviations: MDC90, minimal detectable change (with 90% confidence interval); MDC95, minimal detectable change (with 95% confidence interval); LOA, limits of agreement; PES, population effect size; SRM, standardized response mean; MCID, minimally clinically important difference.
The purpose of this article is to synthesize and critically review the research evidence that captures responsiveness as defined by 3 types of change (observed, important, and detectable). This systematic review provides an understanding of the responsiveness of outcome measures used in stroke research, specifically within the context of upper-extremity (UE) functional recovery.
Methods
Literature Search
This review targeted articles that capture 3 types of change (observed, important, and detectable) using UE functional outcome measures following a stroke. Articles were identified using a systematic search of electronic databases (MEDLINE, EMBASE, CINAHL, PsycINFO, Cochrane Central) from database inception through March 2012. The following keywords were used: stroke, cerebrovascular accident or hemiplegia or hemiparesis combined with upper extremity, function or activities of daily living and responsiveness, reliability, psychometrics, “minimally clinically important change or MCID,” “standard error of measurement or SEM,” “minimal detectable change or MDC,” “standardized response mean or SRM,” and effect size or outcome measurement. All terms were mapped onto subject headings. Articles were limited to the English language, human subjects, and adults. A hand search of reference lists from reviews and the gray literature (eg, StrokEngine Assess) was also conducted to ensure a thorough search. 4
Inclusion Criteria
To be included in this review, articles had to meet the following inclusion criteria: they had to (1) provide a responsiveness index or sufficient information to calculate responsiveness index (eg, MDC or effect size); (2) use a sample of individuals with stroke; (3) use an outcome measure that assessed affected UE ability and included ≥50% functional activities (to ensure scale reflected International Classification of Functioning, Disability, and Health activity domain); and (4) be published in a peer-reviewed journal. Articles were excluded if they were (1) conference proceedings or abstracts; (2) pre-post studies or randomized control trials (RCTs), which calculated a responsiveness index without using the control group information to minimize bias for inflation of the effect sizes 5 ; (3) studies with a sample size less than 10; and (4) studies that used measures that captured UE function as a single action (eg, box and blocks test, peg test). Single actions were not considered representative of the many actions involved in UE function. RCTs were excluded if they (1) used <2 UE functional outcome measures or (2) found no significant effects for UE function.
Data Extraction and Organization
Responsiveness indices were extracted or calculated from the included articles and subsequently organized into the 3 categories of change outlined by Beaton et al 1 : (1) observed change, (2) important change, and (3) detectable change (Figure 1). Observed change was further subdivided into (1) change over natural recovery (categorized into <3 months postinjury and ≥3 months postinjury) and (2) change in response to an effective treatment. Effect sizes were calculated based on the change score divided by the baseline standard deviation, and MDC values (MDC90, MDC95) were calculated based on the test-retest coefficient (intraclass correlation coefficient) and the baseline standard deviation. 6 In addition, MDC95%, which are independent of measurement units, were calculated to compare MDC values across measures. 7 We present the MDC95% using the 2 methods commonly cited in the rehabilitation literature: (1) MDC95/maximum score for the scale (eg, 57 points for Action Research Arm Test [ARAT]) and (2) MDC95/baseline mean of the sample.
RCTs that used at least 2 different functional outcome measures were used to estimate observed change in response to a treatment of known efficacy. This allowed for comparison of observed change across different measures within the same study by controlling for variation in treatment and sample characteristics. 8 To ensure that we were capturing observed change in response to an effective treatment, only RCTs that found a significant effect for at least one of the UE functional measures were included. Scatter plots of effect sizes were generated for a visual representation of one outcome measures’ relative ability to capture change compared with another measure in response to the same treatment with the same sample. When only median and range scores were provided, mean and standard deviation values were estimated using the method suggested by Hozo et al 9 to calculate an effect size.
Results
The search strategy yielded 1770 titles of which 68 met the inclusion criteria (Figure 2). The articles provided responsiveness data for 14 functional outcome measures.10-77 Table 1 displays the number of articles that provided responsiveness estimates for each measure. The ARAT, Motor Activity Log (MAL), Wolf Motor Function test (Wolf), and Stroke Impact Scale (SIS) were the 4 most frequently used measures among the included articles.
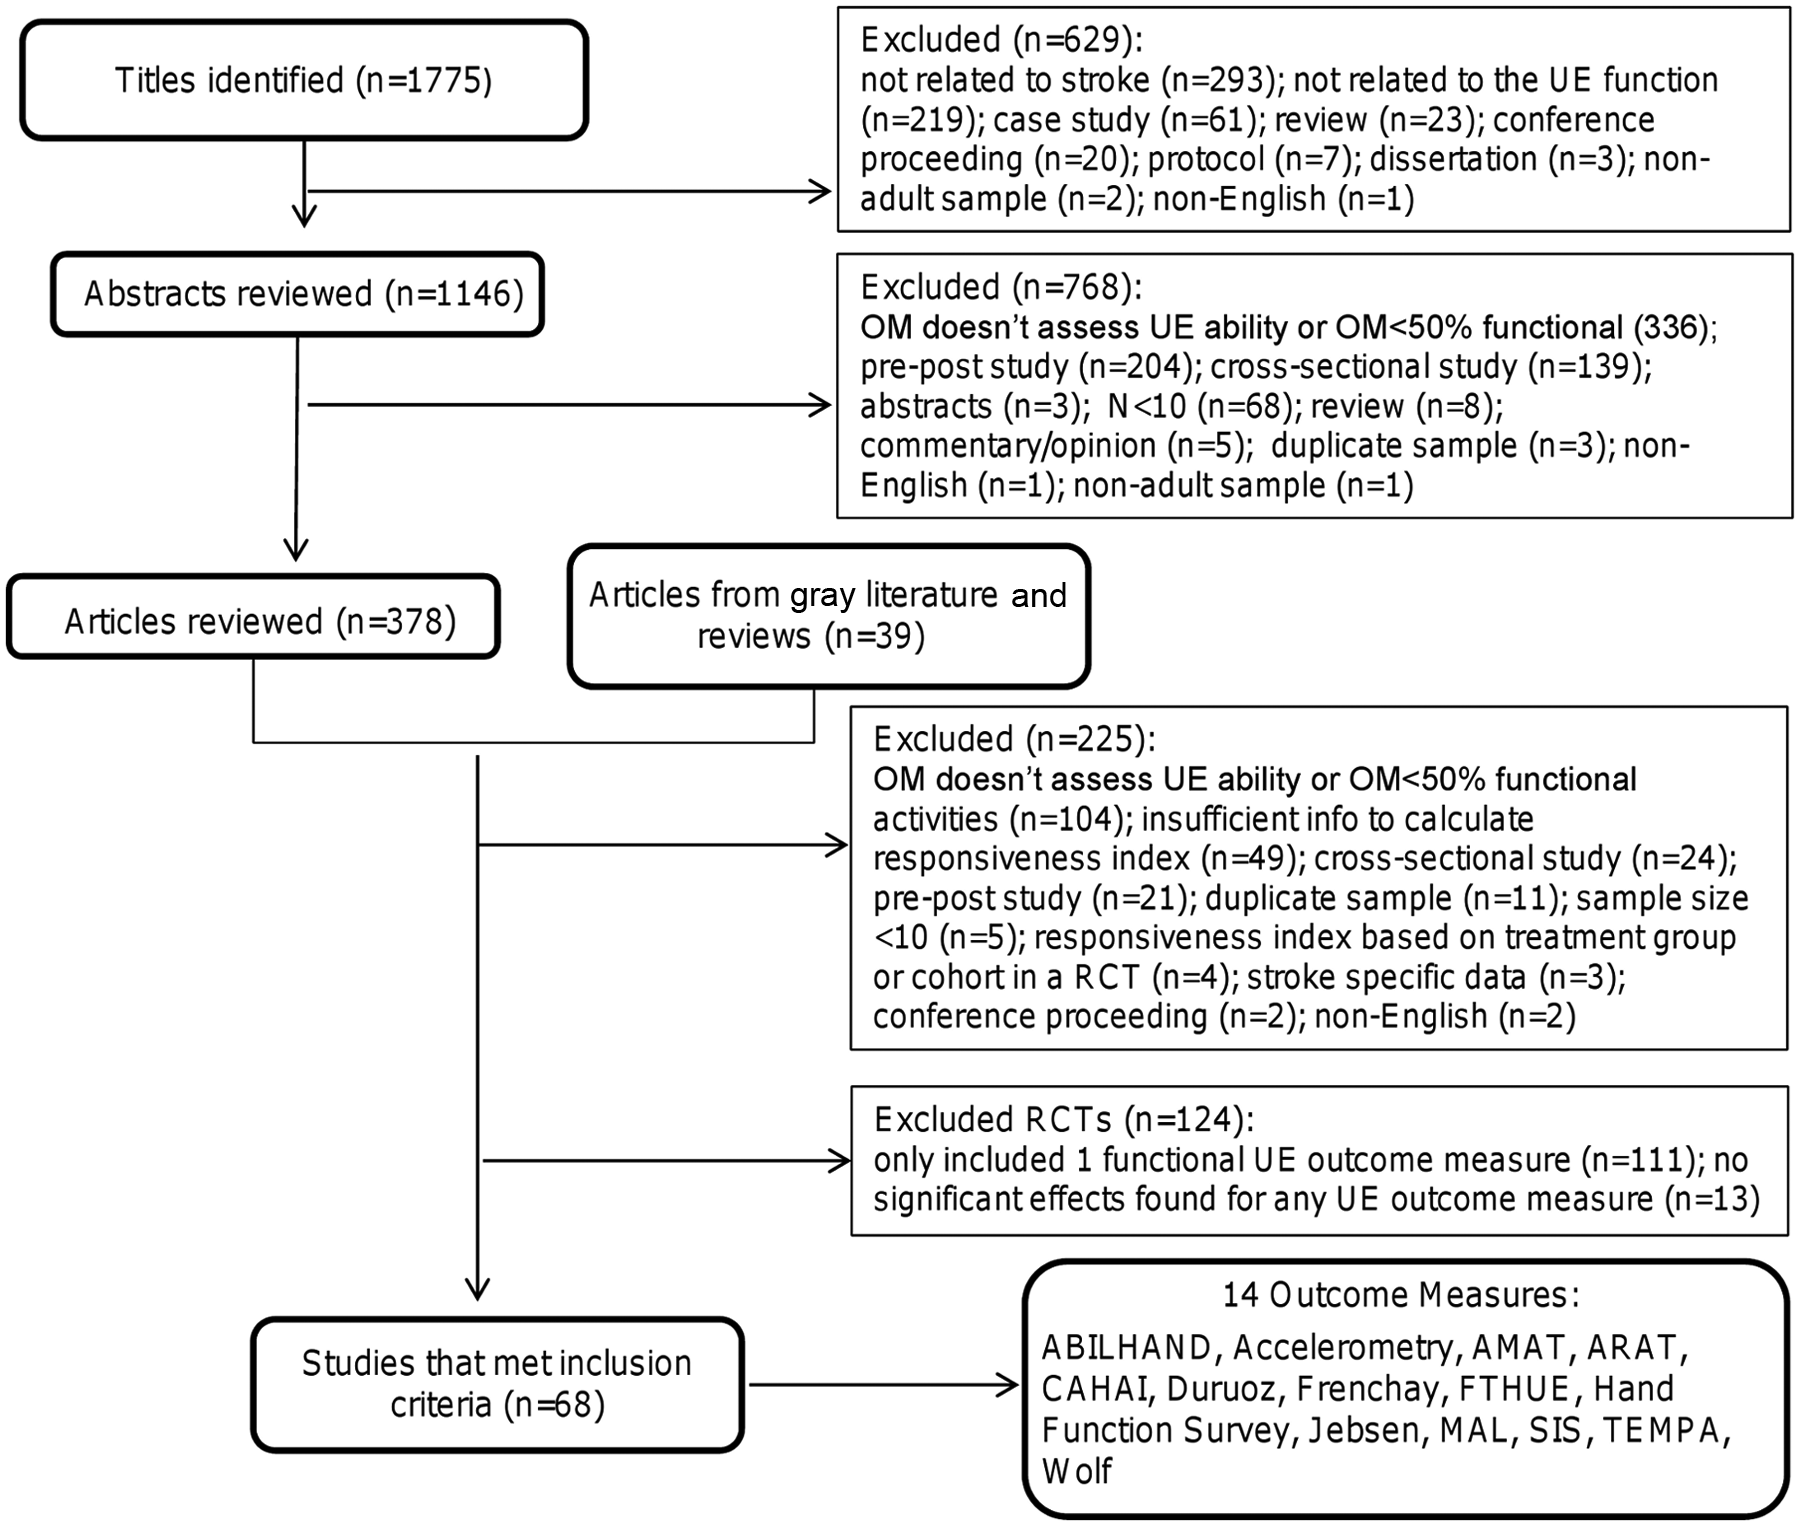
Flow diagram of process to select final list of included articles and outcome measures. Abbreviations: OM, outcome measure; AMAT, Arm Motor Activity Test; ARAT, Action Research Arm Test; CAHAI, Chedoke Arm and Hand Activity Inventory; Duruoz, Duruoz Hand Index; Frenchay, Frenchay Arm Test; FTHUE, Functional Test for the Hemiplegic Upper Extremity; Jebsen, Jebsen Hand Function Test; MAL, Motor Activity Log; SIS, Stroke Impact Scale; TEMPA, Upper Extremity Performance Scale for the Elderly; Wolf, Wolf Motor Function Test.
MCID Values Calculated by Distribution and Anchor-Based Methods a
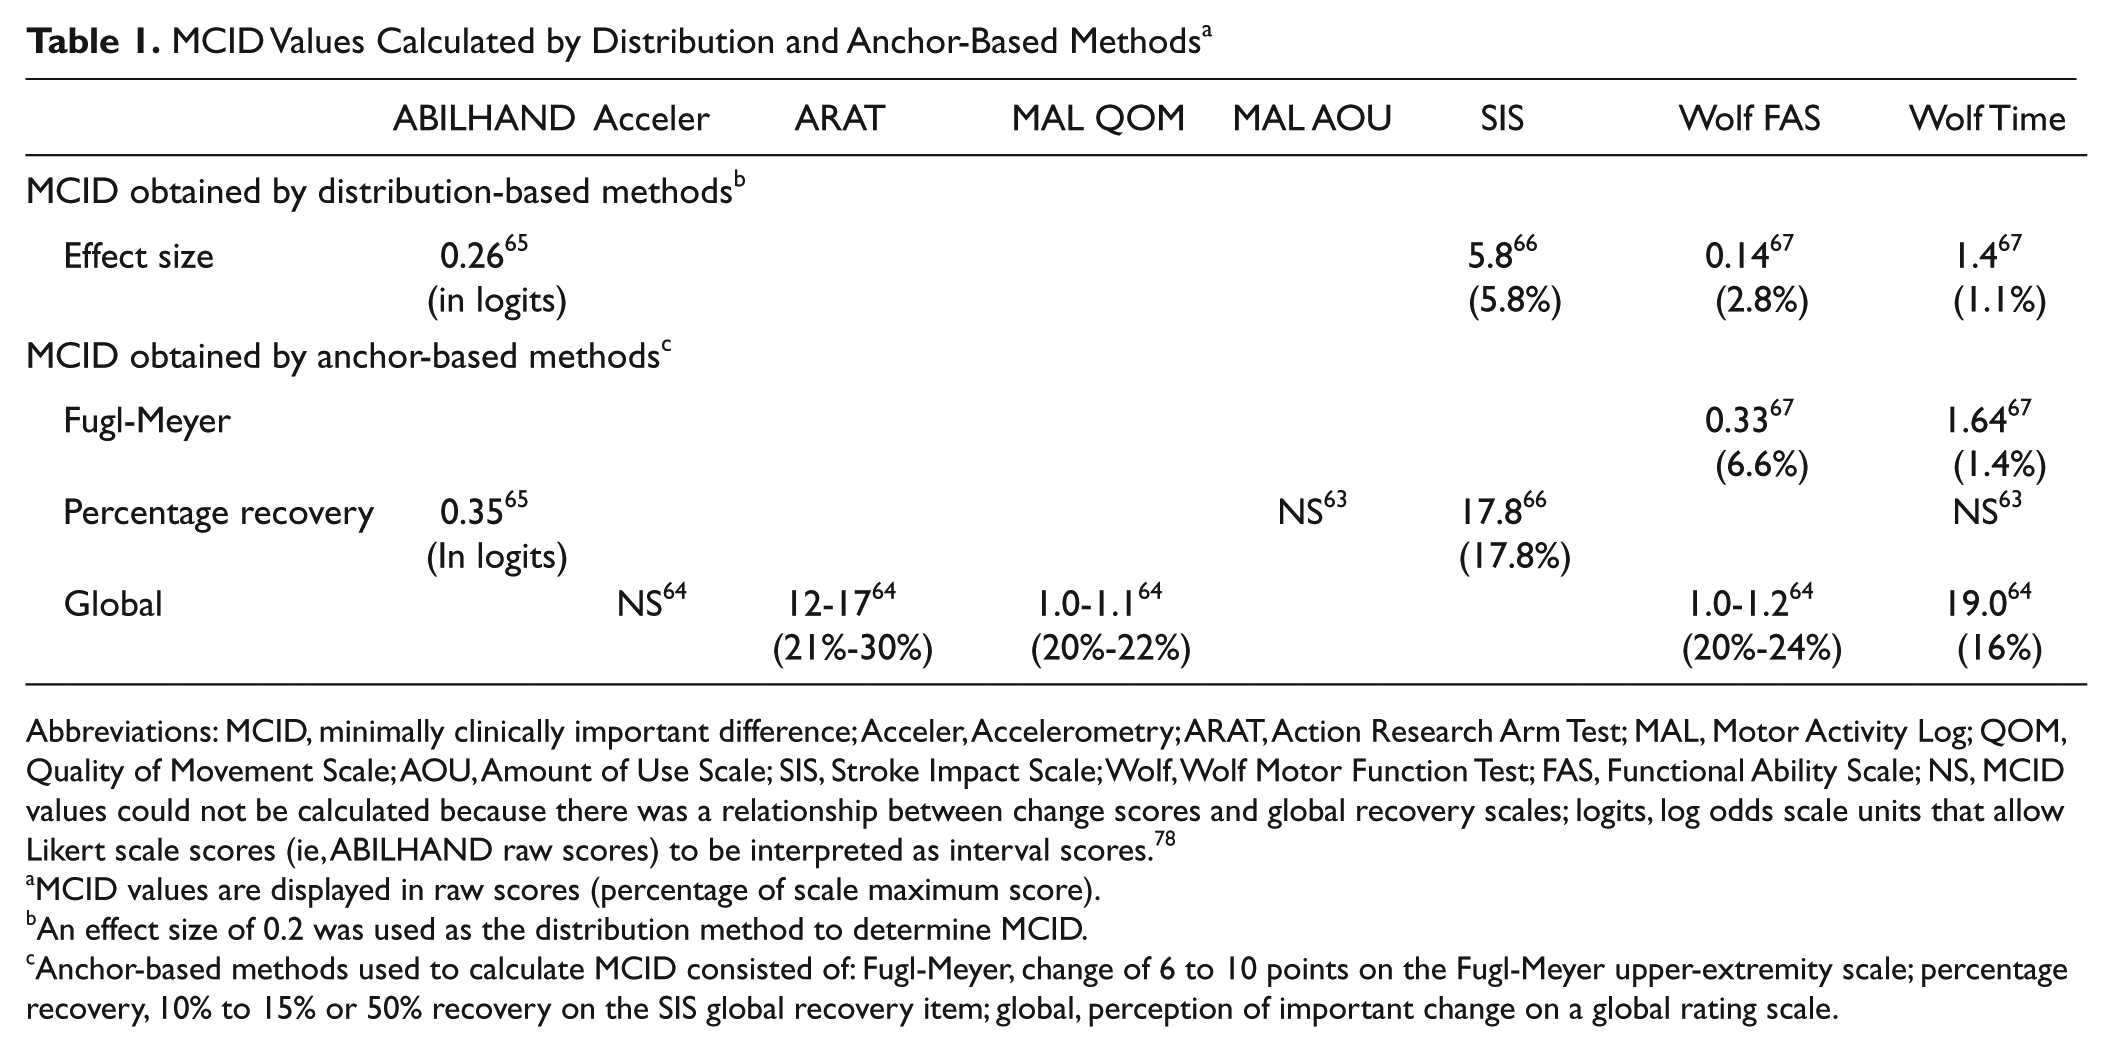
Abbreviations: MCID, minimally clinically important difference; Acceler, Accelerometry; ARAT, Action Research Arm Test; MAL, Motor Activity Log; QOM, Quality of Movement Scale; AOU, Amount of Use Scale; SIS, Stroke Impact Scale; Wolf, Wolf Motor Function Test; FAS, Functional Ability Scale; NS, MCID values could not be calculated because there was a relationship between change scores and global recovery scales; logits, log odds scale units that allow Likert scale scores (ie, ABILHAND raw scores) to be interpreted as interval scores. 78
MCID values are displayed in raw scores (percentage of scale maximum score).
An effect size of 0.2 was used as the distribution method to determine MCID.
Anchor-based methods used to calculate MCID consisted of: Fugl-Meyer, change of 6 to 10 points on the Fugl-Meyer upper-extremity scale; percentage recovery, 10% to 15% or 50% recovery on the SIS global recovery item; global, perception of important change on a global rating scale.
Observed Change
Observed change over natural recovery
Effect sizes that captured change over time of participants in standard care were extracted or calculated from 25 studies.10-34 It was found that 14 studies followed participants up to 3 months poststroke, and 10 studies followed participants up to 6 months poststroke. Because only 1 study followed participants past 6 months poststroke, we compared the effect sizes for participants at less than 3 months with those at greater than or equal to 3 months postinjury. The majority of studies had observation periods from 2 to 5 months.
Effect sizes calculated at a baseline of 1 to 3 months postinjury were larger and showed greater variance than effect sizes calculated at a baseline ≥3 months postinjury (Figure 3). This finding was evident when the duration of follow-up was similar between the 2 groups. Two studies17,25 considered the effect of stroke severity on observed changes over recovery; effect sizes were 2.0 to 2.6 times larger for individuals with less severe impairments at 1 to 2 months poststroke at study baseline. Three studies13,31,33 calculated effect sizes using 2 methods: population effect size (based on the change score divided by baseline standard deviation) and standardized response mean (based on the change score divided by the change score standard deviation) for the same measure. In all 3 studies, the effect sizes calculated as a standardized response mean were larger than when calculated as a population effect size (Supplementary Table 2).
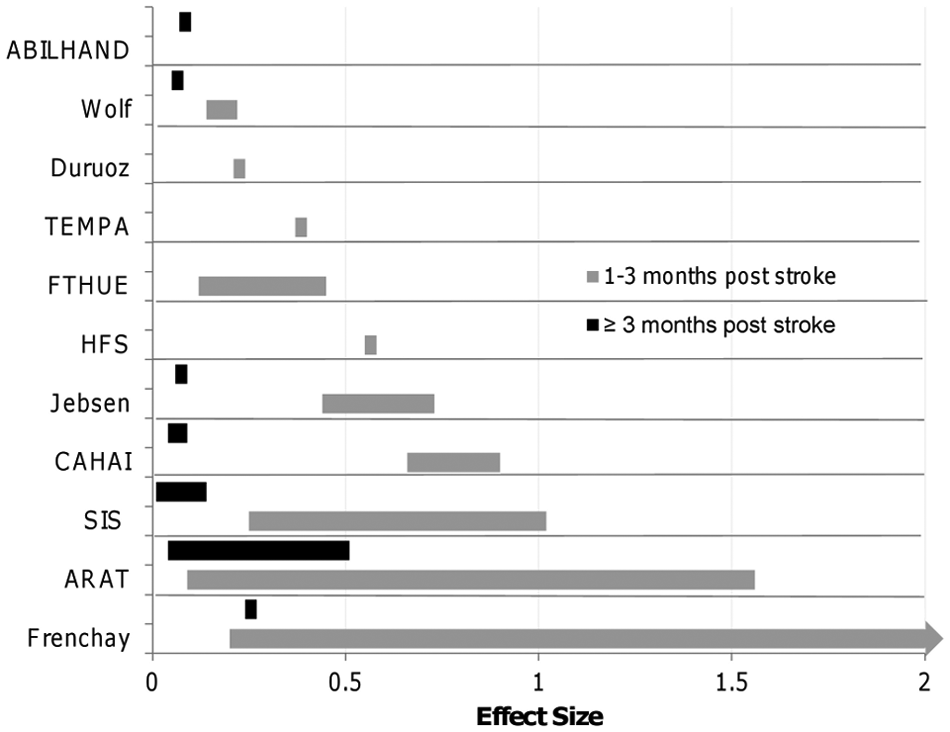
Effect sizes by measure calculated at <3 months and ≥3 months poststroke. The full range of the effect sizes for the Frenchay is 0.2 to 5. The bars on the graph represent the range of effect sizes calculated from studies that measured UE function across time.
Observed change in response to a treatment of known efficacy
A total of 28 RCTs used more than 1 UE functional outcome measure and obtained a significant effect for at least 1 of these measures. 35-62 These 28 RCTs were used to examine observed change of different measures in response to a treatment of known efficacy within the same study. Constraint-induced movement therapy (CIMT) was the most frequently studied intervention among the included RCTs (50%). Also, the majority of these studies (n = 23) used a laboratory-based performance measure (eg, ARAT, Wolf) in addition to a measure that captured perceived function in one’s own environment (eg, MAL, SIS). The most common outcome measures used together were the MAL with the ARAT (used in 7 studies)35-41 or MAL with the Wolf (used in 10 studies).42-51
The majority of effect sizes demonstrated close to a 1:1 relationship between the laboratory-based and patient-perceived functional measures within the same study (Figure 4). Effect sizes from studies that investigated CIMT36-38,46,47 and 1 study that examined the effect of mirror therapy for individuals with Complex Regional Pain Syndrome 43 did not demonstrate this 1:1 relationship. Effect sizes for the perceived effect (MAL) were 1.6 to 6.2 times larger than the functional changes (measured by ARAT or Wolf) in these studies.
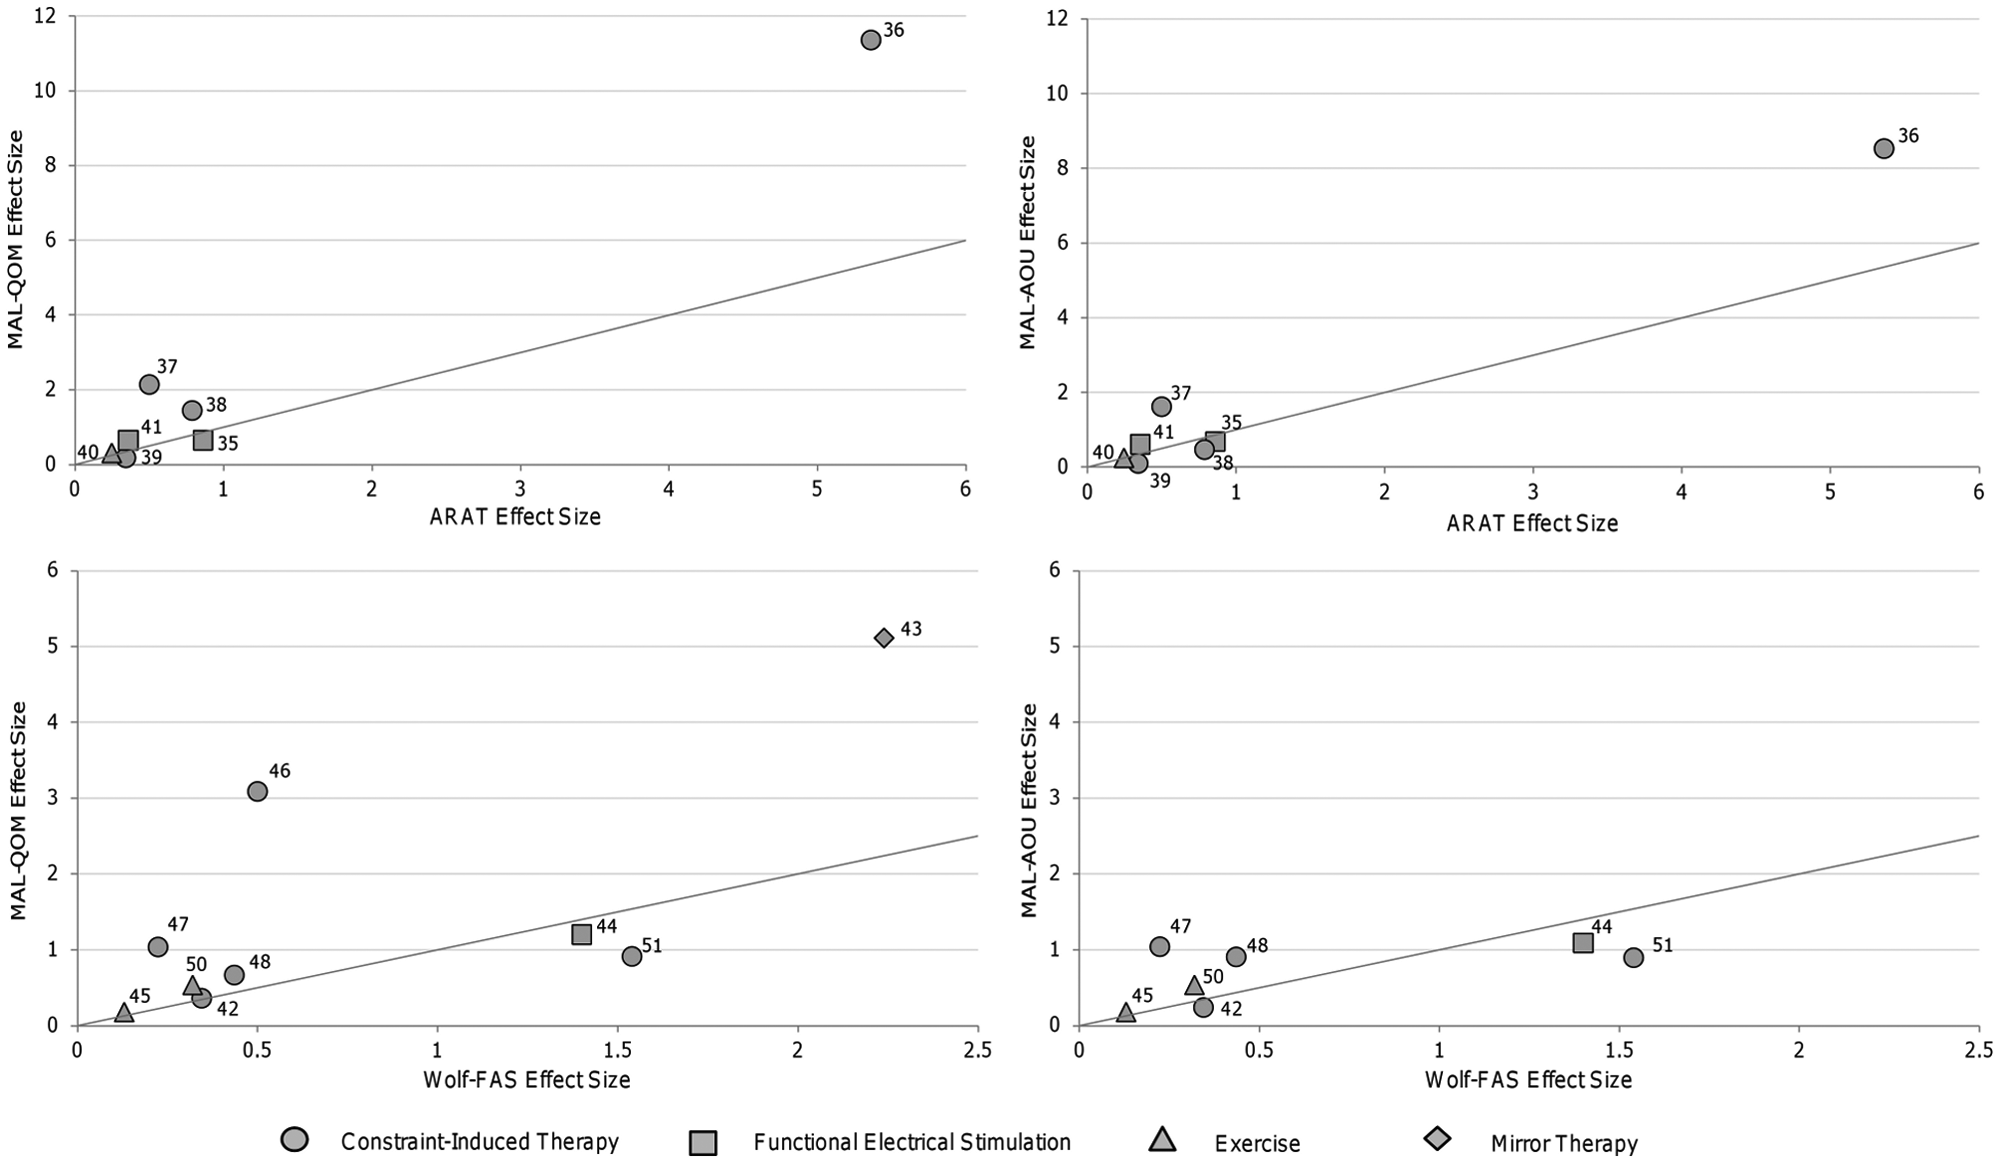
Comparison of observed change captured by lab-based versus patient-perceived functional measures. Points on the graph represent the effect sizes obtained from a single study. Lines on the graph represent a 1:1 relationship between the laboratory-based and patient-perceived functional measures. Laboratory-based measures are located on the x axes (ie, Wolf, ARAT). Patient-perceived functional measures are located on the y axes (ie, MAL).
Important Change
Five studies established important change (MCID) values for 6 functional outcome measures (see Table 1).63-67 All but 1 study calculated MCID values from CIMT trials.63,64,66,67 The other study investigated change following robotic therapy. 65 Four studies63,65-67 used individuals with chronic stroke, and 1 study sample consisted of individuals with acute stroke. 64
Three studies65-67 used a combination of anchor and distribution-based techniques, whereas 2 studies63,64 used only anchor-based methods to define important change. Anchor-based methods compare the change scores on the measure of interest with a comparative measure or anchor of important change. 79 The following anchors were used in the 5 studies: (1) a predetermined level on a global rating scale in which participants were asked to rate their perception of functional change 64 ; (2) a predetermined level of recovery on the SIS global recovery item63,65,66; and (3) a change score of 6 to 10 points on the UE portion of the Fugl-Meyer assessment. 67 Distribution-based methods determine important change based on the statistical distribution of the results. 79 Three studies used 0.2 times the standard deviation of the sample (ie, effect size of 0.2) to determine MCID values.65-67
Important change values displayed large variation, with values spanning from 1.1% to 30% of the tests’ maximum scores. The largest values were observed in the study that used a sample of individuals in the acute stage poststroke. 64 In addition, MCID values calculated using statistically derived distribution-based methods were substantially smaller (15%-88% less) than the values determined by anchor-based methods (Table 1). For example, the MCID for the SIS-hand ranged from a value of 5.8 using an effect size method (distribution method) to 17.8 using perceived amount of recovery on the global recovery question (participant-perceived anchor-based method) for the same sample of individuals. 66
Three studies were not able to establish MCID values because of nonsignificant relationships between the global recovery/rating scales and functional changes using the MAL,63,76 Wolf (time component),63,64 and accelerometry 64 (Table 1).
Detectable Change
Values needed to surpass measurement error, which are considered to represent true functional change (SEM, MDC90, MDC95, and limit of agreement values), were extracted or calculated from 16 studies for 9 measures.12,14,15,27,66-77 All studies used a test-retest methodology in which time frames in between assessments ranged from 1 day to 2 weeks; 9 studies used individuals with subacute stroke,14,15,27,68-70,72-74 and 7 studies used patients with chronic stroke.12,66,67,71,75-77 Also, 9 studies used a subsample of individuals from CIMT/forced-use trials66-72,76,77 of which 4 were from the EXCITE trial.68-70,72
MDC values at the 90% and 95% confidence levels ranged from 1.0% and 1.2% of the maximum score for the AMAT time subscale to 21.9% and 25.9% of the maximum score for the SIS hand, respectively. Relative to their sample means, MDC values at the 90% and 95% confidence levels ranged from 11.5% and 13.7% for the Wolf functional ability subscale to 72.5% and 86.7% for the MAL amount of use subscale, respectively. Detailed SEM, MDC90, and MDC95 estimates and their respective relative percentage values (ie, relative to the sample mean or relative to the scale maximum score) can be found in Supplementary Table 3 available online. Among the measures with multiple estimates, the values needed to surpass measurement error for tools that capture patient-perceived function (eg, MAL, SIS) were larger than laboratory-based performance measures (eg, Wolf, Chedoke Arm and Hand Inventory; Figure 5). This observation was present whether the MDC values were considered relative to the scale maximums or the sample means.
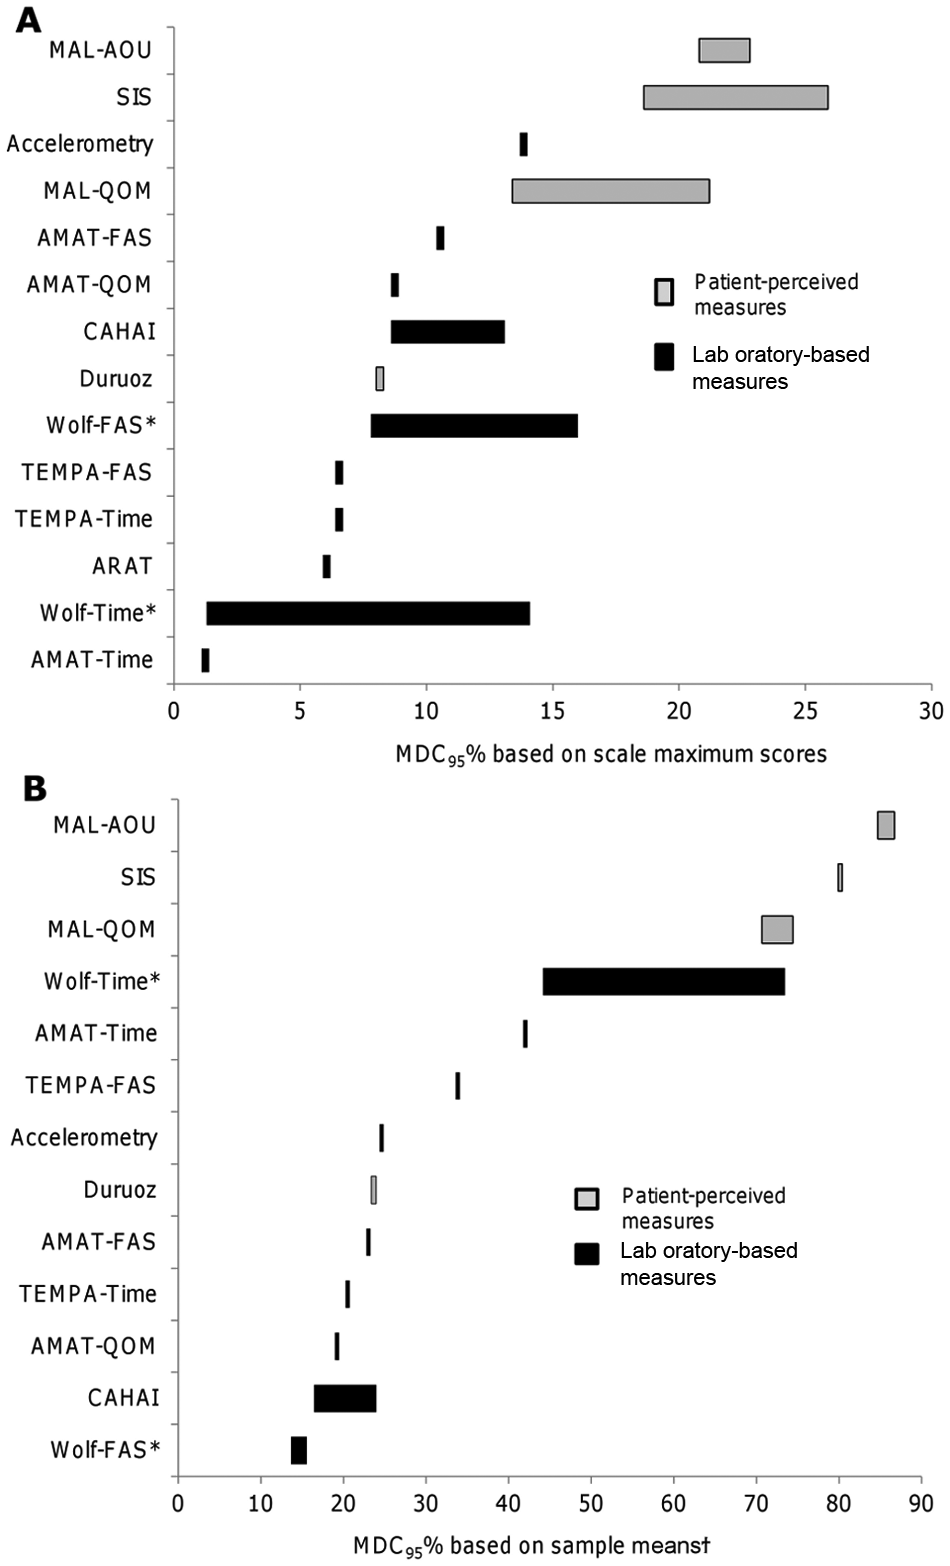
Comparison of detectable change (calculated at 95% confidence level) relative to the sample means and scale maximums. The bars beside each measure represent the range of MDC95% values extracted or calculated from different studies. *Two studies analyzed different subsets of the same sample to obtain multiple estimates. †Estimates for the ARAT, Wolf (FAS), and SIS are missing from this graph because sample means were not provided in 2 studies.12,66
Also, the values needed to surpass measurement error for patient-perceived performance measures were larger or on par with important change values. For instance, MDC and important change values for the SIS were as follows: 17.1 to 21.9 (MDC90) and 20.4 to 25.9 (MDC95) versus 5.8 (distribution-based MCID) or 17.8 (anchor-based MCID). MDC and important change values for the MAL were as follows: 0.56 to 1.06 (MDC90) and 0.67 to 1.27 (MDC95) versus 1.0 to 1.1 (anchor-based MCID).
Discussion
Examining the measurement of change in UE function served as a framework for understanding the measurement of functional recovery following stroke and revealed several novel findings related to the ability of outcome measures to capture change as it occurs.
Observed Change
For equal duration of follow-up, the effect sizes for natural recovery calculated at 1 to 3 months poststroke were substantially larger than those calculated at 3 months or later poststroke. The observed differences in effect sizes between these time phases likely reflect the higher degree of neuroplasticity, which has been documented early after stroke. 80 The effect sizes obtained in the RCTs using a population at >6 months poststroke ranged from 0.05 to 4.28, demonstrating that individuals are still capable of change at later time periods poststroke when receiving treatment. Of importance, our collective data demonstrate that rehabilitation treatments can affect patient perceptions of functional change as effectively as laboratory-based functional measures. In fact, CIMT is an exemplary treatment model where patient perceptions of change (MAL) were 1.6 to 6.2 times larger than effect sizes obtained with laboratory-based functional performance measures (ARAT or Wolf). A likely explanation is that CIMT was specifically designed to overcome learned nonuse, thereby targeting functional change in one’s own environment. Additionally, the higher relative effect sizes observed in the MAL following CIMT could also reflect patient bias. This bias could be present because of the large investment of time and effort required from the CIMT program. Finally, it should be noted that our observations concerning the relative ability of treatments to affect laboratory-based versus patient-perceived function may be limited to studies able to capture statistically significant effects.
Real-time accelerometry monitoring of UE activity in the home and community is a promising technology to objectively capture function in one’s own environment without the necessity of self-report. 81 However, only 1 study provided an estimate of true or important change for accelerometry measures. More studies are needed to better understand the usefulness of real-time activity monitors for capturing the effectiveness of UE rehabilitation interventions.
The influence of the method used to calculate effect sizes (ie, methods based on baseline standard deviation versus standard deviation of the change scores) was also revealed. Methods based on the change score standard deviation (ie, standardized response mean) produced estimates that were up to 1.2 to 1.9 times larger than those calculated based on the baseline standard deviation (ie, population effect size). The method of effect size calculation is an important contextual factor that must be considered when designing and interpreting research. This has particular importance for interpreting treatment effects and when performing sample size calculations. The observed influence of the calculation method also highlights the difficulty of using an effect size in isolation when making a judgment about a measure’s general responsiveness. 82
Important Change
A key finding was that important change values obtained through anchor-based methods (eg, based on patient opinion or comparative measures) were higher than those for the distribution methods (eg, statistical estimates) among the studies that used both approaches.65-67 In fact, the MCID of 1 measure (SIS) tripled in magnitude from the distribution-based to the anchor-based approach using the same participants. 66 Our results indicate that distribution methods result in smaller MCID, and researchers may be tempted to interpret their findings in light of this MCID, especially if the intervention has small effects. However, statistically driven distribution methods have been criticized for their lack of meaning to participants.1,83 The MCID values from anchor-based approaches are larger and may provide a challenge in finding therapies that can achieve this effect. Some have questioned whether it is realistic to achieve MCID values derived from patient-perceived global rating scales (anchor-based) because many factors (eg, recall bias, baseline characteristics, expectations of treatment, and question format) can affect patients’ perception of change.64,84 It has been suggested that a combination of anchor-based methods from patient and clinical perspectives be used to determine a MCID value, and distribution-based methods should only supplement this information. 83
Minimal Detectable Change
This synthesis highlighted important differences between laboratory-based and participant-perceived functional measures. Measures that capture perceived function in one’s own environment (eg, SIS, MAL) required larger values to surpass their measurement error than laboratory-based performance measures (eg, Wolf, ARAT). Although incorporating patient perspectives of functional change is an important component of capturing meaningful outcomes in neurorehabilitation research, 85 researchers should be aware of the larger sample size required to be able to capture true change using perceived function measures. Quality criteria guidelines recommend that the values needed to surpass measurement error calculated at a 95% confidence interval (ie, true change captured by MDC95) should be less than the minimum values considered to be important (ie, MCID). 86 In contrast, our study found that the MDC95 and MDC90 for patient-perceived functional measures (eg, MAL, SIS) were similar or greater than the MCID. There remains debate in the literature, however, concerning the best estimate of MDC values for self-report measures. Some researchers argue that MDC90 and MDC95 produce overly conservative estimates and recommend setting the MDC to 1 SEM.87,88
One of the limitations of this article is that there is no one standard approach for conceptualizing responsiveness. We used the broad taxonomy described by Beaton et al. 1 One international group (COSMIN) defined a narrower conceptualization of responsiveness, which used a longitudinal validity approach such as correlating change with an external criterion or determining the area under the receiver operating characteristic curve to distinguish between known groups. 82 In addition, whereas there are established appraisal guidelines for intervention studies (eg, PeDRO Score), consensus has yet to be reached with regard to assessing the rigor of studies that measure an outcome measure’s psychometric properties. Application of the Beaton taxonomy, which focuses on the nature of the change, provided a useful framework for understanding the state of the stroke literature in regard to the broader topic of measuring functional change. Effect sizes provided in this study can inform hypotheses for future responsiveness testing. Finally, ceiling and floor effects were also not considered in this review. Large ceiling and/or floor effects may indicate that there is a subsection of the population for which measures are not as responsive and is another factor that can bias estimates of important change values. 89 Given the contextual nature of responsiveness, the dominance of CIMT among the included studies should be noted. Samples from CIMT trials made up 80% of the important change articles, 56% of the detectable change articles, and 50% of the RCTs used to examine observed change in response to an effective treatment. Thus, the literature informing the ability of measurement tools to capture functional change in the UE poststroke may be biased in favor of those individuals who are eligible for CIMT trials.
Conclusions
In summary, this synthesis revealed important findings that have implications for the measurement and interpretation of UE functional recovery following stroke. The magnitude of important change or change that surpasses measurement error varied substantially depending on the method of calculation used. Our findings suggest that rehabilitation treatments can affect patient perceptions of functional change as effectively as laboratory-based functional measures; however, research studies may require higher sample sizes to account for the larger measurement error associated with patient-perceived functional measures. Future studies examining meaningful change in UE function in varied subgroups of individuals (ie, at different levels of stroke severity and stage of recovery) are needed.
Footnotes
Declaration of Conflicting Interests
The authors declared no potential conflicts of interest with respect to the research, authorship, and/or publication of this article.
Funding
The authors disclosed receipt of the following financial support for the research, authorship, and/or publication of this article: This work is supported by funding from the Canadian Health Institute of Research (CIHR MSH-63617) and Michael Smith Foundation of Health Research (JJE).