
Abstract
Background. Tissue-engineered nerve grafts (TENGs) constitute a promising alternative to nerve autografts that are recognized as the gold standard for surgical repair of peripheral nerve gaps. Objective. To investigate the feasibility of using TENGs for bridging extra large peripheral nerve gaps in large animals. Methods. TENGs were constructed by incorporating autologous bone marrow mesenchymal stem cells (MSCs) into a neural scaffold that consisted of a chitosan conduit inserted with poly(lactic-co-glycolic acid) (PLGA) fibers. A 60-mm-long sciatic nerve gap in dogs was bridged by TENGs, chitosan/PLGA scaffolds, or nerve autografts. At 12 months postsurgery, behavioral analysis, electrophysiology, retrograde fluorogold tracing, and histological examination were performed. Results. The outcomes of TENGs were similar to those of autografts and better than those of scaffolds alone. Conclusion. Introduction of autologous MSCs to a chitosan/PLGA scaffold improved the repair and rehabilitation of a large gap after peripheral nerve injury in dogs. Autologous MSCs may be a source of support cells for neural tissue engineering.
Keywords
Introduction
For peripheral nerve repair, tissue-engineered nerve grafts (TENGs) have been developed as a promising alternative to the autologous nerve grafts that are considered as the gold standard. 1 TENGs typically consist of a neural scaffold with support cells and growth factors. Typical scaffolds include a nerve guidance conduit (NGC) with or without lumen fillers.2-7 Following a peripheral nerve injury with a long gap between proximal and distal ends, axonal regeneration is highly restricted due to inhibitory molecules and the lack of growth-promoting cues, resulting in random growth patterns and aberrant innervation.8-11 In comparison to a neural scaffold alone, a scaffold with support cells can increase the length of a nerve gap that can be bridged. 1
Among a variety of support cells, Schwann cells (SCs) are the most important candidate because they are primary structural and functional glial cells and play a crucial role in peripheral nerve regeneration.12,13 The clinical use of SCs, however, are associated with many difficulties,14-17 which sparked interest in other sources of support cells. Bone marrow mesenchymal stem cells (MSCs) are pluripotent cells that localize in the stromal compartment of the bone marrow.18-22 MSCs can serve as support cells.23-28 We used a silicone NGC with MSCs for sciatic nerve regeneration in rats. 29 More recently, we repaired a 50-mm-long sciatic gap in dogs with a TENG of a chitosan NGC inserted with poly(lactic-co-glycolic acid) (PLGA) fibers and autologous MSCs. 30
To explore the maximum repair capacity of MSCs-based TENGs and obtain further evidence to support translation from experimental studies, we bridged a 60-mm-long sciatic nerve gap in dogs with TENGs that were also prepared by introducing autologous MSCs to a chitosan/PLGA scaffold. The regenerative outcomes of TENGs were evaluated by a combination of behavioral analysis, electrophysiology, retrograde tracing, and histological examination.
Methods
Animals
Twenty adult male Beagle dogs, weighing 8 to 10 kg, were provided by Yangzhou University (Yangzhou, Jiangsu Province, China). All experiments involving animals were carried out in accordance with the US National Institutes of Health guidelines for the care and use of laboratory animals and approved by the administrative committee of experimental animals of Jiangsu Province.
Harvest and Characterization of MSCs
Autologous MSCs were isolated and cultivated from dogs as described previously. 31 For cell characterization, MSCs at passage 2 were treated with 0.125% trypsin and 0.01% ethylenediaminetetraacetic acid (EDTA) for 5 minutes, washed with phosphate-buffered saline (PBS; 0.1 M, pH 7.4), and incubated with fluorescein isothiocyanate–labeled or phycoerythrin-labeled monoclonal antibodies against CD29, CD11b, CD34, CD45 (all from BD Bioscience, San Jose, CA), and CD133 (Miltenyi Biotec, Auburn, California), in dark at 4°C for 30 minutes, followed by phenotypic analysis with flow cytometry (BD FACScalibur, San Jose, California). In a separate experiment, the cells were treated with 0.125% trypsin and 0.01% EDTA, resuspended in PBS, and fixed with 70% cool ethanol overnight at −20°C; the fixed cell samples were centrifuged, washed, and stained with propidium iodide (PI)/RNase staining buffer (BD PharMingen, San Jose, California) for 30 minutes at 4°C and analyzed by flow cytometry.
TENG Construction
An NGC with an inner diameter of 5 mm, a wall thickness of 0.6 mm, and a length of about 60 mm was made up of chitosan (Nantong Xincheng Biochemical Company, Nantong, Jiangsu, China) as described previously. 6 A bundle of about 1000 PLGA fibers (14 µm in diameter and about 60 mm in length each; Holycon Biochemical Instrument Co, Nantong, Jiangsu, China) was threaded into the NGC lumen and pulled to form a longitudinal alignment by using a crochet hook, thus building a chitosan/PLGA scaffold. For implantation to a sciatic nerve gap, 2 ends of the NGC were anastomosed to the proximal and distal nerve stumps, which had penetrated into the NGC lumen about 1 mm, and PLGA fibers were fixed within the coaptations followed by trimming redundant fibers. Then, a suspension of autologous MSCs in saline at the cell density of ~1 × 10⁸/mL was injected from the distal coaptation until full occupation of the conduit lumen. Thus, implantation of TENGs was concomitant with their construction.
Surgical Procedure
After each dog was anaesthetized by intraperitoneal injection of sodium pentobarbital (30 mg/kg body weight), the sciatic nerve in the left lateral thigh was exposed by making a skin incision and splitting the underlying muscles. A segment of sciatic nerve was excised and removed, leaving a 60-mm-long gap following retraction of nerve stumps.
The dogs were randomly divided into 3 grafted groups and a nongrafted group (n = 5 in each group). The former included an autograft group, in which the resected segment of sciatic nerve was reimplanted into the nerve gap; a TENG group, in which the sciatic nerve gap was bridged by a TENG prepared as described (Figure 1A); and a scaffold group in which the sciatic nerve gap was bridged by a chitosan/PLGA scaffold alone. In a nongrafted group, the sciatic nerve gap was left untreated. The surgical incision in all animals was closed in a routine fashion, and the dogs were housed and fed the same.
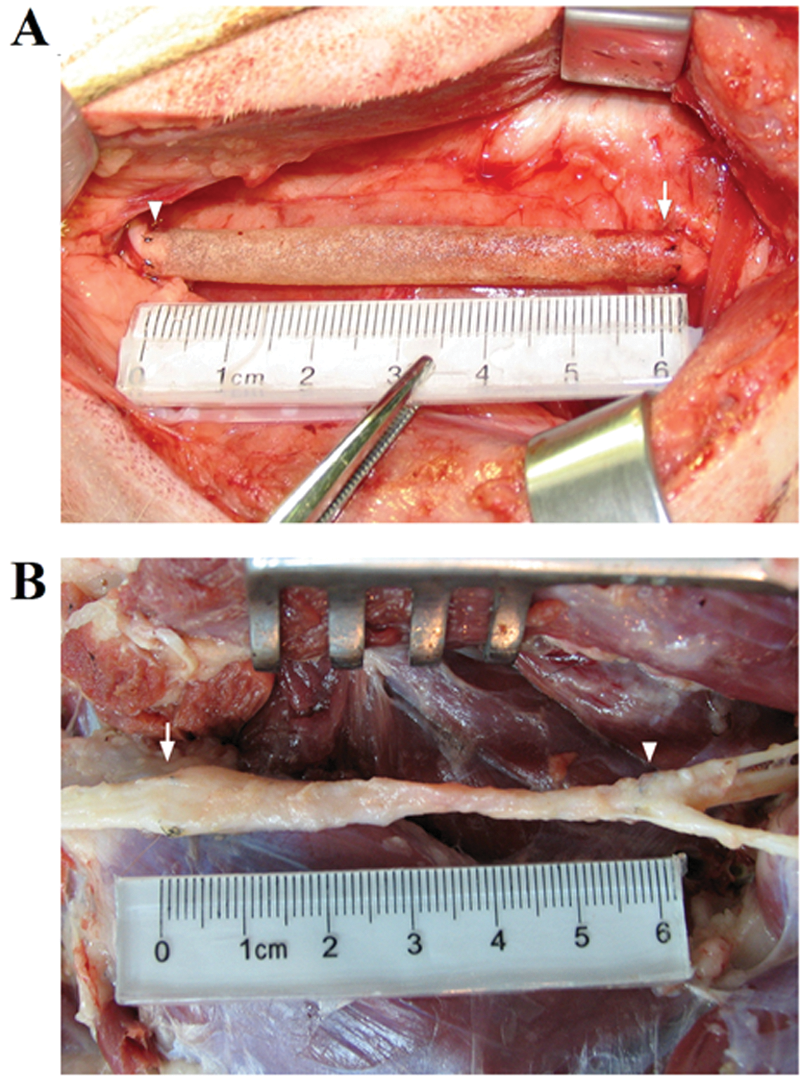
Gross view obtained immediately (A) and 12 months (B) after a tissue-engineered nerve graft was used to bridge a 60-mm gap in dog sciatic nerve. The proximal and the distal coaptations are indicated by an arrow and an arrowhead, respectively. Minimal scale: 1 mm.
Behavioral Analysis
Posture and gait were recorded with videotapes and photos over a 12-month period. To evaluate the motor function of the hind limbs, we used a scale proposed by Levine and colleagues 32 with some modification, in which the function score of hind limb ranges from 0 to 100: a score of 100, normal; a score of 0, complete paralysis of the hind limbs (D. Levine, Pelvic limb functional score, personal communication, 2004). All tests were accomplished by 2 investigators blind to the treatment who reviewed the videotapes and raw data files recorded at 1, 3, 6, 9, and 12 months postsurgery. The final score for each animal was the mean value of each investigator’s scores. This scale categorizes a combination of posture, muscle atrophy, hind limb movements, stair climbing, sit–stand transition, hind limb force, dancing, stand upright, and joint motion (see Supplementary Table 1, available online).
Electrophysiological Assessment and FluoroGold (FG) Retrograde Tracing
For electrophysiological tests, the sciatic nerve on the injured side was reexposed under anesthesia before electrical stimuli (10 mA in strength, 0.01 ms in pulse width) were applied to the nerve trunk at the proximal and distal ends sequentially, and compound muscle action potentials (CMAPs) were then recorded in the gastrocnemius belly on the ipsilateral side by using a portable digital MYTO electromyographic machine and Galileo NT System software (Esaote, Genua, Italy). CMAPs were also recorded on the contralateral uninjured side. The motor nerve conduction velocity (MCV) was calculated from the CMAP amplitude and the distance between the distal and proximal stimulated sites.
For FG retrograde tracing, 100 µL of 5% FG solution (Fluorochrome Inc, Denver, Colorado) was injected into the regenerated nerve trunk 10 mm from the distal end, and then the incision was closed. After survival for 2 weeks, animals were transcardially perfused sequentially with saline and 4% (v/v) paraformaldehyde in 0.1 M PBS. The spinal cord segments at L6, L7, and S1, together with the corresponding dorsal root ganglia (DRGs), were excised and cut into 30-µm-thick transverse sections (for spinal cords) and 20-µm-thick longitudinal sections (for DRGs) on a cryostat, followed by observation under a DMR fluorescent microscope (Leica, Wetzlar, Germany) with ultraviolet illumination and photography under a confocal laser scanning microscope (TCS SP2, Leica). The percentage of FG-labeled DRG sensory neurons was calculated by dividing the FG-positive cell number by the total neuron number, and the number of FG-labeled spinal cord motoneurons was directly counted. For neuron counting, serial sections were obtained from spinal cord specimens and divided into 4 parts according to the rule of counting 1 out of every 4 slides. Therefore, only a quarter of these spinal cord segments were counted and the total number of motor neurons in these 3 spinal cord segments was calculated. Both spinal cord and DRG sections displayed enough nonspecific background autofluorescence to help identify neuron bodies. Furthermore, only a FG-labeled neuron with relatively complete cell contour was counted under a fluorescent microscope.
Morphometric Analyses
The gastrocnemius and tibialis anterior muscles on both sides were harvested from deeply anesthetized animals, and the wet weight of muscles was measured. Several pieces were cut from the mid-belly of gastrocnemius muscle and embedded in paraffin. The procured 5-µm-thick transverse sections were prepared to undergo Masson trichrome staining followed by observation under light microscopy. Acetylcholinesterase (AChE) staining was applied to the longitudinal sectioned gastrocnemius muscle followed by visualization under light microscopy as previously described. 33
Afterward, animals were transcardially perfused. The regenerated nerve, together with 2 nerve segments 20 mm beyond the 2 ends of the graft, were dissected out. The contralateral uninjured sciatic nerve served as a control. Transverse sections from the distal portion of regenerated nerve were obtained (Figure 7A). They were subjected to Meyer modified trichrome staining followed by visualization under light microscopy, and photographs were taken with a DFC 300FX color digital camera (Leica) as described previously. 6 They also underwent immunofluorescent double-staining with rabbit anti-S100 polyclonal antibody (1:400 dilution) and mouse anti-NF200 monoclonal antibody (1:400 dilution, both from Sigma, St Louis, Missouri), in which the primary antibodies were added to allow incubation at 4°C overnight, followed by further reaction with TRITC-labeled secondary antibody goat anti-rabbit IgG (1:200) and FITC-labeled secondary antibody goat anti-mouse IgG (1:200, Gibco) at 4°C overnight, and the sections were observed under a fluorescent microscope (DMR, Leica).
The nerve and muscle specimens were respectively harvested from 3 randomly selected animals of each group in the same way and cut into ultrathin sections for staining with lead citrate and uranyl acetate and observation under a transmission electron microscope (Jeol, Tokyo, Japan) as described previously. 6
The nerve and muscle specimens were further subjected to morphometric analysis by using a Q550 IW image analysis system (Leica Imaging Systems Ltd, Cambridge, England) and Leica QWin software package as described previously. 6
Statistical Analysis
All data were expressed as means ± standard deviation. Unless otherwise stated, we conducted 1-way or 2-way (factorial) analysis of variance (ANOVA) for data statistics and subsequently used post hoc Scheffé and Bonferroni t tests for pairwise comparisons between groups. The method details are described in the figure legends. The statistics procedures were carried out using SPSS software package (SPSS Inc, Chicago, Illinois), and significance levels were set at P < .05.
Results
Characterization of MSCs
MSCs were isolated from the bone marrow of dogs according to cell adhesion to plastic and used for the same dog. In primary culture, a morphologically homogeneous population of spindle-like, small rounded, large flattened cells was observed. From passage 2, MSCs grew rapidly, more than 90% of cells showed a spindle-like shape and retained high proliferative potential (Figure 2A). To confirm the identity of MSCs, cell phenotype analysis indicated that most of the cells were positive for CD29 but negative for CD11b, CD34, CD45, and CD133 (Figure 2B); cell cycle analysis showed that 60% to 70% and 30% to 40% of MSCs were at G0-G1 and S phase, respectively (Figure 2C). Based on previous studies,29,34 MSCs at passage 2 were used throughout this study due to their high efficacy of promoting nerve regeneration.
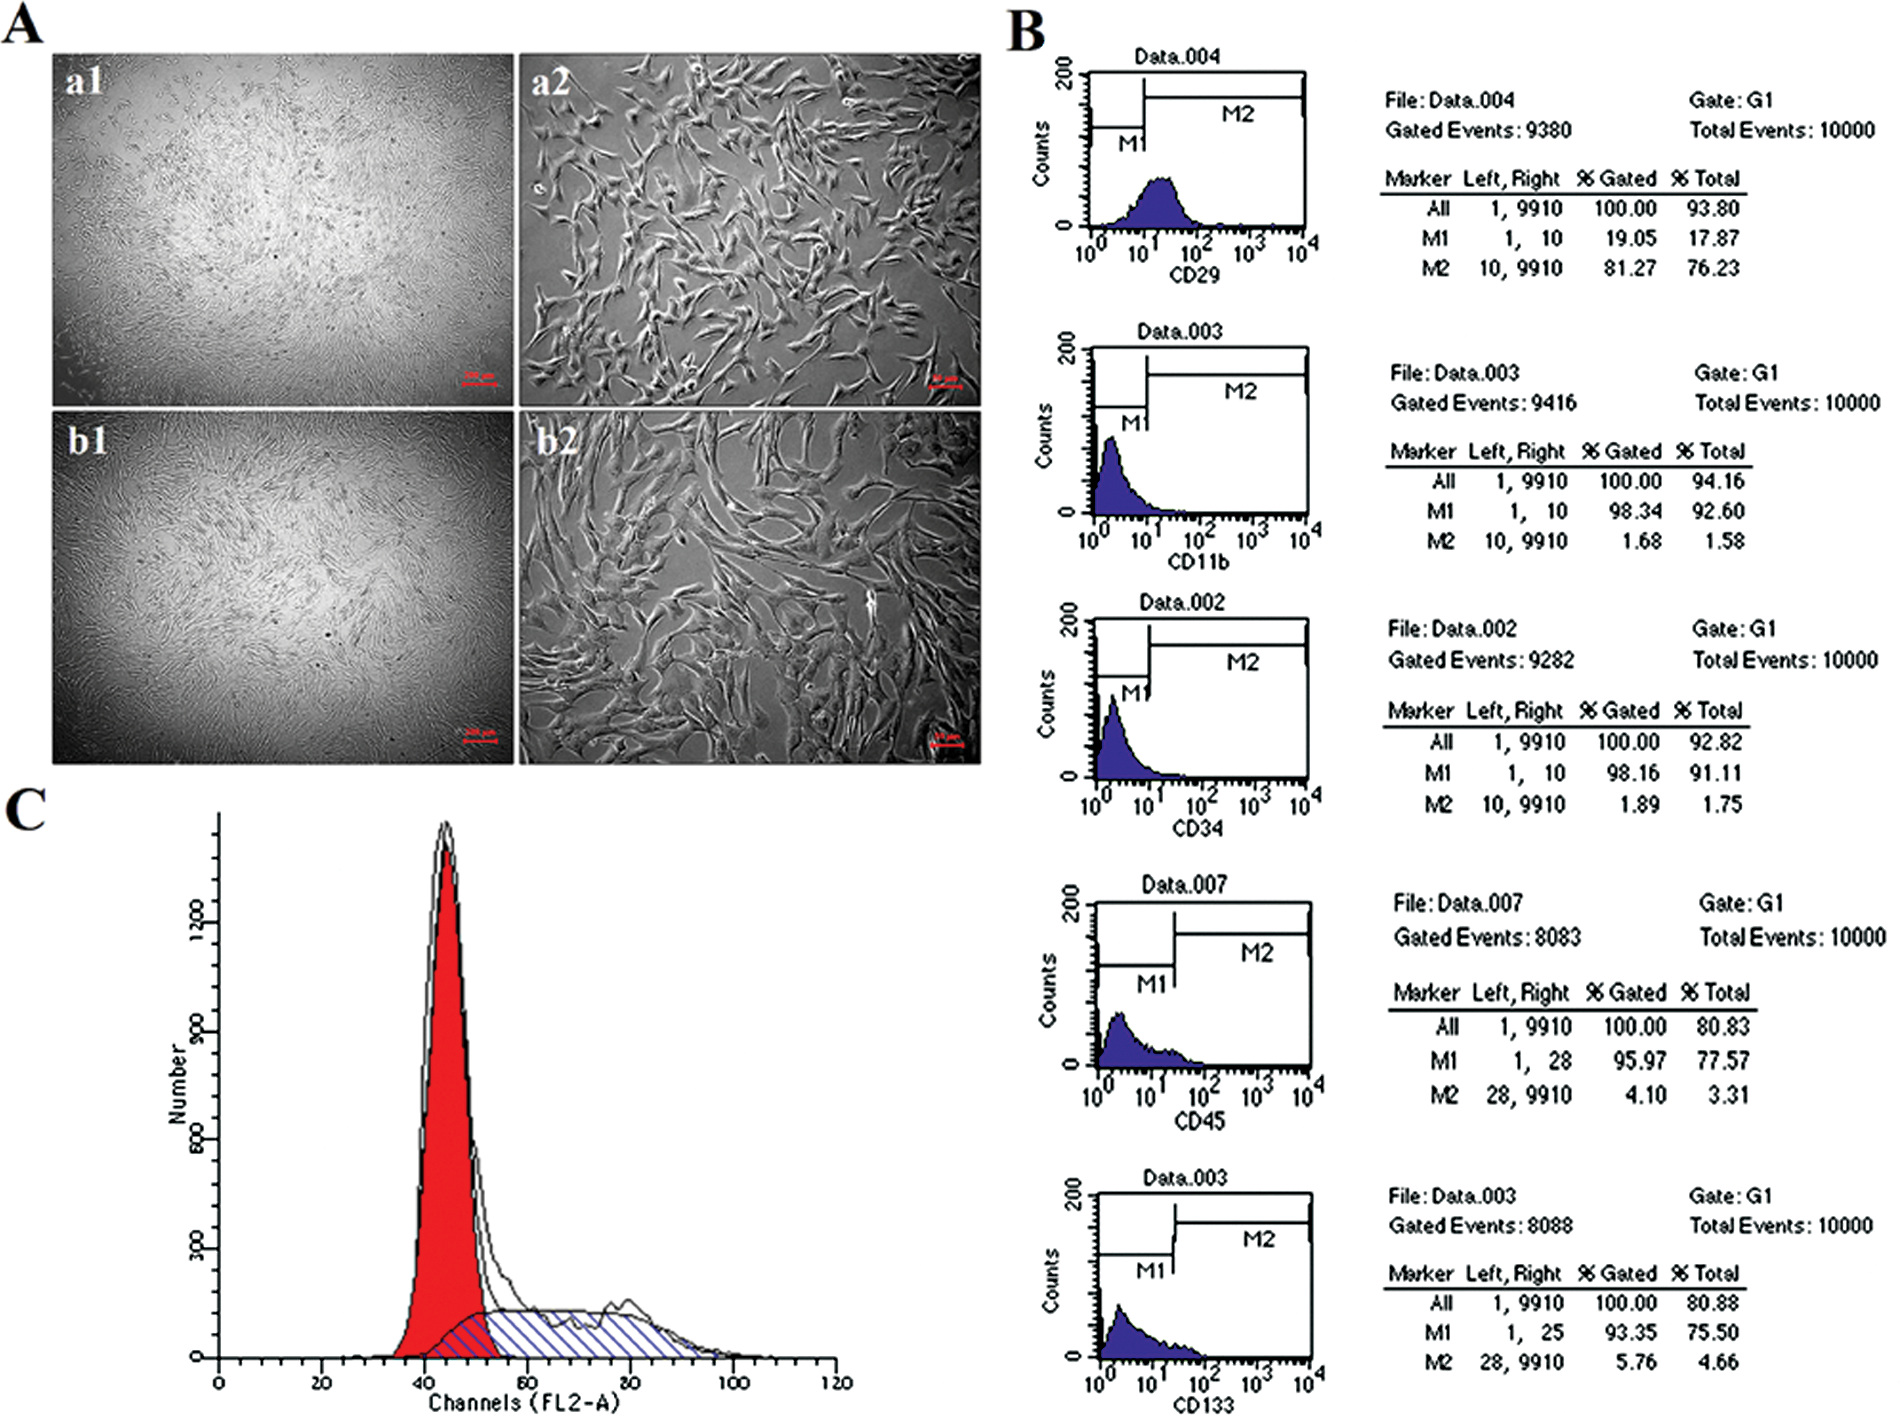
Characterization of mesenchymal stem cells (MSCs) harvested from dogs. (A) Light micrographs of MSCs in primary culture for 10 days (a1, a2) and MSCs at passage 2 for 3-day culture (b1, b2). Scale bar: 200 and 50 µm for (a1, b1) and (a2, b2), respectively. (B) Flow cytometry showing that MSCs were positive for CD29 and negative for CD11b, CD34, CD45, and CD133. (C) Flow cytometry indicating the proportion of MSCs (at passage 2) in different phases of cell cycle.
Hind Limb Motor Function Scores
The dogs in the 3 grafted groups showed no obvious signs of systemic or regional inflammation postsurgery. According to behavioral analysis, the 3 grafted groups, unlike nongrafted animals, exhibited a gradual increase in the hind limb function score over 12 months and no significant differences from 1 to 6 months postsurgery. The hind limb function score was significantly higher in TENG and autograft groups than in the scaffold group from 9 to 12 months postsurgery; furthermore, the hind-limb function score in TENG and autograft groups were similar to each other throughout the 12-month period (Figure 3).
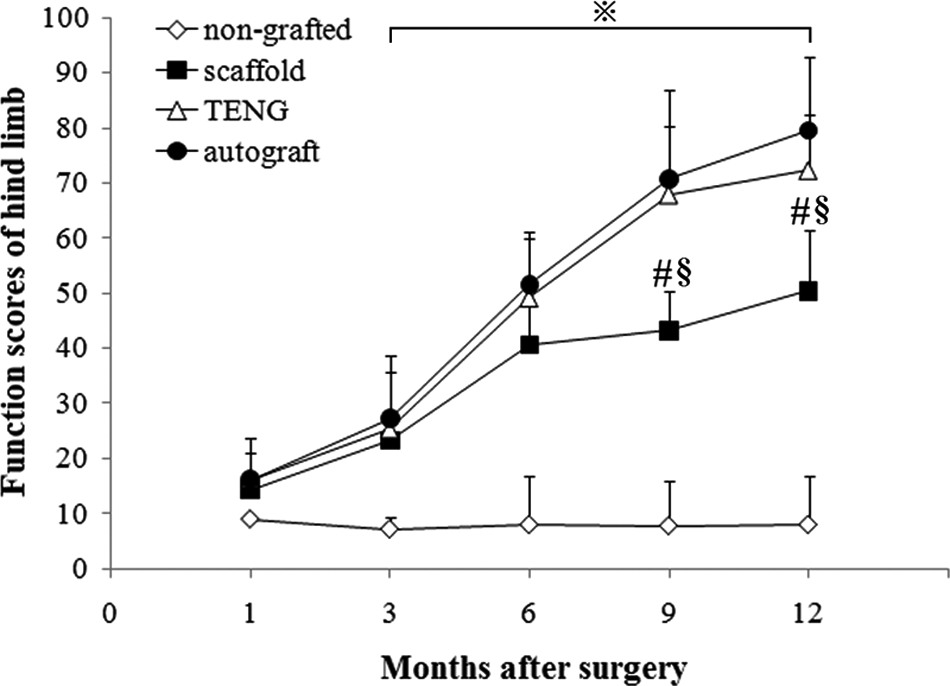
Time course of functional recovery assessed using the hind limb function score. Values represent means ± standard deviations. Two-way ANOVA, in which one factor was time points and the other was grouping, and post hoc Bonferroni t test were used to analyze the data. #P < .05 versus autograft group, §P < .05 versus tissue-engineered nerve graft (TENG) group, and ※P < .05 versus nongrafted group.
Functional Recovery Evaluation
To examine the restoration of electrophysiological properties at 12 months postsurgery, CMAPs and motor nerve conduction velocities were determined on the injured side versus the contralateral uninjured side. As expected, no CMAP was recorded on the injured side of nongrafted dogs. In contrast, CMAP values were detected on the injured side of 3 grafted groups (Figure 4A-C) and on the contralateral uninjured side (Figure 4D). There were no significant differences in the CMAP amplitude between 3 grafted groups (Figure 4E). As for the MCV, despite no significant difference between autograft and TENG groups, the parameter in the scaffold group was significantly lower or lower than that in the autograft or TENG group, respectively (Figure 4F; see Supplementary Material for data). In addition, the 2 electrophysiological parameters detected on the injured side of 3 grafted groups were lower than those on the contralateral uninjured side (Figure 4E and F), respectively.
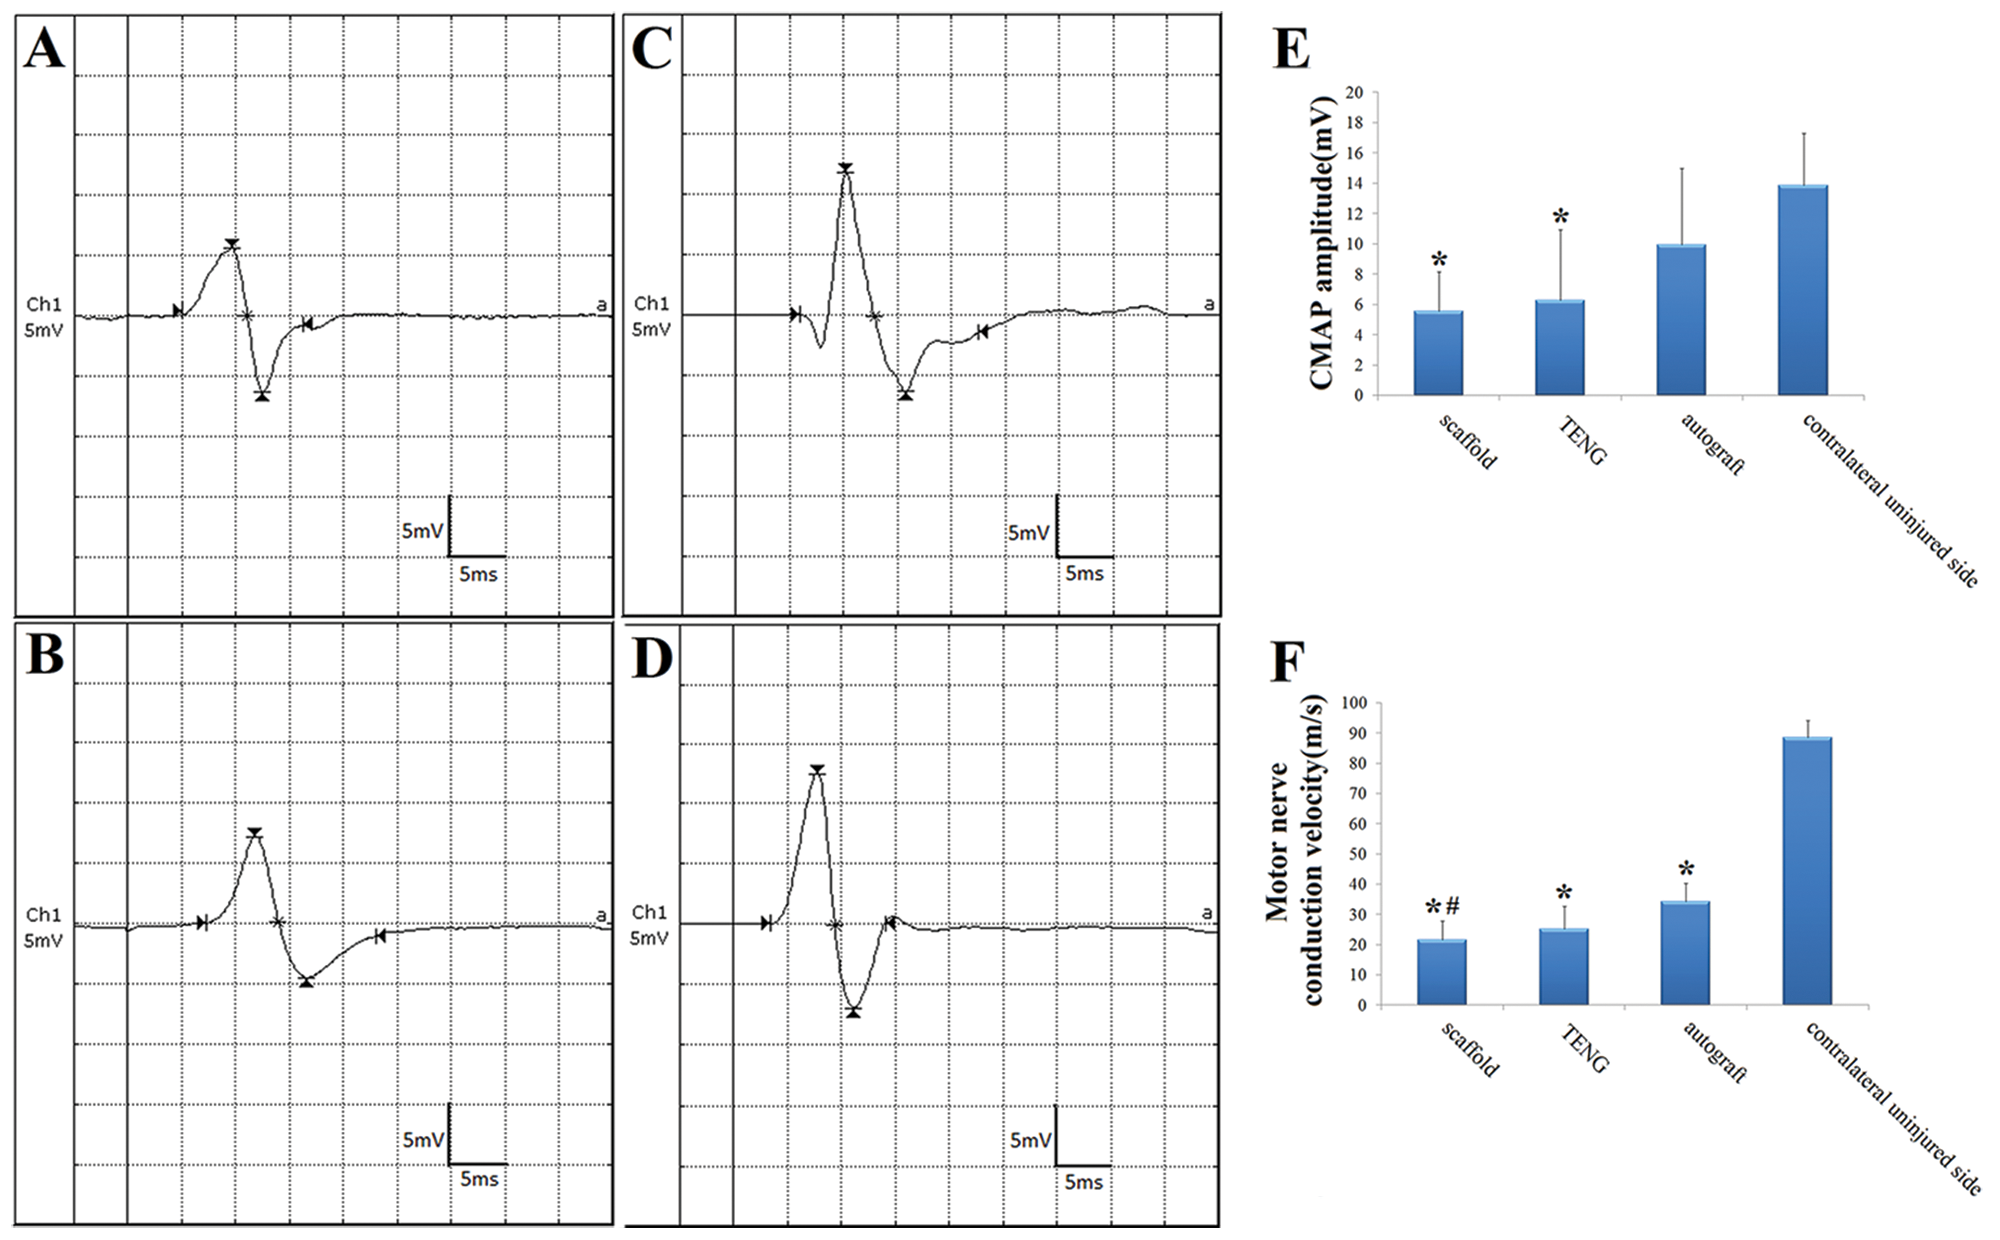
CMAP examinations carried out 12 months postsurgery. CMAP, compound muscle action potential; TENG, tissue-engineered nerve graft. Representative recordings detected on the injured side of dogs in scaffold (A), TENG (B), and autograft (C) groups and on the contralateral uninjured side (D). No reproducible CMAPs were detected in the nongrafted group. Histograms showing the CMAP amplitude (E) and motor nerve conduction velocity (F) for 3 grafted groups, respectively. All data are expressed as means ± standard deviations. One-way ANOVA plus post hoc Scheffé test were used to analyze the data. *P < .05 versus contralateral uninjured side, and #P < .05 versus autograft group.
FG-labeled sensory and motor neurons, respectively, appeared within DRGs and the anterior horn of spinal cord ipsilateral to the injured side of 3 grated groups (Figure 5A), and the golden-colored fluorescence was concentrated in the cell body of neurons. No significant difference was found in the total number of FG-labeled motoneurons between 3 grafted groups (Figure 5B); no significant difference was found in the percentage of FG-labeled sensory neurons between autograft and TENG groups, but the percentage of FG-labeled sensory neurons was significantly smaller in the scaffold group than in TENG or autograft group (Figure 5C; see Supplementary Material for data).
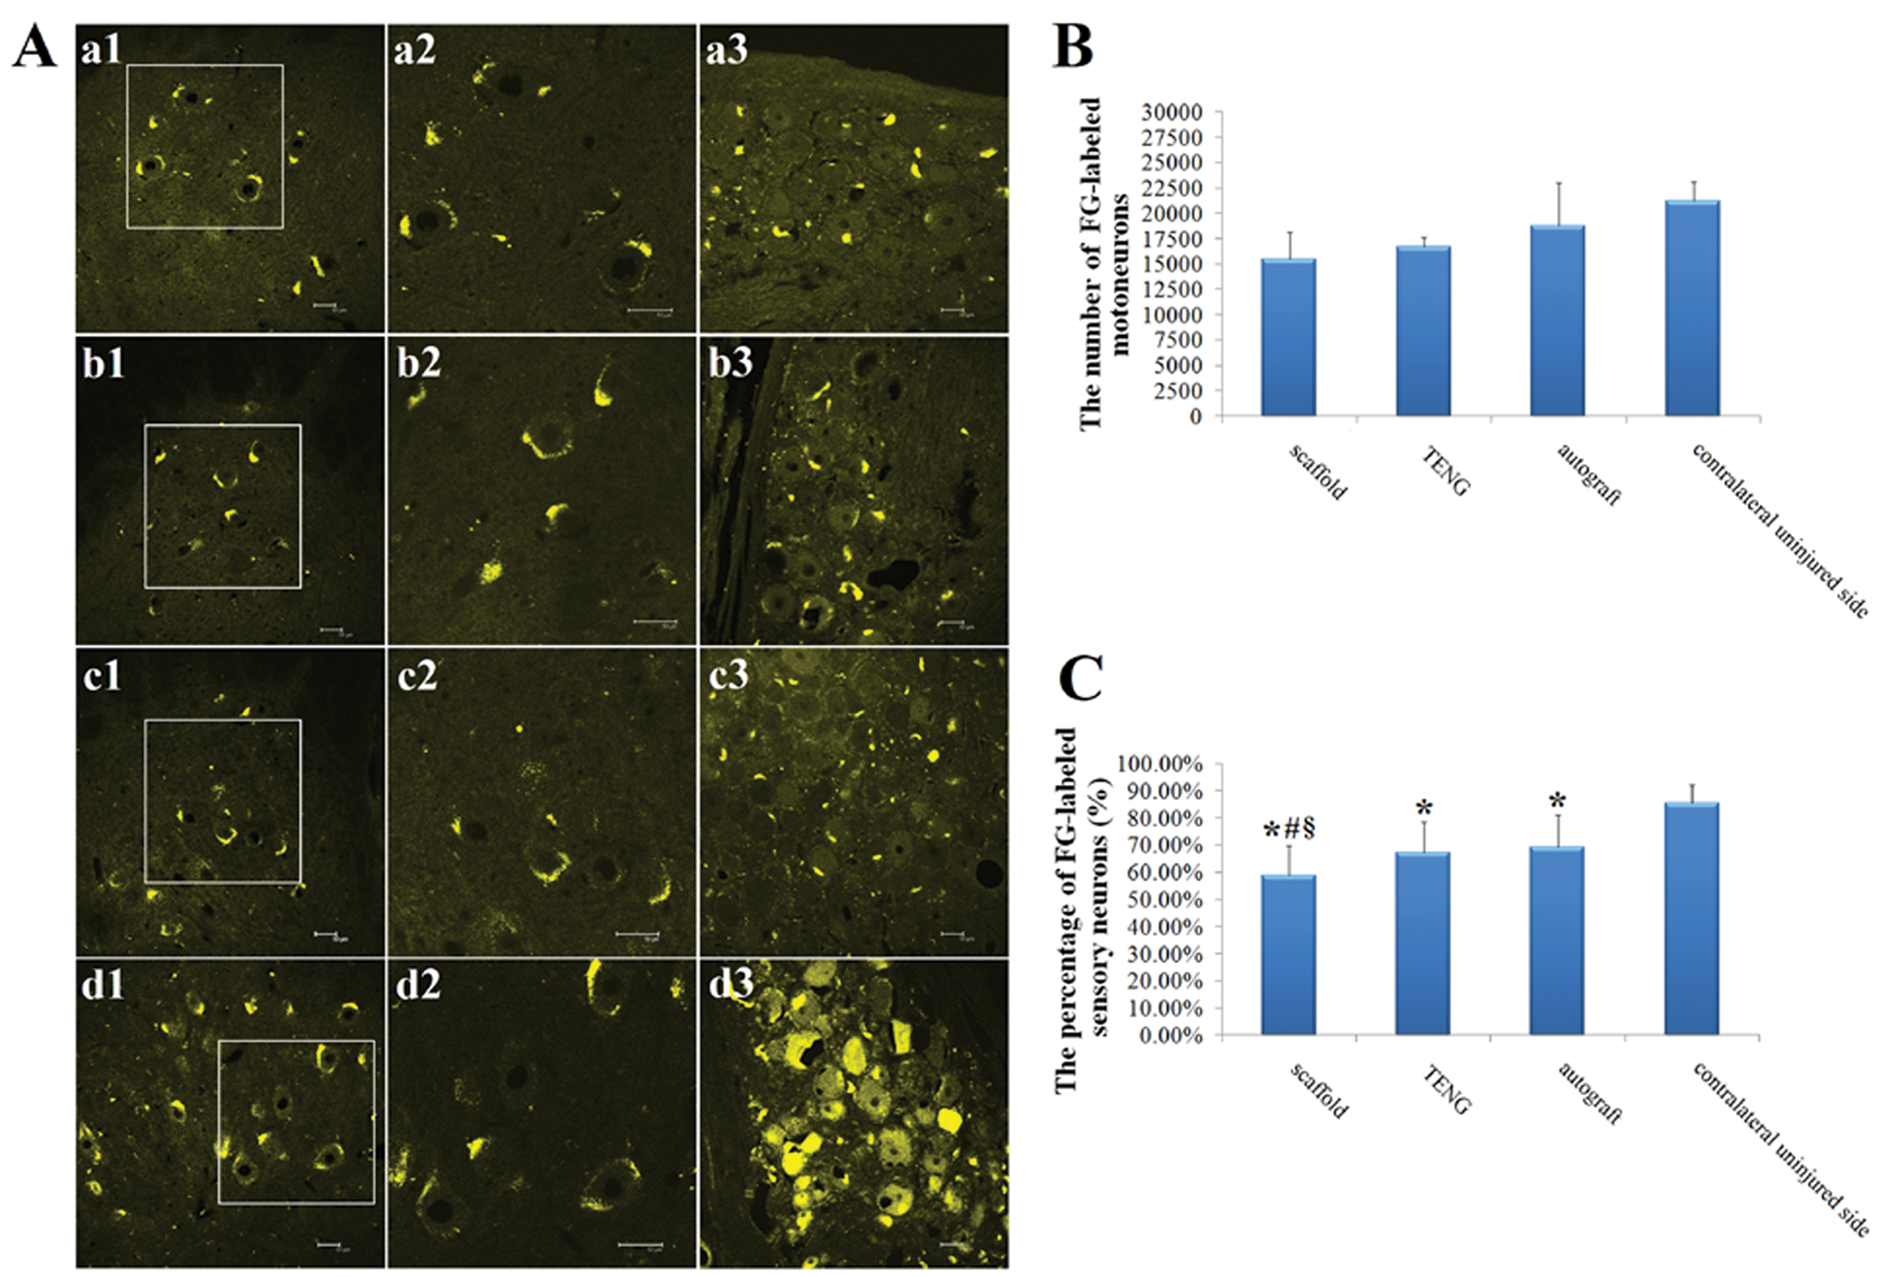
Representative light micrographs (A) following FluoroGold (FG) retrograde tracing on the side ipsilateral to one of the injured dogs in scaffold (a1-a3), tissue-engineered nerve graft (TENG; b1-b3), and autograft (c1-c3) groups and on the contralateral uninjured side (d1-d3). FG retrogradely labeled motor neurons in spinal cord (a1-d1) and sensory neurons in dorsal root ganglia (DRGs; a3-d3) were observed at 12 months postsurgery. The higher magnifications of the boxed areas in (a1-d1) are shown in (a2-d2), respectively. Scale bar: 50 µm. Histograms (B and C) showing the total number of labeled spinal cord motor neurons and the percentage of labeled DRG sensory neurons, respectively. All data are expressed as means ± standard deviations. One-way ANOVA plus post hoc Scheffé test were used to analyze the data. *P < .05 versus contralateral uninjured side, #P < .05 versus autograft group, and §P < .05 versus TENG group.
Histological Observation and Morphometric Analysis of Regenerated Nerves
Gross view
In TENG or scaffold group, the nerve graft was degraded, absorbed, and replaced by a tissue with nerve-like appearance, which continuously bridged the 60-mm gap in sciatic nerve and linked up 2 nerve stumps. The regenerated nerve in TENG group (Figure 1B) displayed no obvious enlargements at each junction when compared with that in the scaffold group.
Light microscopy
Meyer trichrome staining and immunofluorescent double staining with anti-neurofilament and anti-S100 were used to investigate the regenerated nerves at 12 months postsurgery. On the transverse nerve sections taken from TENG or scaffold group, numerous blood vessels occurred, and massive bundles of myelinated nerve fibers double-labeled by NF (an axon marker) and S-100 (a SC marker) were observed (Figure 6B: b1-b3 and 6B: c1-c3). On the transverse nerve sections taken from autograft group, most of the regenerated nerve fibers entered the original fascicles provided by nerve autografts (Figure 6B: d1-d3). On the transverse nerve sections taken from nongrafted group, however, only obvious hyperplasia of connective tissues and disoriented arrangement of fusiform cells in degenerated fascicules, but no regenerated nerve fibers, were visible (Figure 6B: a1-a3).
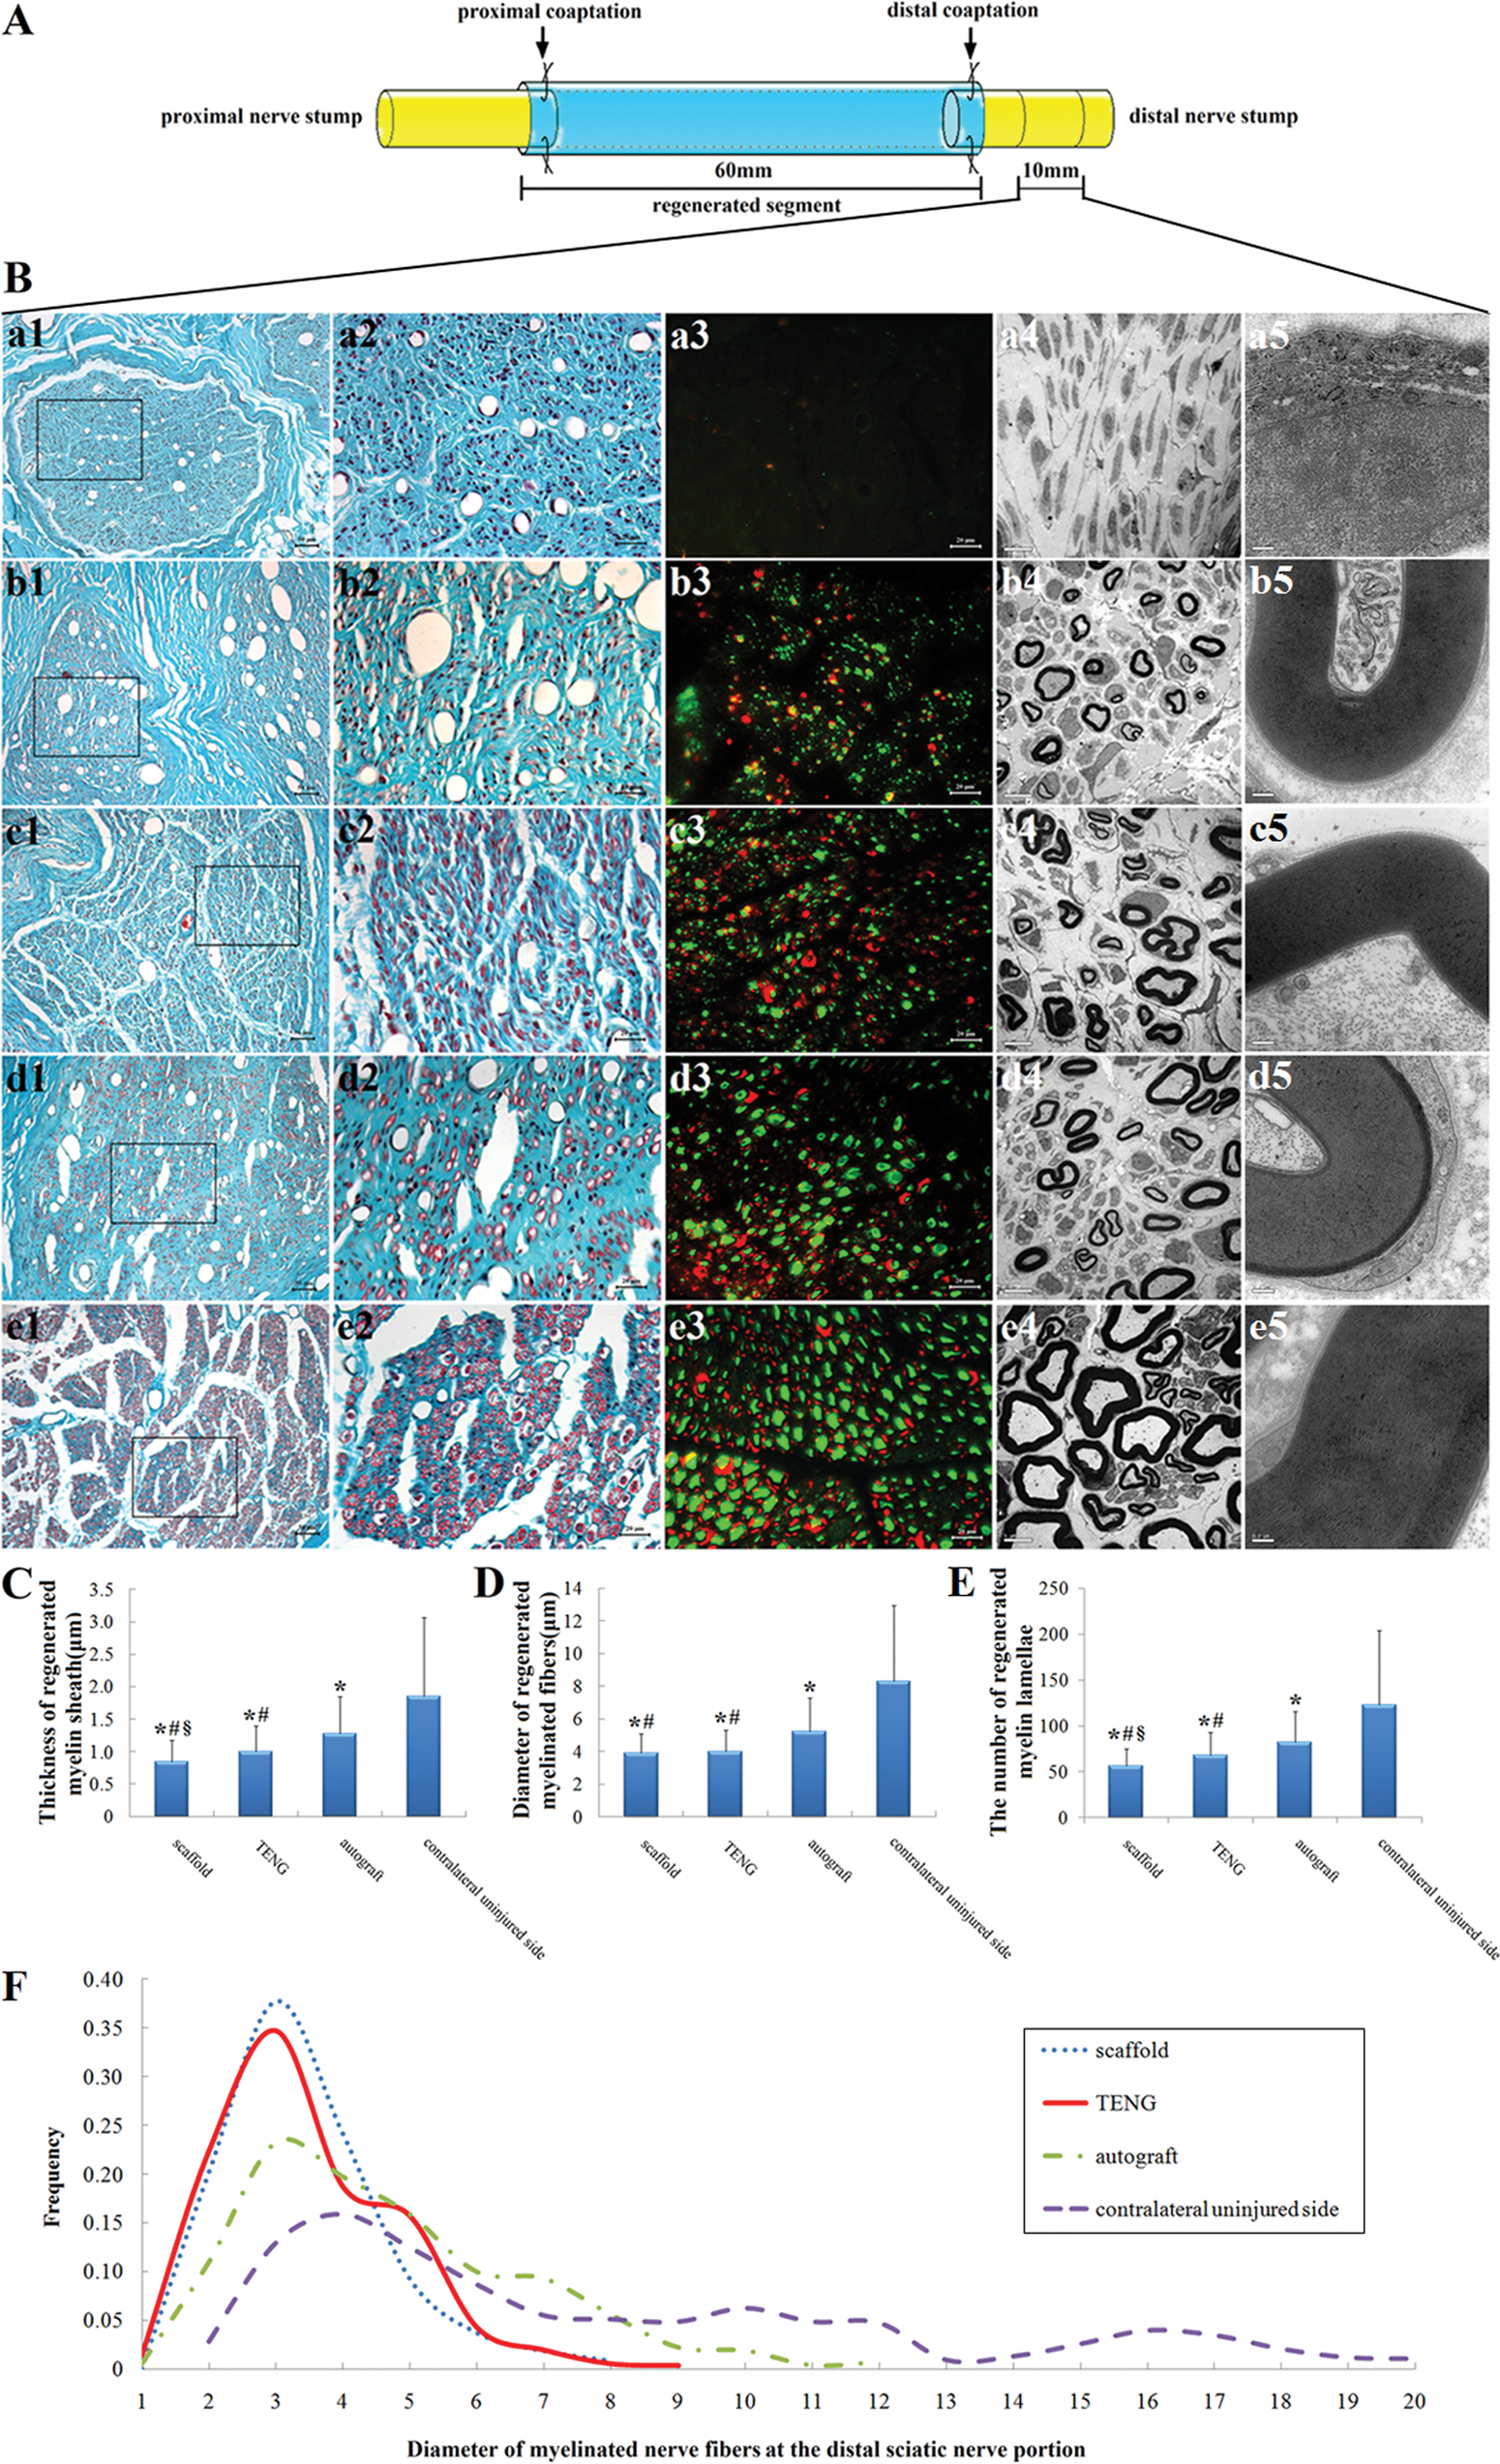
Schematic (A) showing the regenerated nerve segment in different grafted groups and the distal portion from which nerve sections were harvested. Meyer trichrome staining (a1-e1 and a2-e2), immunohistochemistry with anti-NF and anti-S-100 (a3-e3), transmission electron micrographs (a4-e4 and a5-e5), obtained at 12 months postsurgery, of the sectioned regenerated nerve on the injured side in nongrafted (a1-a5), scaffold (b1-b5), tissue-engineered nerve graft (TENG; c1-c5), and autograft (d1-d5) groups and on the contralateral uninjured side (e1-e4), respectively. The higher magnifications of the boxed areas in (a1-e1) are shown in (a2-e2), respectively. Scale bar: 50 µm (a1-e1), 20 µm (a2-e2 and a3-e3), 5 µm (a4-e4), 0.2 µm (a5-e5). Histograms showing the thickness of regenerated myelin sheath (C), the diameter of regenerated myelinated nerve fibers (D), the number of regenerated myelin lamellae (E) and the frequency distribution of myelinated nerve fiber diameters on the distal portion (F). All data are expressed as means ± standard deviations. One-way ANOVA plus post hoc Scheffé test (for C-E) and Kolmogorov–Smirnov test alone (for F) were used to analyze the data. *P < .05 versus the contralateral uninjured side, #P < .05 versus autograft group, and §P < .05 versus TENG group.
Electron microscopy
According to transmission electron microscopy, in 3 grafted groups, the regenerated myelinated fibers as well as numerous unmyelinated fibers were dispersed in clusters, and the myelinated axon was surrounded by a clear, thick, and electron-dense myelin sheath that was thinner than that in contralateral uninjured nerves (Figure 6B: b4-e4). The lamellae structure of myelin sheaths of regenerated nerves (Figure 6B: b5-e5) provided further evidence for this observation.
Transmission electron micrographs were further used for morphometric analysis to obtain the important parameters about myelinated nerve fibers. Either the myelin sheath thickness or myelin lamellae number in the TENG group was smaller than that in the autograft group and larger than that in the scaffold group with significant differences between each other. The diameter of myelinated fibers in the autograft group was significantly larger than that in the scaffold or TENG group, respectively (Figure 6C-E; see Supplementary Material for data). Certainly, these parameters in 3 grafted groups were respectively smaller than those for contralateral uninjured nerves with significant differences (Figure 6C-E). As expected, after an extended time period of recuperation the diameter of myelinated nerve fibers will gradually increase with time and finally approach the normal value.35,36
Moreover, the diameter distribution of myelinated nerve fibers on the distal portion was determined (Figure 6F). The diameter distribution in 3 grafted groups showed a peak value at around 3 µm and displayed significant differences among 3 grafted groups in terms of the Kolmogorov–Smirnov test.
Histological Observation and Morphometric Analysis of Target Muscles
In the 3 grafted groups, the target gastrocnemius muscle on the injured side looked red and lustrous in color and quite soft in texture. In the nongrafted group, however, the muscle looked pale in color, hard, and tenacious in texture with a severely atrophied belly.
Light microscopy following Masson trichrome staining revealed the morphological features of the target muscle at 12 months postsurgery (Figure 7A: a1-e1). In the 3 grafted groups, the muscle cells on the injured side of animals were uniform in their size and their nuclei were under the sarcolemma, but the muscle situation remained worse on the injured side than on the contralateral uninjured side even after 12-month recuperation. In the autograft or TENG group, a few collagen fibers were present only among muscle fiber bundles, while in the scaffold group a number of collagen fibers were present among muscle fiber bundles and among muscle cells. In the nongrafted group, however, serious muscle atrophy, adipocyte hyperplasia, and a large number of collagen fibers were seen.
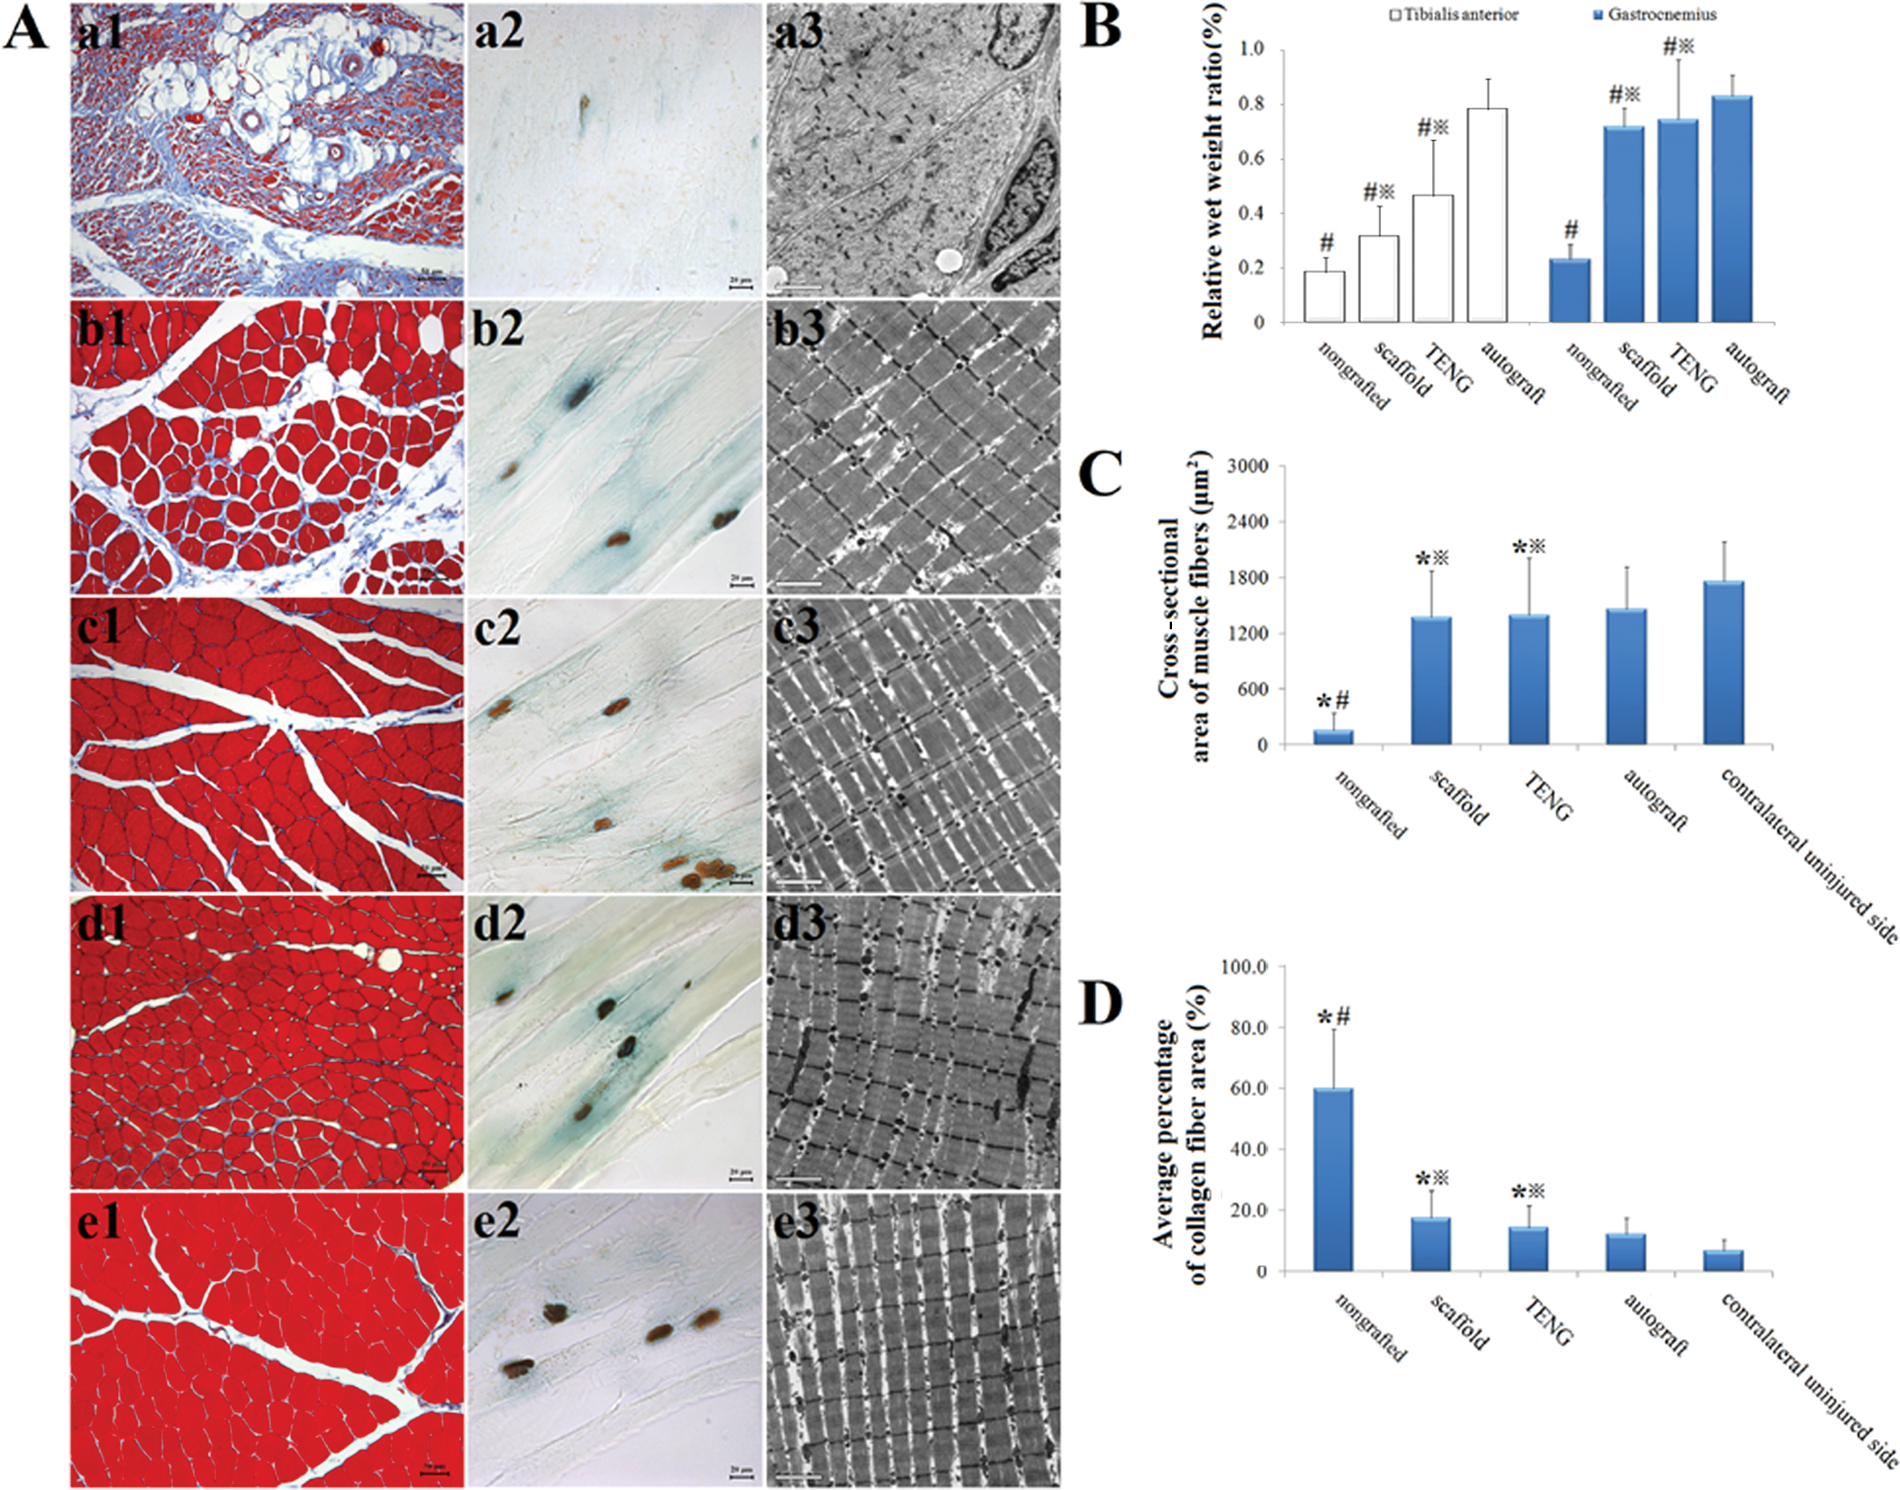
Masson trichrome staining (a1-e1) and AChE staining of the motor endplate (a2-e2) and transmission electron micrographs (a3-e3), obtained at 12 months postsurgery, of the transverse-sectioned gastrocnemius muscle on the injured side in the nongrafted (a1-a3), scaffold (b1-b3), tissue-engineered nerve graft (TENG; c1-c3), and autograft (d1-d3) groups and on the contralateral uninjured side (e1-e3), respectively. Scale bar: 50 µm (a1-e1), 20 µm (a2-e2), and 2 µm (a3-e3). Histograms showing the wet weight ratio of the tibialis anterior or gastrocnemius muscle (B), the cross-sectional area of gastrocnemius muscle fibers (C), and the average percentage of collagen fiber area in gastrocnemius muscle (D). All data are expressed as means ± standard deviations. Two-way ANOVA, in which one factor was muscle type and the other was grouping, plus Bonferroni t test (for B) and 1-way ANOVA plus post hoc Scheffé test (for C and D) were used to analyze the data, respectively. *P < .05 versus contralateral uninjured side, #P < .05 versus autograft group, and §P < .05 versus nongrafted group
AChE staining of the motor endplates on longitudinal sections of gastrocnemius muscle (Figure 7A: a2-e2) further indicated that target muscle atrophy in the 3 grafted groups was attenuated to varying degrees because of target reinnervation after the repair of injured sciatic nerves. In brief, the size and shape of motor endplates in the scaffold (Figure 7A: b2) or TENG (Figure 7A: c2) group were comparable with those in the autograft group (Figure 7A: d2); in the nongrafted group, however, motor endplates were hardly found but showed serious atrophy (Figure 7A: a2). In contrast, the motor endplates in the normal muscle on the contralateral uninjured side displayed an oval-shape or orbicular-ovate appearance with homogeneous and clear structures (Figure 7A: e2).
In addition, transmission electron microscopy (Figure 7A: a3-e3) exhibited that the target muscle in the 3 grafted groups, just like the normal muscle on the contralateral uninjured side, was featured by the regularly arranged sarcomeres and myofibrils and the well-organized Z-bands in myofilaments; in the nongrafted group, however, disorganization and fragmentation of myofilaments in the vicinity of Z-bands were observed with intact and degenerated areas existing in some muscle cells.
Morphometric analysis offered quantitative comparison in target muscle-associated parameter. (a) The wet weight ratio (injured side/contralateral uninjured side) of either gastrocnemius or tibialis anterior muscle was significantly smaller in the nongrafted group than in each grafted group and also in the scaffold or TENG group than in the autograft group (Figure 7B). (b) The cross-sectional area of gastrocnemius muscle fibers on the injured side was significantly smaller in the nongrafted group than in each grafted group and was not significantly different from each other between the 3 grafted groups; however, this parameter in the scaffold or TENG group was significantly smaller than that of normal gastrocnemius muscle fibers on the contralateral uninjured side (Figure 7C). (c) The average percentage of collagen fiber area in gastrocnemius muscle on the injured side was significantly larger in the nongrafted group than in each grafted group and was not significantly different from each other between the 3 grafted groups; however, this parameter in the scaffold or TENG group was significantly larger than that of the normal gastrocnemius muscle on the contralateral uninjured side (Figure 7D).
Discussion
Behavioral analysis indicated that MSC-based TENGs improved the healing of peripheral nerve injuries and the restoration of locomotive activities. Indeed, motor recovery was similar to autografts. TENGs produced better hind limb motor function compared with scaffolds alone by 9 months postsurgery.
The amplitude of the CMAP is proportional to the number of nerve fibers innervating the muscle, and the MCV positively correlates with the diameter of myelinated nerve fibers and the myelin sheath thickness. In this study, unlike the CMAP amplitude, the MCV was significantly smaller in the scaffold than the autograft group but not smaller in the TENG than the autograft group. These results correspond with the morphometric differences of regenerated nerves among the 3 grafted groups.
FG retrograde tracing is usually used to confirm the completeness of nerve regeneration and axonal transport. The percentage of labeled sensory neurons in autograft and TENG groups was similar and higher than for the scaffold group. The result might be attributable to the establishment, by MSCs, of a favorable microenvironment that encouraged sensory function restoration.
Histology revealed the reconstruction of 60-mm sciatic nerve gaps in animals at 12 months postsurgery. The maturity of regenerated myelinated nerve fibers is usually assessed by the diameter distribution of myelinated nerve fibers or myelin sheath thickness.37,38 We found that the maturity of regenerated nerve fibers, as indexed by these 2 parameters, was better in the TENG group than in the scaffold group, presumably due to MSCs. The frequency distribution of the diameter of myelinated fibers showed a progressive, significant decrease from autografts to TENGs to scaffolds, but the mean diameter of myelinated nerve fibers on the injured side of all 3 grafted groups was significantly less than the contralateral uninjured side. Accurate path finding guides the regenerating axons to their targets for appropriate reinnervation, which is thus considered as a measure of nerve regeneration. In this study, both target muscles (tibialis anterior muscle and gastrocnemius muscle) showed significantly better recovery, as indexed by the wet weight ratio values in the autograft group than the scaffold or TENG group. Presumably, the preserved structure of autografts provided the most ideal pathway and microenvironment for regenerating axons. 39
In this and a previous study, 30 TENGs with the same composition and structure were used in similar animal models. This study, however, featured a longer nerve gap, longer follow-up, and more detailed outcome measures. The data increase the feasibility of translation to clinical trials using autologous MSCs as support cells for peripheral nerve applications.
Footnotes
The author(s) declared no potential conflicts of interest with respect to the research, authorship, and/or publication of this article.
The author(s) disclosed receipt of the following financial support for the research, authorship, and/or publication of this article:
The financial supports of the Hi-Tech Research and Development Program of China (863 Program, No. 2006AA02A128), the Nature Science Foundation of China (No. 30870811 and No. 30770585), the Nature Science Foundation of Jiangsu province (No. BK2008010), the key project of Jiangsu Education Department (Grant No. 08KJA310002), a project funded by the Priority Academic Program Development of Jiangsu Higher Education Institutions are greatly acknowledged.