
Abstract
Background. Individuals with incomplete spinal cord injury (SCI) are predisposed to muscle fatigue during voluntary exercise. However, the origin of fatigue is unclear. Objective. The authors examined the motoneuron excitability, muscle activation level, and fatigue properties of the flexor carpi radialis muscle, just below the level of injury. Methods. Nine individuals with chronic, incomplete cervical cord injury and 9 age-matched healthy individuals were recruited. The authors tested maximum voluntary contraction (MVC), motoneuron excitability by the maximum amplitude of the H-reflex (Hmax at C-7), and muscle voluntary activation level measured by the interpolated twitch technique. Subjects were fatigued by repetitive maximal voluntary isometric wrist flexion. General fatigue index (GFI), central fatigue index (CFI), and peripheral fatigue index (PFI) of flexor carpi radialis were examined before, during, and immediately after exercise. Results. The Hmax in the SCI group was significantly higher (P = .0028) than in controls. The MVC (P < .001) and voluntary activation level (P = .016) in the SCI group were significantly lower. The GFI and CFI decreased in both the SCI and the non-SCI groups. The PFI in the SCI group was significantly higher (ie, less fatigue) than that in controls at 30 repetitive contractions. Conclusions. In individuals with incomplete SCI, the deficit in central drive is an important source of muscle weakness and fatigue in the muscle below the level of injury.
Introduction
Individuals with incomplete spinal cord injury (SCI) have muscle weakness or paralysis below the level of injury. 1 In SCI cases with partial paralysis, 1 motoneuron death and muscle denervation may occur in weakened muscles around the level of lesion, which may enhance the fatigability during exercise.2,3 Several factors, such as reduction of motivation, motoneuron excitability, and the contractile properties of muscle, have been proposed to cause activity-dependent fatigue.4,5 Butler and Thomas suggested that the decreases in motoneuron excitability during electrical stimulation-induced fatigue for paralyzed muscles in SCI subjects were a result of activity-dependent changes in motoneuron properties. 6 However, for those partially preserved muscles below the neurological level in incomplete SCI, the cause of weakness and the origin of fatigue are unclear.
Few studies have been done to investigate the fatigue properties in individuals with incomplete SCI. Cameron and Calancie used an electrical stimulator delivering 126 trains of stimuli to fatigue the wrist flexors of individuals with incomplete C3-C6 cord injury. They found that the peak isometric force was less in the SCI group than in the non-SCI group, but the force decline pattern was comparable between the 2 groups. 7 This suggests that peripheral fatigue might not be a primary cause. Thomas et al analyzed the mean forces and integrated EMGs generated during 5 brief submaximal and 5 maximal triceps brachii voluntary contractions (MVCs) for 7 to 8 seconds each in individuals with chronic cervical SCI. 2 The mean forces and integrated EMGs generated by those with SCI were significantly less than those of controls. 2 This suggests that impaired central activation and/or central fatigue might be important, but these have not been quantified in incomplete SCI individuals.
The H-reflex measures the excitability of monosynaptic reflex loop with Ia afferent synapse. 8 Although the H-reflex could be modulated by suprasegmental drive, the motoneuron excitability at the spinal cord level is commonly quantified by the maximum amplitude of the H-reflex (Hmax). The H-reflex evoked in the flexor carpi radialis assesses the C-7 motoneuron level and median nerve function. 9 The Hmax is commonly normalized by dividing the Hmax with maximum M-waves (Mmax) to eliminate the influence of neuromuscular transmission and to correlate with motoneuron excitability. 10 An adapted increase in H-reflex amplitude has been found in patients with central nervous system lesions. Whether it has functional meaning, that is, compensation for impaired central activation or alleviating central fatigue, is not clear.
The muscle voluntary activation level represents the completeness of the muscle activation during voluntary contraction and can be analyzed by the interpolated twitch technique.10,11 The interpolated twitch technique records the force response after applying a single supramaximal electrical stimulus to the nerve, superimposed during a sustained maximal voluntary contraction. The supramaximal stimulus recruits motor units that have not been recruited and generates a superimposed twitch force response. 12
Fatigue can be defined as central fatigue and peripheral fatigue. Peripheral fatigue represents processes within the muscle, whereas central fatigue represents the decline of the level of voluntary activation of muscle. The 2 types can be quantified by the postexercise declination ratio of the twitch force elicited by electrical stimulation and declination ratio of the voluntary activation level, respectively.13-15 In healthy subjects, both peripheral and central fatigue impair maximal voluntary contraction, 16 but this has not been investigated after incomplete SCI during volitional activities.
We hypothesized that subjects after SCI would have higher motoneuron excitability, decreased muscle activation level, and more general fatigue, central fatigue, and peripheral fatigue after exercise than healthy control subjects. Knowing the limitation factors (ie, central or peripheral fatigue) for individuals with incomplete SCI, clinicians may be able to develop rehabilitation programs to lessen fatigability.
Methods
Subjects
Participants with SCI were recruited from the Potential Development Center for Spinal Cord Sufferers in Taoyaun County and the outpatient clinic of the Department of Rehabilitation Medicine, National Taiwan University Hospital. The inclusion criteria were the following: (a) >1 year post-SCI, (b) lesion above C-7 with partial motor preservation below, (c) voluntary contraction of the flexor carpi radialis against at least gravity, and (d) able to sit on a chair independently. Nine subjects with a neurological level at C4 to C5 and American Spinal Injury Association Injury Scale classification C or D were recruited. The SCI and control groups are shown in Table 1. All the participants signed the consent form approved by the Ethics Committee of National Taiwan University Hospital.
Basic Data of Spinal Cord Injured (SCI) and the Non-SCI Subjects
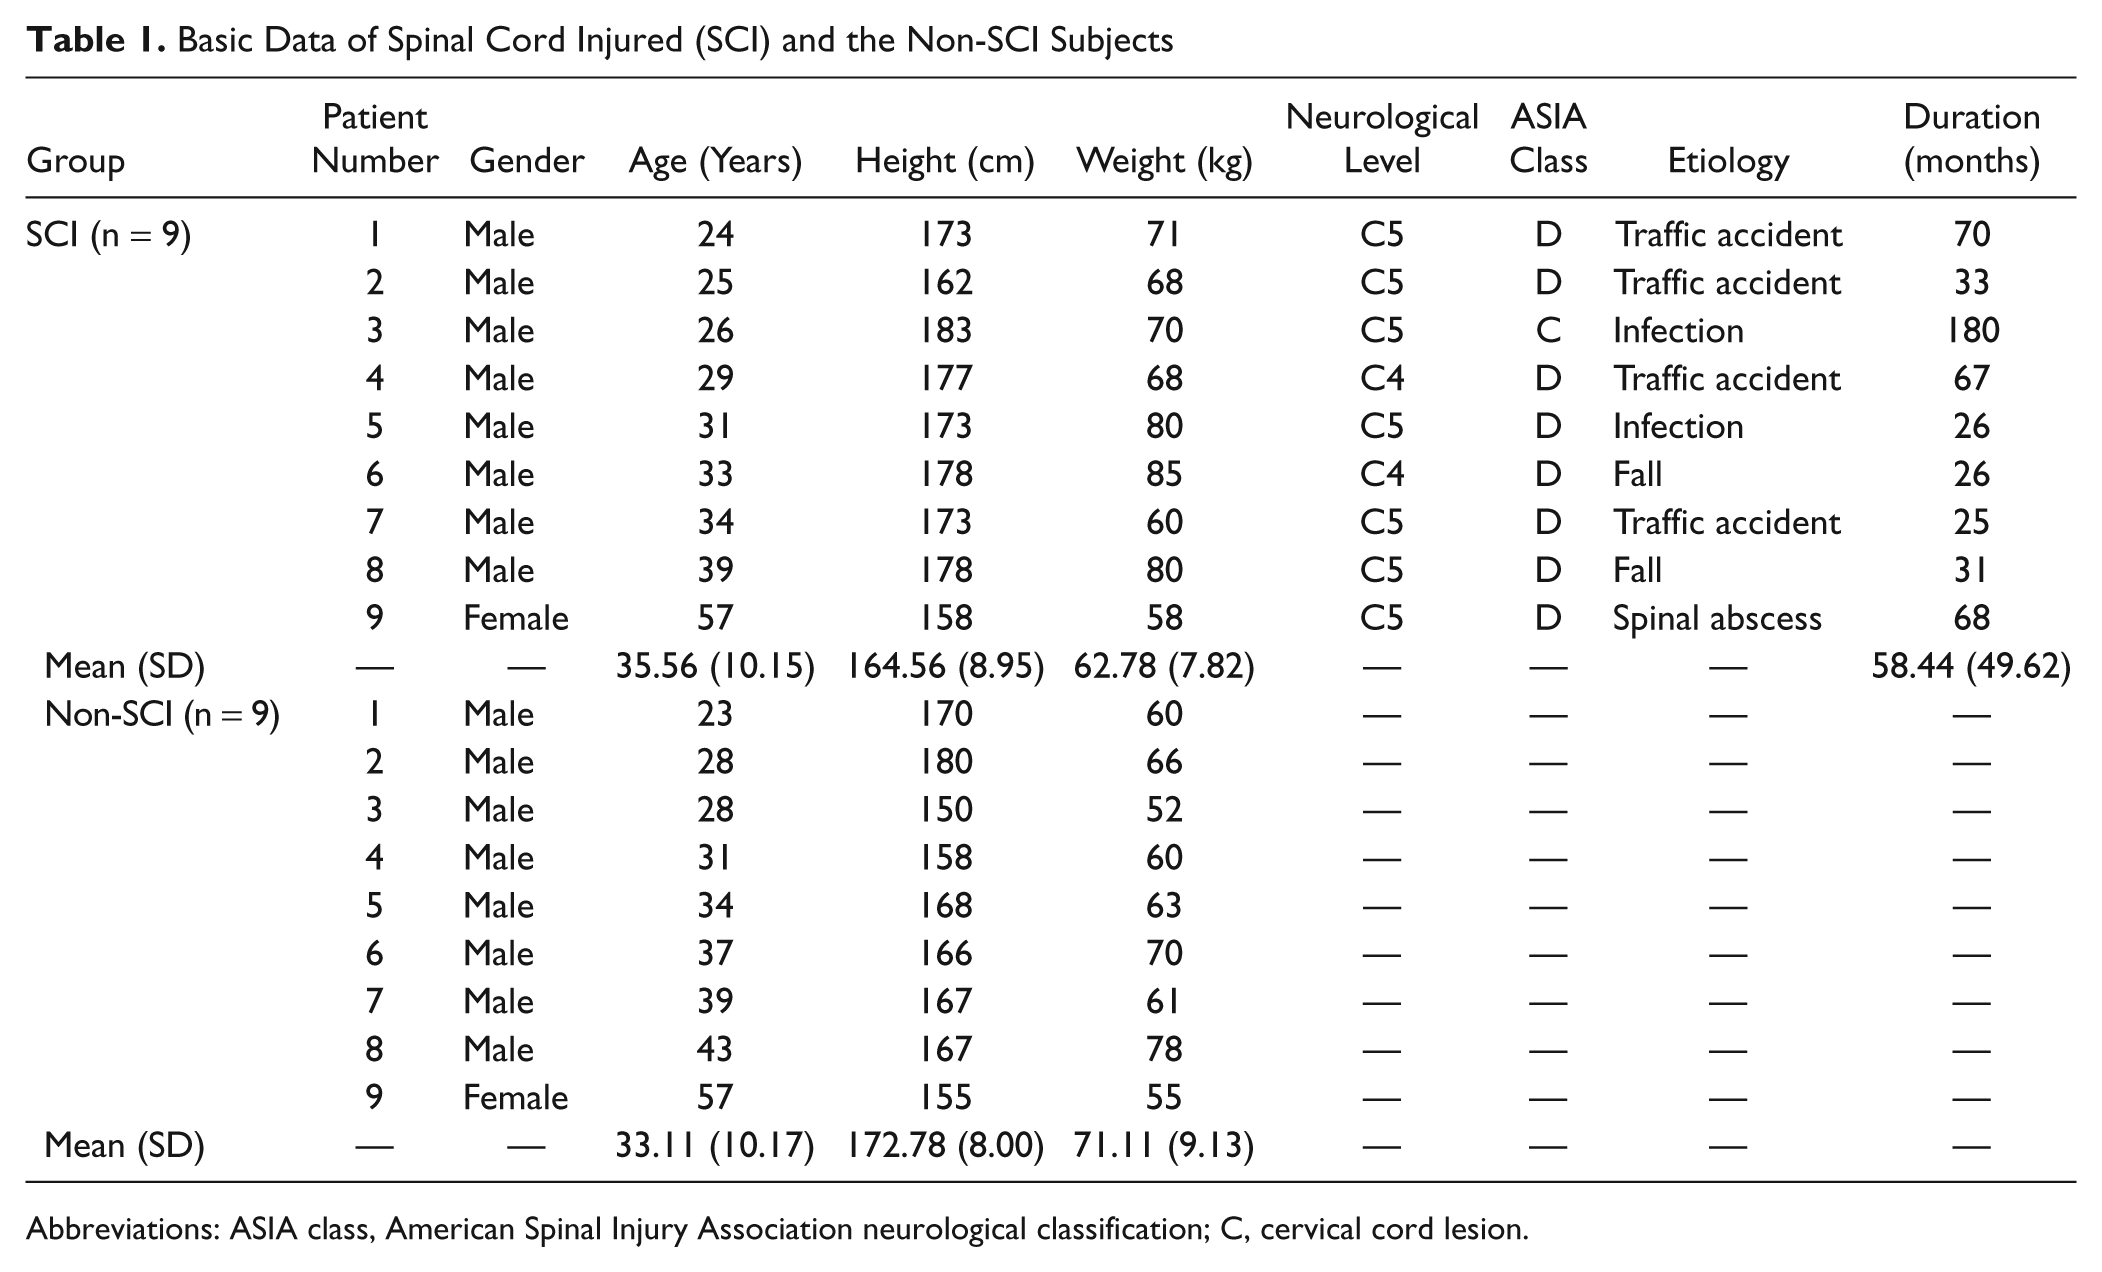
Abbreviations: ASIA class, American Spinal Injury Association neurological classification; C, cervical cord lesion.
Testing
H-reflex and M-wave
Subjects sat on a chair with the elbow flexed to 90° to 100° and forearm supinated. The surface electromyography (EMG) of the flexor carpi radialis was recorded by a bipolar electrode with a fixed interelectrode distance of 2 cm (B&L Engineering, Santa Ana, CA). The recording electrode was located on the muscle belly of the flexor carpi radialis, parallel to the muscle fiber, and the reference electrode on the styloid process. The EMG activity was on-site preamplified with a factor of 350 and further amplified at the mainframe amplifier that had an input impedance greater than 10 MΩ, a common mode rejection ratio of 100 dB at 60 Hz, and a gain range from 0.5 to 100 000 times (Gould, Inc, Valley View, OH). The raw EMG data were fed through a 60-Hz notch filter and a band-pass (10-1000 Hz) filter to eliminate environmental interference and motion artifacts. EMG activity was monitored on an oscilloscope and digitized by a 16-bit resolution analog-to-digital converter (InstruNet Model 100, Input/Output A/D system, Somerville, MA) at 4000 Hz.
Electrical stimuli (ES) of 200-µs-width rectangular pulses were provided by an electrical stimulator (Digitimer DS7A, Digitimer Ltd, Hertfordshire, England). The cathode of the electrical stimulator was applied on the median nerve at the inner elbow joint, and the anode was on the olecranon. The stimulus intensity was initially low and was increased gradually until the maximum H-reflex (Hmax) was found. This intensity was used for eliciting Hmax throughout this study. Similarly, the stimulus intensity was gradually increased until the maximum M-wave (Mmax) was elicited. The supramaximum intensity was set at 120% of the intensity at which Mmax was elicited and was used throughout this study.
Peak-to-peak amplitude of the Hmax and Mmax were analyzed (Biopac AcqKnowledge version 3.8.1, Biopac System, Inc, Goleta, CA). To minimize the influence of interindividual variance, the Hmax was normalized by the Mmax. The Hmax/Mmax ratio represented the maximal percentage of alpha motoneurons that could be activated by electrical stimulation of Ia afferents.16,17 The Hmax/Mmax ratio is a common indicator used to represent neural adaptation in individuals with neurological disorders.18-20
Muscle force and muscle voluntary activation level
Subjects were seated with the elbows flexed at 90°. Their forearm, wrist, and palm were fixed on a wooden frame that was connected to a force transducer (BAB-50M, Transcell Technology, Inc, Buffalo Grove, IL) for recording muscle forces during isometric contractions. The recorded force signals were amplified by a Gould transducer amplifier (Gould Instrument System, Inc, Valley View, OH) and monitored on an oscilloscope and then digitized by a 16-bit resolution analog-to-digital converter (Instrunet) at 4000 Hz.
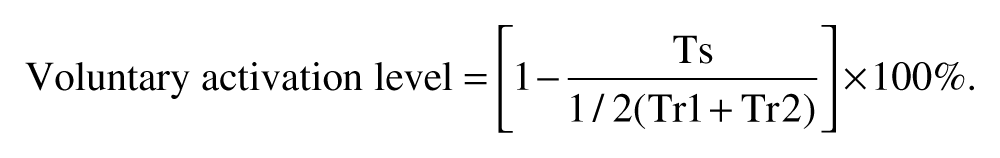
Before the fatigue test, 3 MVCs of flexor carpi radialis were recorded by holding for 4 seconds each and separated by 3 minutes of rest. Then, the initial voluntary activation level was assessed by the interpolated twitch technique to test whether a muscle was fully activated during a MVC.21-23 Subjects were familiarized with supramaximal ES several times. Then, the subjects contracted their flexor carpi radialis to MVC and held for 4 seconds. During the initial 1 to 2 seconds of holding, supramaximal ES was applied to the median nerve to evoke a superimposed twitch force response (Ts). The Ts is generated from those motor units that have not yet been recruited. With increasing central drive to exert the force to a higher level, the Ts should become smaller and the voluntary activation level would be larger.23,24 The supramaximum ES was also applied both before and after MVC of flexor carpi radialis to evoke 2 resting twitch force responses (Tr1 and Tr2). The Tr1 and Tr2 represent the unpotentiated and potentiated twitches, respectively (Figure 1). The Tr1 and Tr2 were averaged to represent the amplitude of resting twitch. The voluntary activation level was calculated by the following formula12,13:
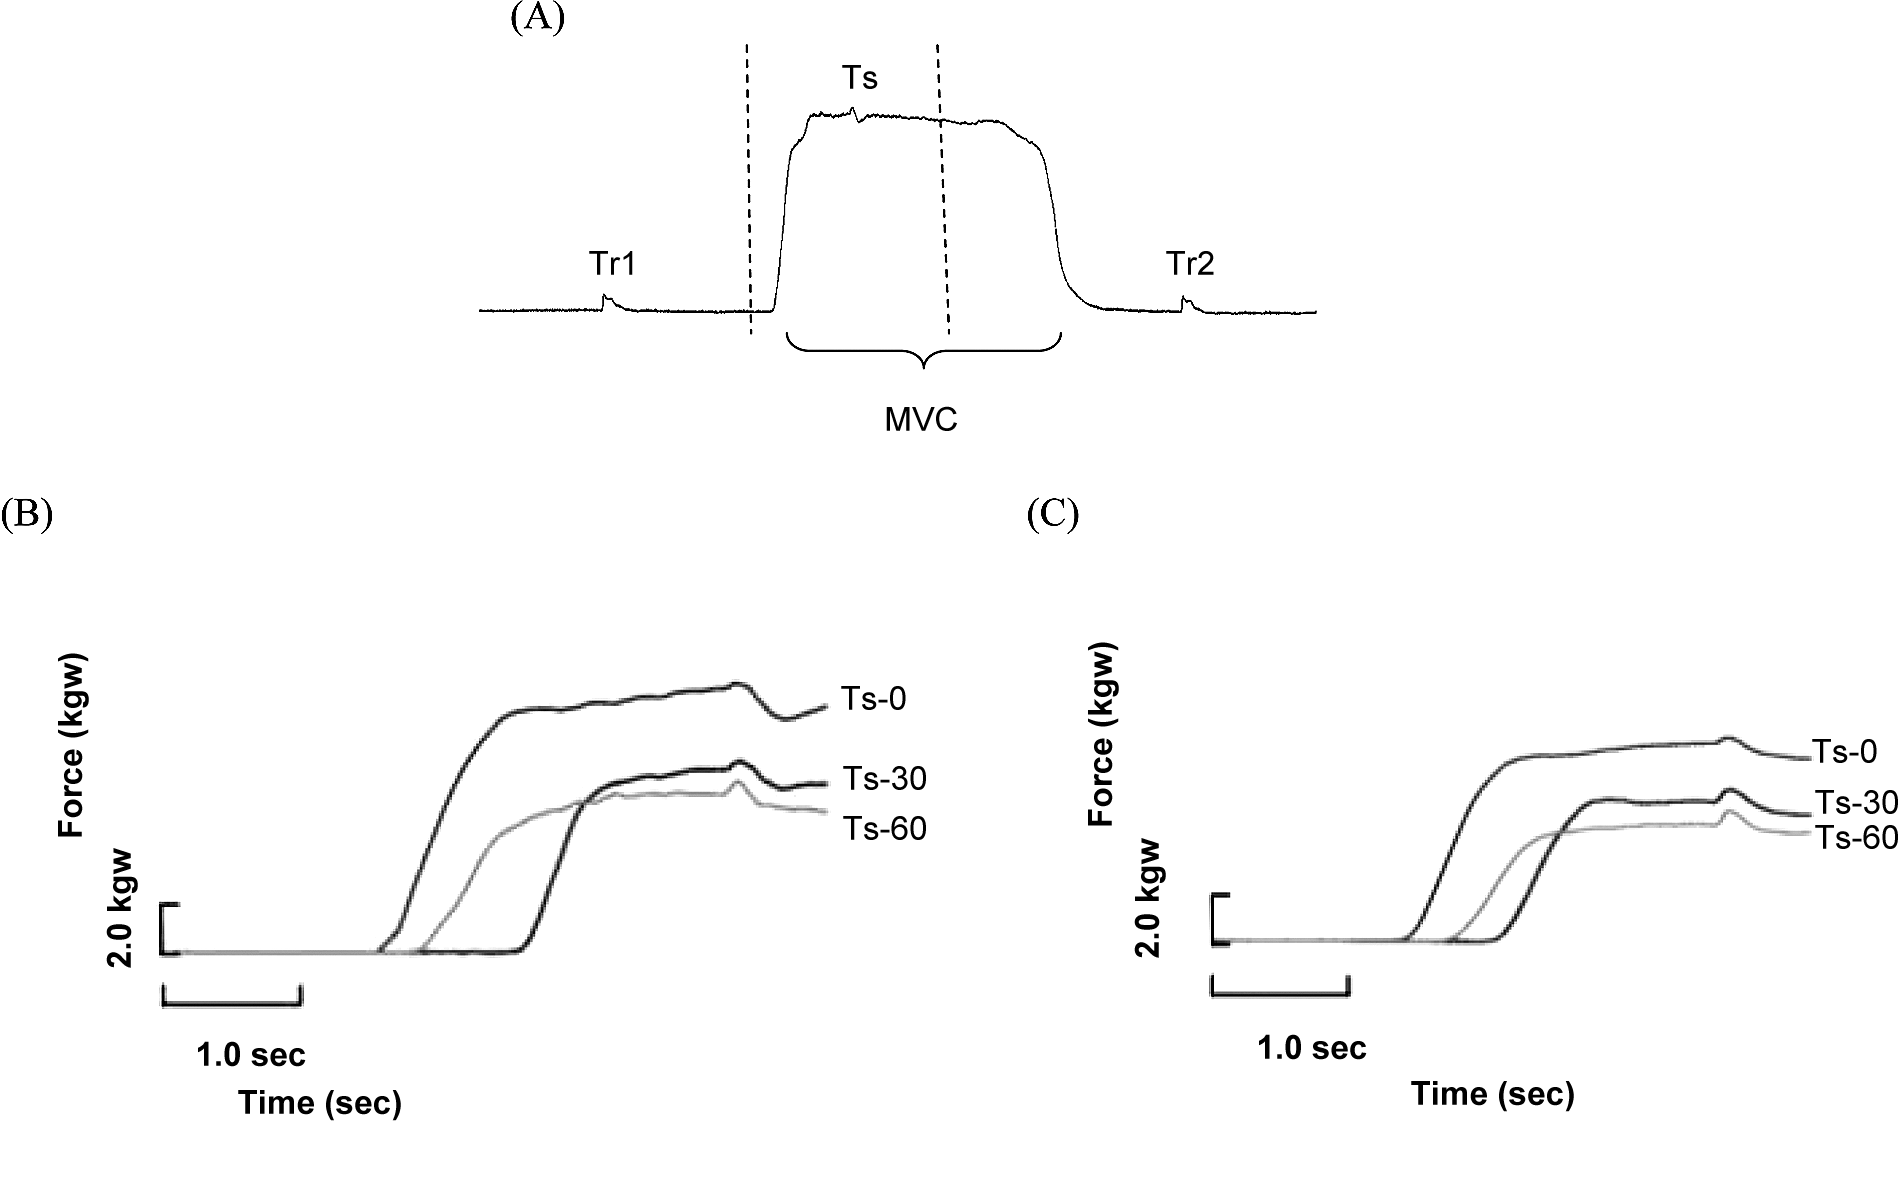
A typical force profile for interpolated twitch technique during a maximal voluntary contraction (MVC) is shown in (A), and the force–time profiles during fatigue test are plotted for a control subject (B) and a cervical cord injured subject (C)
Fatigue exercise test
After assessing initial MVC and voluntary activation level responses, a fatigue exercise test was performed. Modified from prior fatigue protocols,25,26 the fatigue exercise contained 2 series of 30 intermittent, brief MVCs of wrist flexors with a 4-second contraction and 8-second relaxation (duty cycle = 0.33). The MVC and the voluntary activation level were collected before, during (ie, finishing 30 contractions), and immediately after (ie, finishing 60 contractions) the fatigue test.
The general fatigue index (GFI) was calculated by dividing the force amplitude of MVC after exercise by that before the fatigue exercise.21,27,28 The central fatigue index (CFI) was calculated by dividing the voluntary activation level after the fatigue exercise by that before the exercise.21,23 The peripheral fatigue index (PFI) was calculated by dividing the averaged amplitude of potentiated and unpotentiated twitches after the fatigue exercise by that before the fatigue exercise.13,15,21

Statistical Analysis
Statistical analyses were performed with SPSS software (version 16, SPSS Inc, an IBM Company, Chicago, IL). The nonparamatric Wilcoxon signed rank test were used to test the differences of Hmax, Mmax, Hmax/Mmax, MVC, voluntary activation level, GFI, CFI, and PFI between 2 groups. The Friedman test was used to test the changes of MVC, voluntary activation level, GFI, CFI, and PFI in different series of contractions (ie, time factor) during the fatigue protocol. A significance level was set at P < .05. If significance was detected, the Wilcoxon signed rank test was used to compare the pairwise differences between series of contractions with P value adjusted to <.017. The correlation between GFI and CFI or PFI was analyzed by the Pearson correlation coefficient. A significance level was set at .05.
Results
H-Reflex and M-Wave
Table 2 shows the averaged amplitudes of Hmax, Mmax, and Hmax/Mmax of the 2 groups before the fatigue test. The amplitudes of Hmax and Hmax/Mmax of the SCI group were significantly higher (P < .01, respectively) than those of the non-SCI group, whereas the Mmax of the 2 groups showed no significant difference.
Amplitude of Hmax, Mmax, Hmax/Mmax, Forces, and Voluntary Activation Levels During Fatigue Test
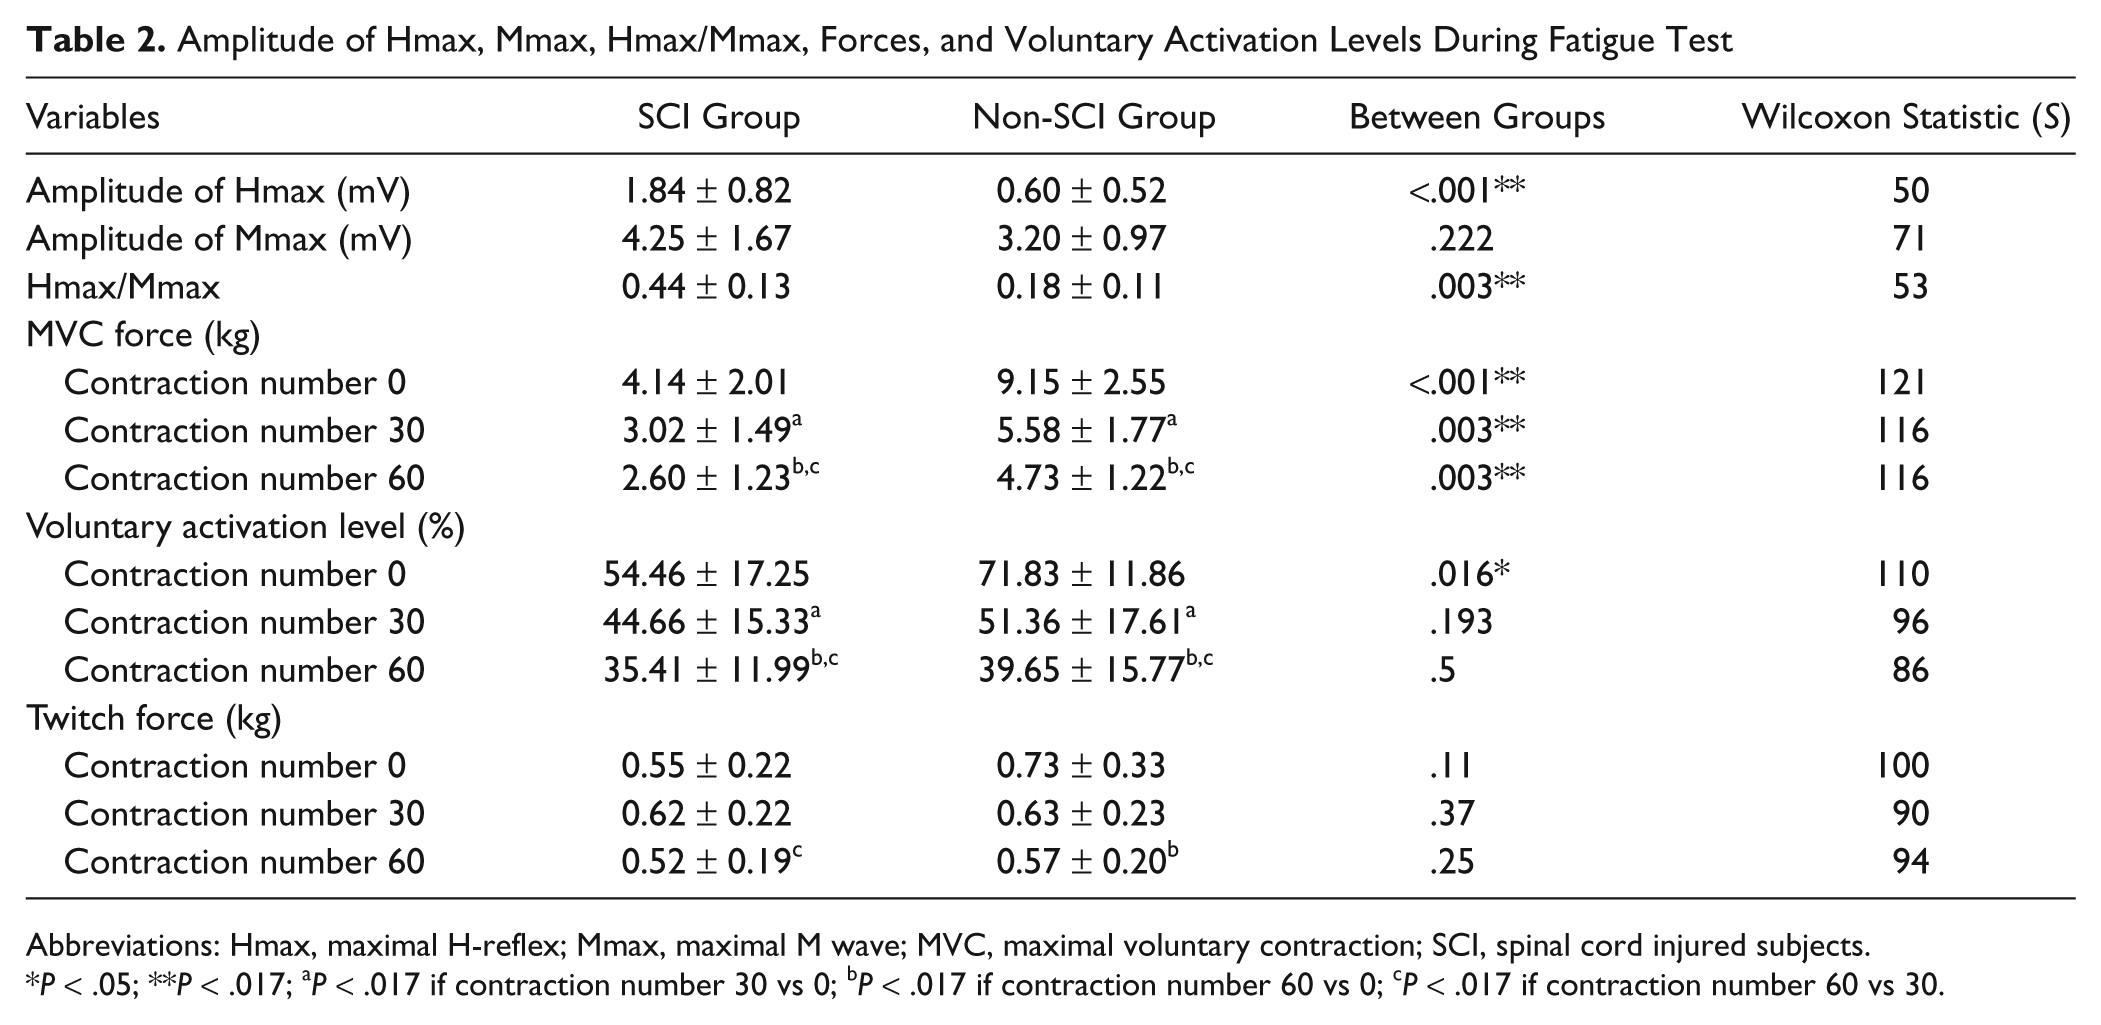
Abbreviations: Hmax, maximal H-reflex; Mmax, maximal M wave; MVC, maximal voluntary contraction; SCI, spinal cord injured subjects.
P < .05; **P < .017; aP < .017 if contraction number 30 vs 0; bP < .017 if contraction number 60 vs 0; cP < .017 if contraction number 60 vs 30.
Maximal Voluntary Contraction Force
Table 2 illustrates the averaged data of the 2 groups in force amplitudes during the fatigue test. At the end of 60 brief isometric contractions, the MVC was about half of the initial in both groups, indicating the subjects had already reached the fatigue level. Based on the Friedman test, the MVC decreased over time in both the SCI (P < .001) and the non-SCI (P < .001) groups. With adjusted significance level to .017 in the signed rank test, the MVC decreased after the 30th (P = .004) and the 60th (P = .004) contractions in both groups. Furthermore, the MVC of the SCI group was lower than that of controls initially (P < .001) and after the 30th (P = .003) and the 60th contractions (P = .003). The force of the non-SCI group was about 2 times that of the SCI group before and during the fatigue test at the 30th and the 60th contractions.
Voluntary Activation Level
Table 2 illustrates the averaged data of voluntary activation level in the 2 groups during the fatigue test. Based on the Friedman test, the voluntary activation level decreased over time in both the SCI (P < .001) and the non-SCI (P < .001) groups. Furthermore, the initial voluntary activation level of the SCI group was lower than that of the non-SCI group (P = .016), whereas no differences were found between groups after the 30th (P = .193) and the 60th contractions (P = .5; Table 2).
General Fatigue Index
A lower index indicates a greater drop of MVC. Figure 2A illustrates the averaged data of the 2 groups in GFI during the fatigue test. The profiles of GFI in both groups were similar, at about 50% of the initial force. The GFI decreased over time in both the SCI (P < .001) and control (P < .001) groups. Differences were also found for the initial and subsequent contractions (initial vs 30th, P = .004; initial vs 60th contraction, P = .004) but not between groups (Table 2).

The general fatigue index (A), central fatigue index (B), and peripheral fatigue index (C) in spinal cord injured (SCI) subjects (black line) and the non-SCI (gray line)
Central Fatigue Index
Figure 2B shows the averaged data of the 2 groups. The CFI decreased over time in both (P < .001) groups. There were significant differences across the initial and subsequent contractions (initial vs 30th, P = .004; initial vs 60th contraction, P = .004) and no differences between the groups (Table 2). The correlation coefficient between CFI and GFI was .67 (P < .001) for the SCI group and .79 (P < .001) for the control group.
Peripheral Fatigue Index
As shown in Figure 2C, the PFI in the SCI group was higher (P = .011) than in the non-SCI group after 30 brief contractions, suggesting a twitch potentiation in the SCI group. There was no difference after 60 brief contractions (P = .136). There was a difference (P < .017) between the initial contraction and the 60th contraction in the non-SCI subjects. In the SCI group, there was no correlation (correlation coefficient = .24) between the PFI and the GFI (P = .22). In the non-SCI group, the correlation coefficient between the PFI and the GFI was .52 (P = .006).
Discussion
This study is the first to quantify the central and peripheral sources of muscle weakness and fatigue in the muscle below the level of injury in individuals with incomplete SCI. This study found that the deficit of the central drive is an important source of muscle weakness and fatigue and could not be compensated by the increased alpha-motor neuron pool excitability. The major findings of this study are the following: (a) the MVC force and muscle activation level before fatigue exercise were significantly lower, but the Hmax and Hmax/Mmax were significantly higher in the SCI group than in the non-SCI group; (b) both the SCI and the non-SCI groups developed fatigue after repetitive isometric contractions; and (c) the non-SCI group developed both central fatigue and peripheral fatigue, whereas the SCI group developed only central fatigue.
Studies have shown that the amplitude of H-reflex and M-wave of flexor carpi radialis in healthy subjects were about 0.36 to 2.23 mV and 4.29 to 7.6 mV, respectively.9,17,19 The results of our study were similar. The high Hmax and Hmax/Mmax in SCI were probably due to neural adaptation with central disinhibition and the release of presynaptic neurotransmitters to compensate for the loss of motor units.29-31 However, the Hmax and Hmax/Mmax were associated with spasticity,29,31 which might contribute to less voluntary contraction force of the muscle in SCI. Whether this high Hmax value was maintained during the fatigue exercise was not clear, because the H-reflex was not measured during the fatigue exercise in this study. Some studies showed that the normalized or standardized H-reflex did not change after fatigue,32,33 but some studies showed that the H-reflex decreased.34,35 The discrepancies could be explained by the methodology of the fatigue protocol and the measurement conditions of the H-reflex.
Our results found that the muscle MVC force in chronic, incomplete SCI was about half of that in the non-SCI individuals before and during fatigue exercise. This finding was consistent with that of Cameron and Calancie. 7 The cause of the low MVC before and during fatigue exercise in SCI may be due to the reduction of sensory inputs, 2 the lack of extra activation of motoneurons, 5 and the loss of active motoneurons or the elevation of the threshold of residual motoneurons. 36
The present study showed that central fatigue (ie, decrease of CFI) evolved during the fatigue exercise in the SCI and control groups. However, the peripheral fatigue index, characterized by the declination of twitch force, was not significantly decreased in the incomplete SCI group. The twitch force was potentiated at 30 contractions, instead. Potentiation is characterized by the enhancement of muscle force following previous repetitive activation, which might be due to the myosin light chain phosphorylation, with increases of the number of attached cross bridges at submaximal calcium concentration.37,38 Previous studies also demonstrate robust postfatigue potentiation in chronically paralyzed muscles.39-41 The twitch potentiation in the present study suggested that the incomplete SCI individuals might suffer from sustained low-frequency fatigue before participation. Thus, repetitive isometric contractions did not induce further low-frequency fatigue in this study.
Greater neuromuscular fatigue might develop from isometric than concentric exercise.26,42 The present study found a high correlation between central fatigue and general fatigue in both groups during repetitive isometric exercise. Thus, central fatigue might contribute to the reduced maximal voluntary contraction during fatigue exercise in both groups. The central fatigue in the SCI and the non-SCI groups might originate from the different proportions of supraspinal 16 and spinal components.2,3 Other factors including metabolite (H+ and Pi) accumulation in muscle and a change of supraspinal descending drive might occur both in the SCI and the non-SCI individuals. 13 Future studies are needed to elucidate the different mechanisms of fatigue.
Limitations and Strengths
This study did not measure the H-reflex during the fatigue exercise. The main reason was that several H-reflexes would be necessary for averaging, but the consecutive H-reflexes had to be separated by 10 seconds to prevent postactivation depression. This delay would potentially interfere with the fatigue protocol and allow recovery of central fatigue. The measurement of H-reflex during fatigue exercise is suggested for future study. Furthermore, this study did not measure the motor cortex output to elucidate the central drive during the fatigue exercise. However, the strength of this study was to quantify both the central and peripheral fatigues. In addition, unlike ES-induced muscle contractions, the repetitive, brief, voluntary isometric wrist contractions resembled certain daily life activities, such as typing and writing, so the testing may be more relevant to rehabilitation strategies.
Conclusions
Deficits in activation failure are important sources of muscle weakness in individuals with chronic incomplete cervical SCI. Repetitive isometric wrist flexion caused central fatigue, which reduced voluntary contraction force in people with an SCI above the C-7 level. The influence of peripheral fatigue could not be totally excluded because subjects showed twitch potentiation. Strategies to reduce central fatigue of the muscles below the level of injury should be developed in clinical rehabilitation.
Footnotes
Acknowledgements
The authors thank the participants and the administrators in the Potential Development Center for Spinal Cord Sufferers, Taoyaun County, Taiwan. The authors thank Mr Yu-Kuang Wu for assisting in data collection, Dr Cheng-Hsiang Lin for statistical comments, and Dr Miao-Ju Hsu for editorial comments on this article.
The author(s) declared no potential conflicts of interest with respect to the research, authorship, and/or publication of this article.
The author(s) disclosed receipt of the following financial support for the research, authorship, and/or publication of this article: This study was partly supported by National Science Council, Taipei, Taiwan (NSC 96-2314-B-002-073) and Healthy Aging Research Center, Chang Gung University.