
Abstract
Background. A comprehensive, reliable, and valid measurement system is needed to monitor changes in children with neurological conditions who experience lifelong functional limitations. Objective. This article describes the development and psychometric properties of the pediatric version of the Quality of Life in Neurological Disorders (Neuro-QOL) measurement system. Methods. The pediatric Neuro-QOL consists of generic and targeted measures. Literature review, focus groups, individual interviews, cognitive interviews of children and consensus meetings were used to identify and finalize relevant domains and item content. Testing was conducted on 1018 children aged 10 to 17 years drawn from the US general population for generic measures and 171 similarly aged children with muscular dystrophy or epilepsy for targeted measures. Dimensionality was evaluated using factor analytic methods. For unidimensional domains, item parameters were estimated using item response theory models. Measures with acceptable fit indices were calibrated as item banks; those without acceptable fit indices were treated as summary scales. Results. Ten measures were developed: 8 generic or targeted banks (anxiety, depression, anger, interaction with peers, fatigue, pain, applied cognition, and stigma) and 2 generic scales (upper and lower extremity function). The banks reliably (r > 0.90) measured 63.2% to 100% of the children tested. Conclusions. The pediatric Neuro-QOL is a comprehensive measurement system with acceptable psychometric properties that could be used in computerized adaptive testing. The next step is to validate these measures in various clinical populations.
Introduction
Neurological conditions often produce permanent disabilities, affecting many aspects of physical, cognitive, or emotional health.1-3 Treatments often focus on symptom management in an attempt to limit loss of function and extent of disability, but measurement of treatment efficacy and effectiveness has typically focused on biological or impairment level assessment. Research has recently begun to include patient-reported outcomes such as health-related quality of life (HRQL).Although patient reports of functional status and activities of daily living are widespread, such measures do not capture the multidimensional impact of neurological conditions.4-7 Available HRQL measures are either generic, targeted to specific neurological conditions, or a hybrid of both.8-17 Yet no currently available measurement system targets children with neurological conditions or captures a complete picture of HRQL that allows comparison of children with different neurological conditions experiencing similar symptoms.
To meet these needs, the National Institute of Neurological Disorders and Stroke (NINDS) initiated an effort to develop a HRQL measurement system for adults and children with neurological conditions (Neuro-QOL). The pediatric Neuro-QOL was designed to include both generic and targeted item banks and was developed using both classical test theory and modern item response theory (IRT) approaches.18,19 “Generic” refers to domains relevant to children with various neurological conditions, whereas “targeted” refers to symptoms or issues unique to a specific condition. This distinction allows for HRQL comparisons with other populations using generic measures, while capturing the impact of symptoms unique to the population of interest.
An item bank consists of items carefully calibrated through the use of IRT, which develops, defines, and quantifies common themes and thus provides an operational definition of a latent trait.20,21 An item bank provides the foundation for adaptive testing, either dynamic using computerized adaptive testing (CAT) or static using multiple created short-forms. CAT is a process of test administration in which items are selected on the basis of the patients’ responses to previously administered items. 22 This process uses an algorithm to estimate person level (eg, fatigue) to choose the next best item and administer the test under specifications such as content coverage and scale length. This capacity to measure all patients on the same continuum, even if they have not been presented any items in common, offers a scale that is individually tailored to each patient.
The purpose of this article is to describe the development of the pediatric Neuro-QOL. We use “item pool” to represent a set of items that conceptually define the same construct, “item banks” for items that are calibrated onto the same measurement continuum using IRT models, and “scale” for items that can be summed to produce a total score but cannot be calibrated using IRT models.
Methods
Development of the Pediatric Neuro-QOL Item Pool
Pediatric epilepsy and muscular dystrophy were the conditions selected for test development. This choice came from an expert consensus panel using a modified Delphi approach and factoring in the priority areas of NINDS. Steps taken to select domains to be tested included interviews of clinicians, children/parent focus groups, literature review, consensus meetings within the Neuro-QOL team, and consideration of priorities within the NINDS. A preliminary domain list was generated through an extensive literature review of 24 major neurological conditions and their impact on HRQL. This list was supplemented with (a) findings from expert interviews during which experts identified domains important to cover in an HRQL questionnaire for people with neurological disease and (b) qualitative analysis results of 8 focus groups with patients (N = 64) and 3 with caregivers (N = 19) concerning the impact of neurological conditions on HRQL domains. Aggregated data were reviewed by condition-specific working groups that extracted the most frequently named and relevant domains and subdomains for potential item bank development. Final domains and subdomains were selected after additional review by external consultants and discussion with NINDS. Details are described elsewhere.23-25 Items were developed to address generic concerns across conditions and those targeted to children with unique neurological conditions. The generic domains included physical function (with content areas, lower extremity function–mobility and upper extremity function–fine motor and ADL [activities of daily living]), emotional health (with content areas, depression, anxiety, and anger), and social health (with content areas, interaction with peers, and interaction with adults); whereas the targeted domains included stigma, fatigue, pain, and applied cognition.
We defined the content areas included within each domain, reviewed existing instruments, and added new items to cover content gaps. Items were then reviewed by experts who were not involved in developing the initial item pool to further ensure all clinical concerns were captured and the wording was appropriate for children aged 10 years and older. Cognitive interviews were conducted in which each item was reviewed by at least 5 children aged 10 to 18 years to ensure appropriate understanding and literacy levels.
Participants and Procedures
Because the generic item pools could be answered by a person without a medical condition, generic domains were field tested on samples from the US pediatric general population. Targeted item pools, typically symptoms or side effects of a disease process, were field tested on children with either epilepsy or muscular dystrophy. Samples were recruited via Internet panel companies: Toluna (http://www.toluna.com) and YouGovPolimetrix (http://www.polimetrix.com) for the US general population and clinical samples, respectively. Companies sent e-mail invitations to parents of potential participants from their database to participate in the field testing. Potential participants were screened for eligibility via the Internet. Criterion for inclusion in the study included fluency in English, age between 10 and 17 years, and for disease-related domains, a diagnosis of epilepsy or a muscular dystrophy. After parents provided online consent on behalf of their children, parents completed a series of sociodemographic and clinical questions (for disease samples only) and children completed appropriate Neuro-QOL items. Table 1 shows participant characteristics and the domains they completed.
Sample Information
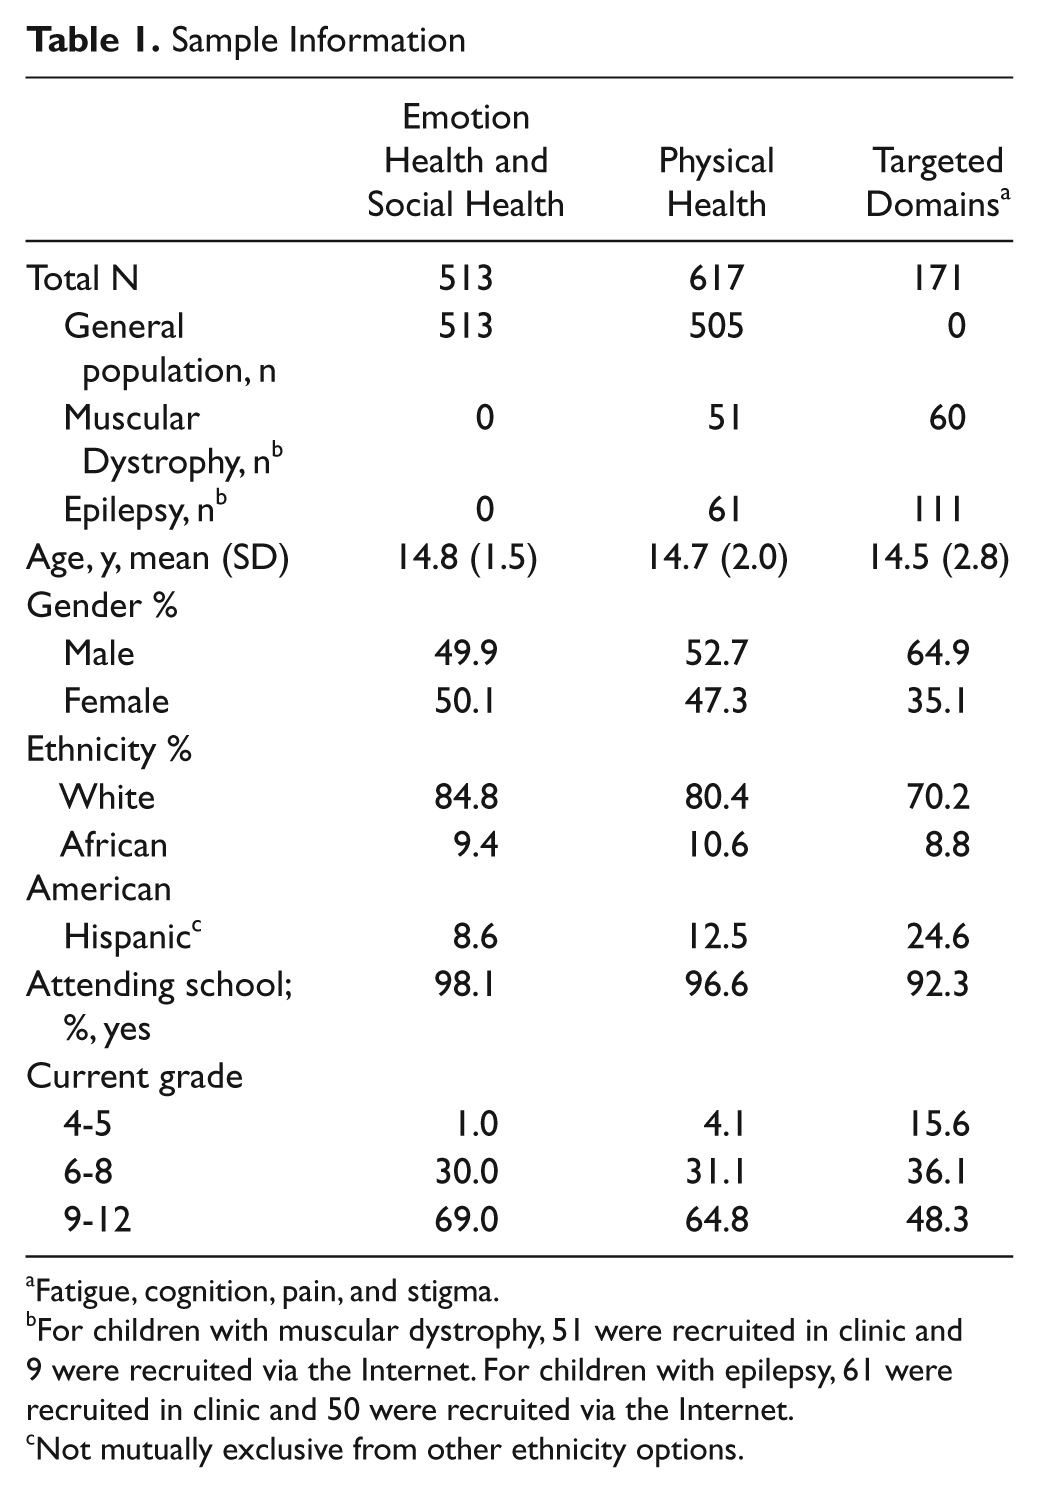
Fatigue, cognition, pain, and stigma.
For children with muscular dystrophy, 51 were recruited in clinic and 9 were recruited via the Internet. For children with epilepsy, 61 were recruited in clinic and 50 were recruited via the Internet.
Not mutually exclusive from other ethnicity options.
The item pools were administered in 2 waves of testing. The first wave included domains appropriate for the general population (ie, generic domains of emotional and physical health). Of 1018 children being recruited, 64.6% did not report any neurological conditions; 25.0% reported 1 condition and 8% reported 2 conditions. The conditions listed in the survey were attention deficit disorder, attention deficit-hyperactivity disorder, Asperger syndrome, autism, cerebral palsy, epilepsy, migraine (headache), muscular dystrophy, myasthenia gravis, spinal cord injury, and traumatic brain injury. The second wave included domains that are more appropriate for children with neurological conditions (targeted domains such as fatigue, cognition, pain, and stigma). These domains were tested on children with epilepsy (n = 50) or muscular dystrophy (n = 9) via an online panel and 61 from epilepsy clinics at Children’s Memorial Hospital, Chicago, Illinois (CMH) and North Shore University Health System (Evanston, Illinois) and 51 with muscular dystrophy from the University of California Davis Medical Center. The same inclusion criteria as for the Internet sample were used (English-speaking, age 10-17 years). Yet because of the nature and developmental impact of muscular dystrophy and recruitment difficulty, we extended the age range to 21 years. For children with epilepsy recruited in clinics, 60% did not have a seizure in the past 3 months, 7% had 1, 3% had 2, and 5% had 3 episodes. All were taking anti-epilepsy medication. Of the 51 with muscular dystrophy, 65% were Duchenne muscular dystrophy and the remainder represented a mix of moderate to severe phenotypes typically found to affect children and adolescents; 55% reported using a wheelchair, 18% used corticosteroids, 18% were currently or had previously used glucocorticoids for strength maintenance, and 18% required some degree of noninvasive ventilator assistance. Though physical health-related domains are considered generic, items were targeted to children with moderate to severe limitations. We also tested these items in clinical samples to minimize floor effects. In-clinic testing procedures were similar to those used by the online panel companies, except that paper versions of the informed consent and assent forms were used.
This study was approved by the institutional review boards at all participating sites.
Analysis
The analysis plan is detailed elsewhere.26,27 Briefly, we evaluated dimensionality using item–total correlation (criterion: Spearman ρ > 0.3) and Cronbach α (criterion: α > .7). When the sample size was >500, samples were randomly divided into 2 data sets: One was used for exploratory factor analysis (EFA) and the other for confirmatory factor analysis (CFA) using Mplus (Muthén & Muthén, Los Angeles, California). The criteria for EFA were eigenvalues >1.0, numbers of factors before the elbow in the scree plot, and explained variance >5%. The criteria for CFA were comparative fit index (CFI) >.9, root mean square error of approximation (RMSEA) <.1, and item R2 >.3. Residual correlations between items >.15 were used to identify local dependence among items (local independence assumption is required for IRT modeling). For domains with sample size <500, EFA and CFA were conducted using the same data.
The S-G2 and S-X2 statistics 28 were used to evaluate item fit (criterion, P > .01). Samejima’s graded response model, 29 a 2-parameter logistic (2-PL) IRT model, as implemented in MULTILOG (SSI, Lincolnwood, Illinois) was used to estimate item threshold and slope parameters and information functions at the item and bank levels. We expect slope parameters to be between 1 and 5 and threshold parameter ranges that approximate the range of person scores. For domains with sample size <500, 1-PL IRT (slope parameters fixed to a constant) was used to estimate item parameters and information functions. Information functions were converted into reliability functions30,31 to evaluate precision levels along the domain continuum. We consider item banks to be psychometrically acceptable when the IRT-scaled scores of those with lower function or more severe symptoms can be measured with reliability >.9.
CAT platforms were developed for domains with satisfactory IRT results and a brief version of each item bank (ie, short-form) was constructed. These short-forms are designed for use in clinical settings where computerized testing is not feasible. Candidate items were selected based on (a) ranks of items selected in CAT simulations using the Firestar software (http://www.nihpromis.org/firestar), (b) ranks of the item information functions along the continuum, (c) content balancing, and (d) consensus among the Neuro-QOL team members.
Results
General information about each item bank is shown in Table 2 and IRT results are summarized in Table 3.
Pediatric Neuro-QOL Generic and Targeted Domains
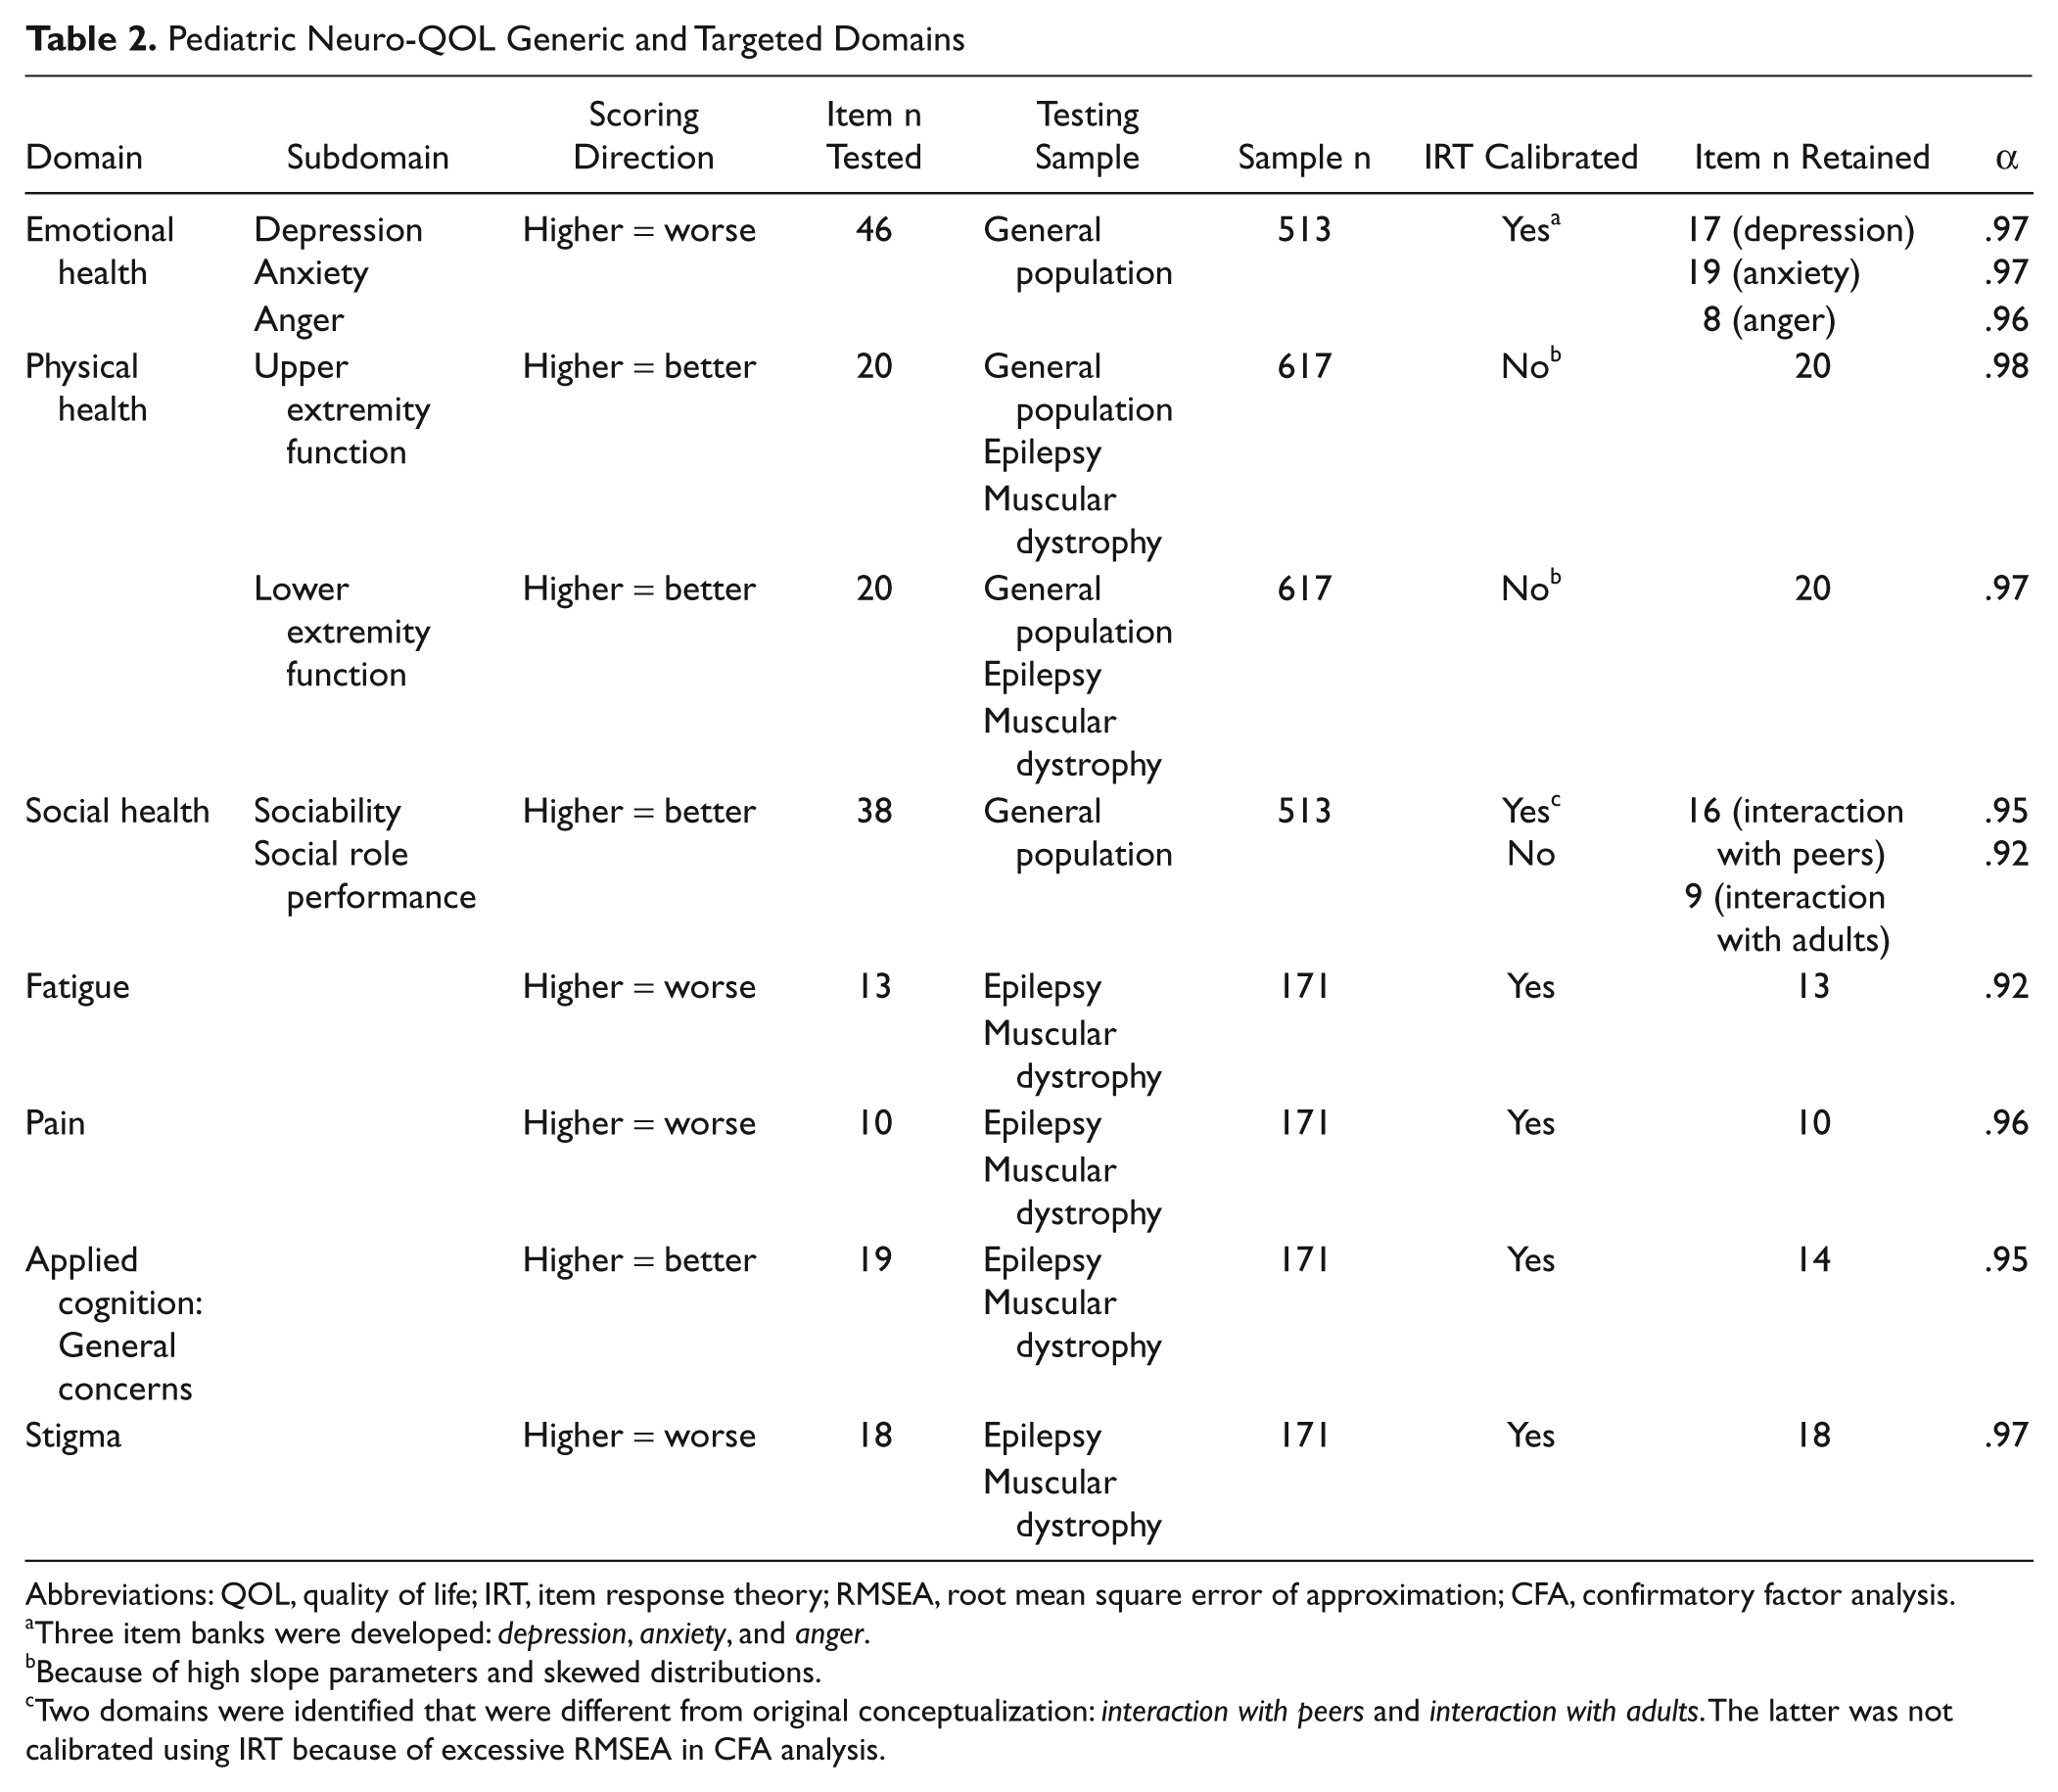
Abbreviations: QOL, quality of life; IRT, item response theory; RMSEA, root mean square error of approximation; CFA, confirmatory factor analysis.
Three item banks were developed: depression, anxiety, and anger.
Because of high slope parameters and skewed distributions.
Two domains were identified that were different from original conceptualization: interaction with peers and interaction with adults. The latter was not calibrated using IRT because of excessive RMSEA in CFA analysis.
IRT Analysis Summary a
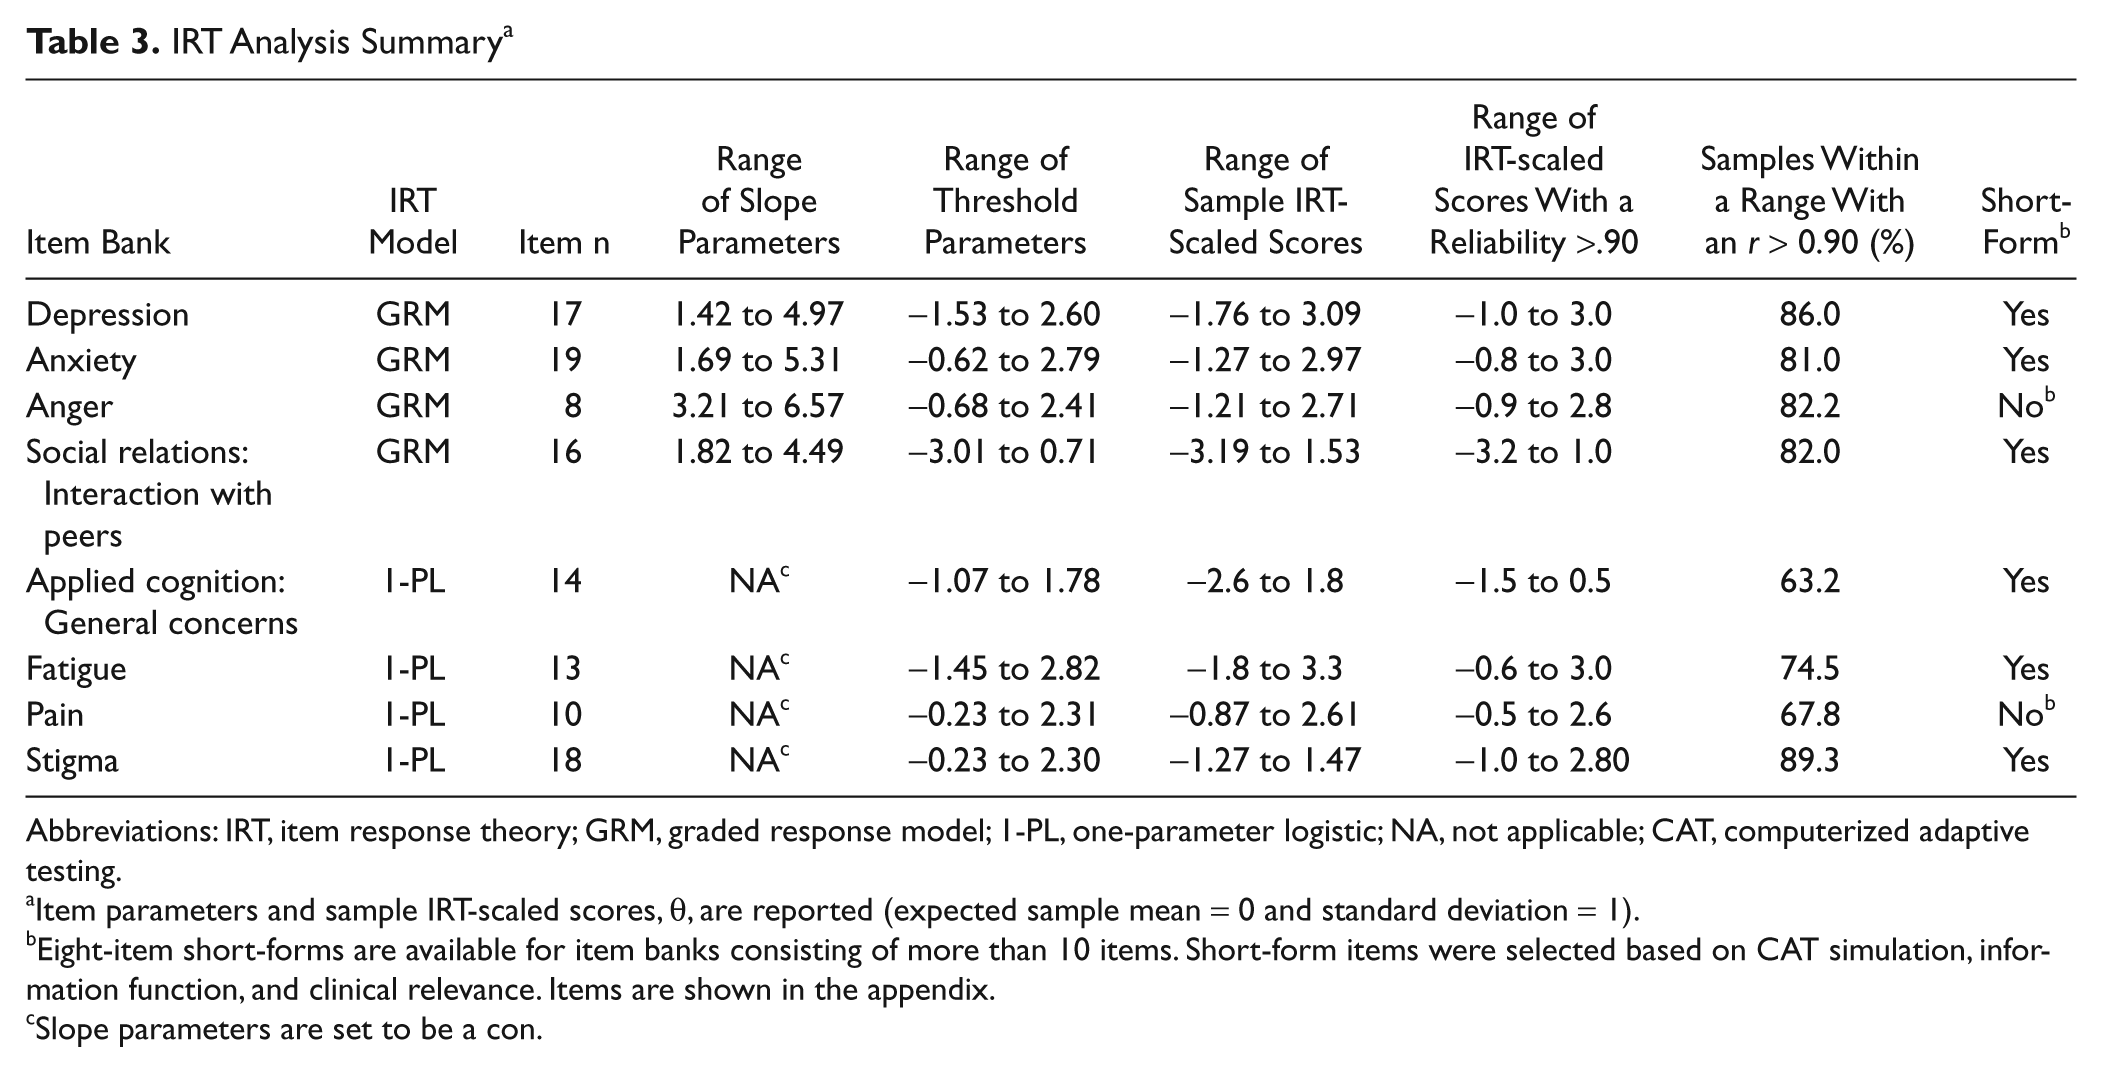
Abbreviations: IRT, item response theory; GRM, graded response model; 1-PL, one-parameter logistic; NA, not applicable; CAT, computerized adaptive testing.
Item parameters and sample IRT-scaled scores, θ, are reported (expected sample mean = 0 and standard deviation = 1).
Eight-item short-forms are available for item banks consisting of more than 10 items. Short-form items were selected based on CAT simulation, information function, and clinical relevance. Items are shown in the appendix.
Slope parameters are set to be a con.
Generic Domains: Emotional, Social, and Physical Health
Emotional Health
This domain consisted of 3 item banks measuring depression, anxiety, and anger. Item-scale correlations ranged from .50 to .88 except for one item (I felt like eating; r = 0.12). Cronbach α for all 46 items was .99. The EFA scree plot supported a single dominant factor explaining 32.2% of variance. Both a single and separate factor models were explored to better understand the relationships among items. Although none of these models had RMSEA < .1, acceptable fit indices were found from a 1-factor model (CFI = .92), a 1-factor model with depression items only (CFI = .97), a 1-factor model with anxiety items only (CFI = .97), and a 1-factor model with anger items only (CFI = .99); all R2 values were >.3 and all residual correlations were <.15, indicating local independence among items. In the 3-factor model, high correlations among factors (.84-.95) were found, suggesting that a single emotional health bank was potentially unidimensional. However, because clinicians tend to conceptualize these factors or concepts as being different from one another, we decided to calibrate these 3 item banks separately.
In the IRT-related analyses, all items had acceptable fit statistics, except one depression item (I wanted to be by myself; P < .001). This item was removed from the final bank. For the Depression item bank, slope parameters ranged from 1.42 to 4.97 and threshold parameters ranged from −1.53 to 2.60. The IRT-scaled scores ranged from −1.76 to 3.09, wider than the range of threshold parameters. Yet as shown in Figure 1a, where the bank information function is shown on the upper half and the sample IRT-scaled scores histogram is shown on the lower half, when scaled scores ranged from −1.0 and 3.0, 86% of the sample was measured reliably (r > 0.9). For the Anxiety item bank, slope parameters ranged from 1.69 to 5.31, threshold parameters ranged from −0.62 to 2.79, and person scores ranged from −1.27 to 2.97. As shown in Figure 1b, when IRT-scaled scores ranged from −0.8 to 3.0, 81% of the sample was measured reliably. For the Anger item bank, generally high slope parameters were found (range = 3.21 to 6.57), which was partly because of a skewed distribution of the sample (very few reporting significant anger). We therefore consider this a provisional item bank. Threshold parameters ranged from −0.68 to 2.41 and scaled scores ranged from −1.21 to 2.71. As shown in Figure 1c, when scaled scores ranged from −0.9 to 2.7, 82.2% of the sample was reliably measured.
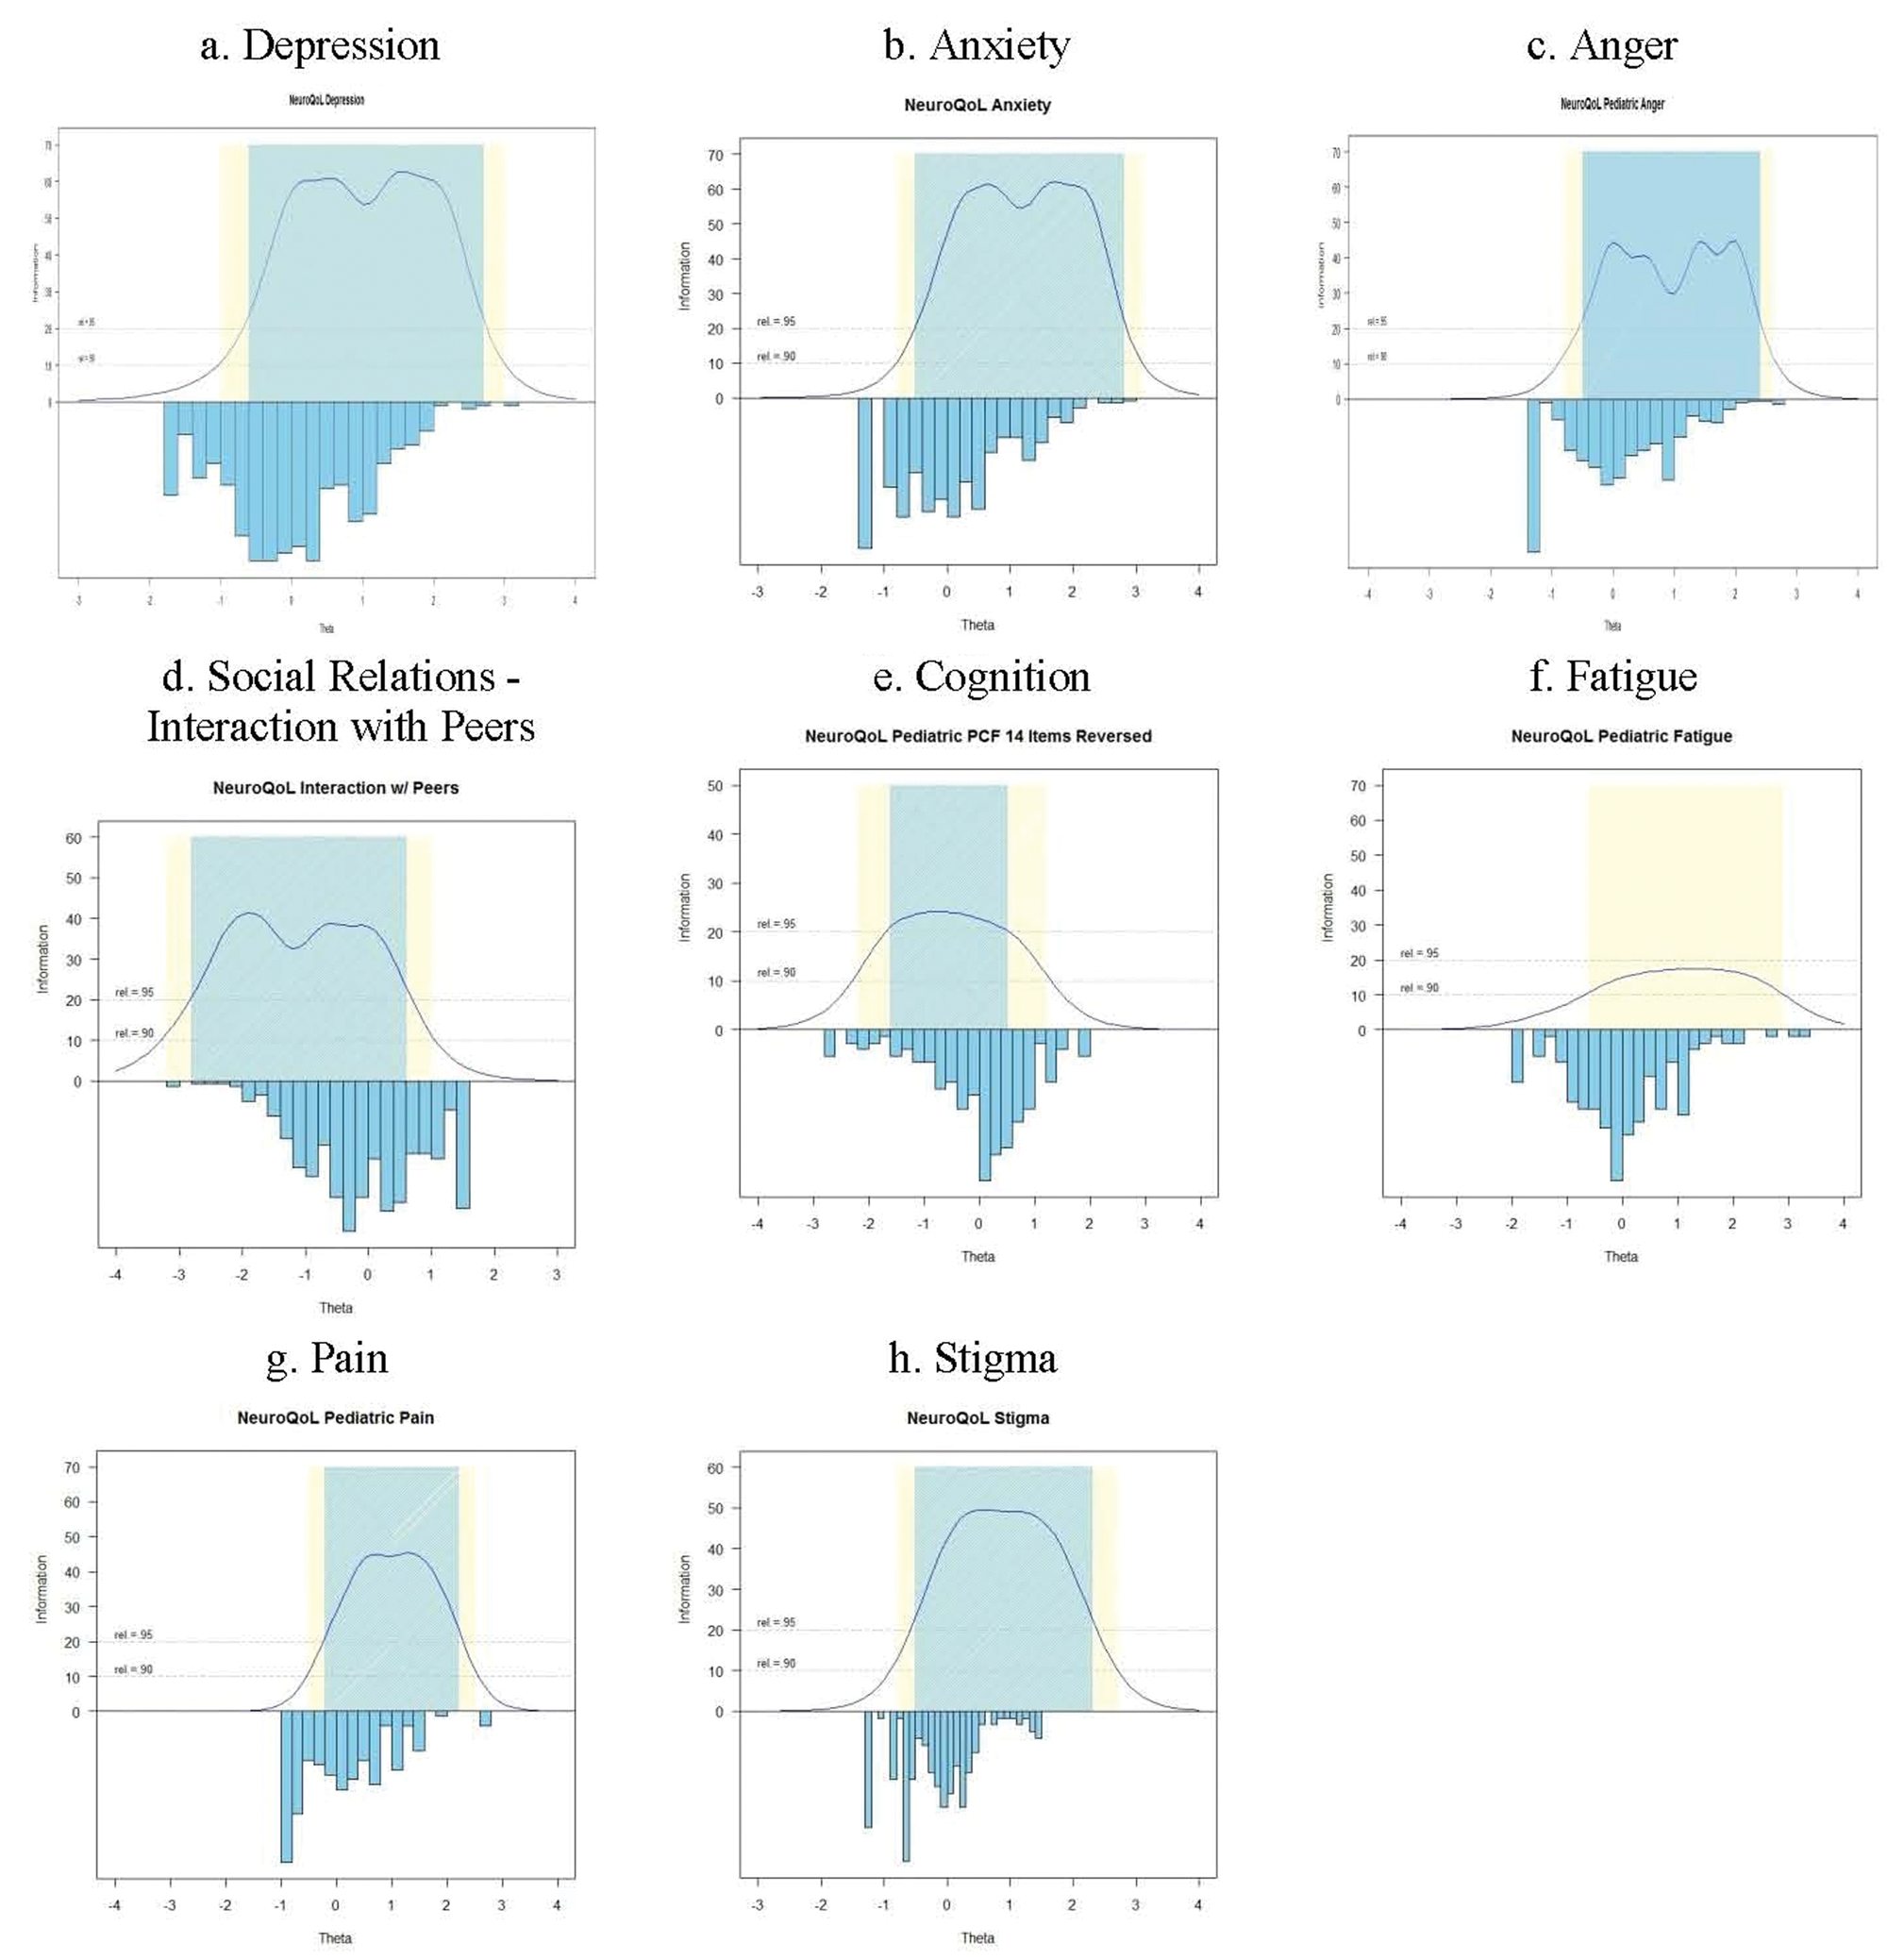
Precision of the item banks across the measurement continuum compared with sample distribution. Area in blue represents the range with reliability ≥95% whereas the area in yellow represents the range with reliability between .90 and .95. Precision information is not available for “Upper Extremity (ADL)” and “Lower Extremity (Mobility)” scales as these scales cannot be calibrated using IRT analyses. Abbreviations: ADL, activities of daily living; IRT, item response theory.
Social Health
Item–scale correlations ranged from .43 to .81 and Cronbach α for all 36 items was .97. In the EFA, all items had item loadings >0.5 in the initial analysis. However, the scree plot suggested the possibility of 2 to 3 factors with the first factor being dominant; eigenvalue = 21.2, 2.34, 2.32, 1.40, 1.14 for the first 5 factors, respectively. Though social health was initially designed to tap concepts of sociability and role performance, the EFA results suggested interactions with peers and adults to be more appropriate. The CFA analyses confirmed this assumption with acceptable fit indices: CFI = .94 for interaction with peers (n = 17) and CFI = .97 for interaction with adults (n = 9). No local dependence was detected; however, RMSEA was .15 and .25 for interaction with peers and with adults, respectively. The team decided not to proceed with the IRT analysis for the domain of interaction with adults given its high RMSEA.
All items had acceptable fit statistics except one (In the past 7 days, I got along with my classmates; P < .01), which was removed from the final “interaction with peers” bank. In the IRT analysis, slope parameters ranged from 1.82 to 4.49, threshold parameters ranged from −3.01 to 0.71, and sample scaled scores ranged from −3.19 to 1.53. For scaled scores ranging from −3.20 to 1.0, 82% of the sample was reliably measured (Figure 1d; Table 3).
Physical Health
Upper extremity function—Fine motor, ADL
Item–total correlations ranged from .55 to .91, and Cronbach α for all 20 items was .98. More than 75% of the sample selected the most functional response category (with no trouble) on all items, producing a skewed distribution (Figure 2a). The EFA scree plot was consistent with a single dominant factor explaining 88.8% of variance. All items had factor loadings >0.3 on the first factor, ranging from 0.66 to 0.97. Good CFA fit indices were found (CFI = .99, RMSEA = .09), all R2 > .3, and no local dependence was detected. Thus, the unidimensionality of these 20 items was supported. All items had acceptable fit statistics, except two (I was able to zip up my clothes and I was able to make a phone call using a touch tone key-pad).
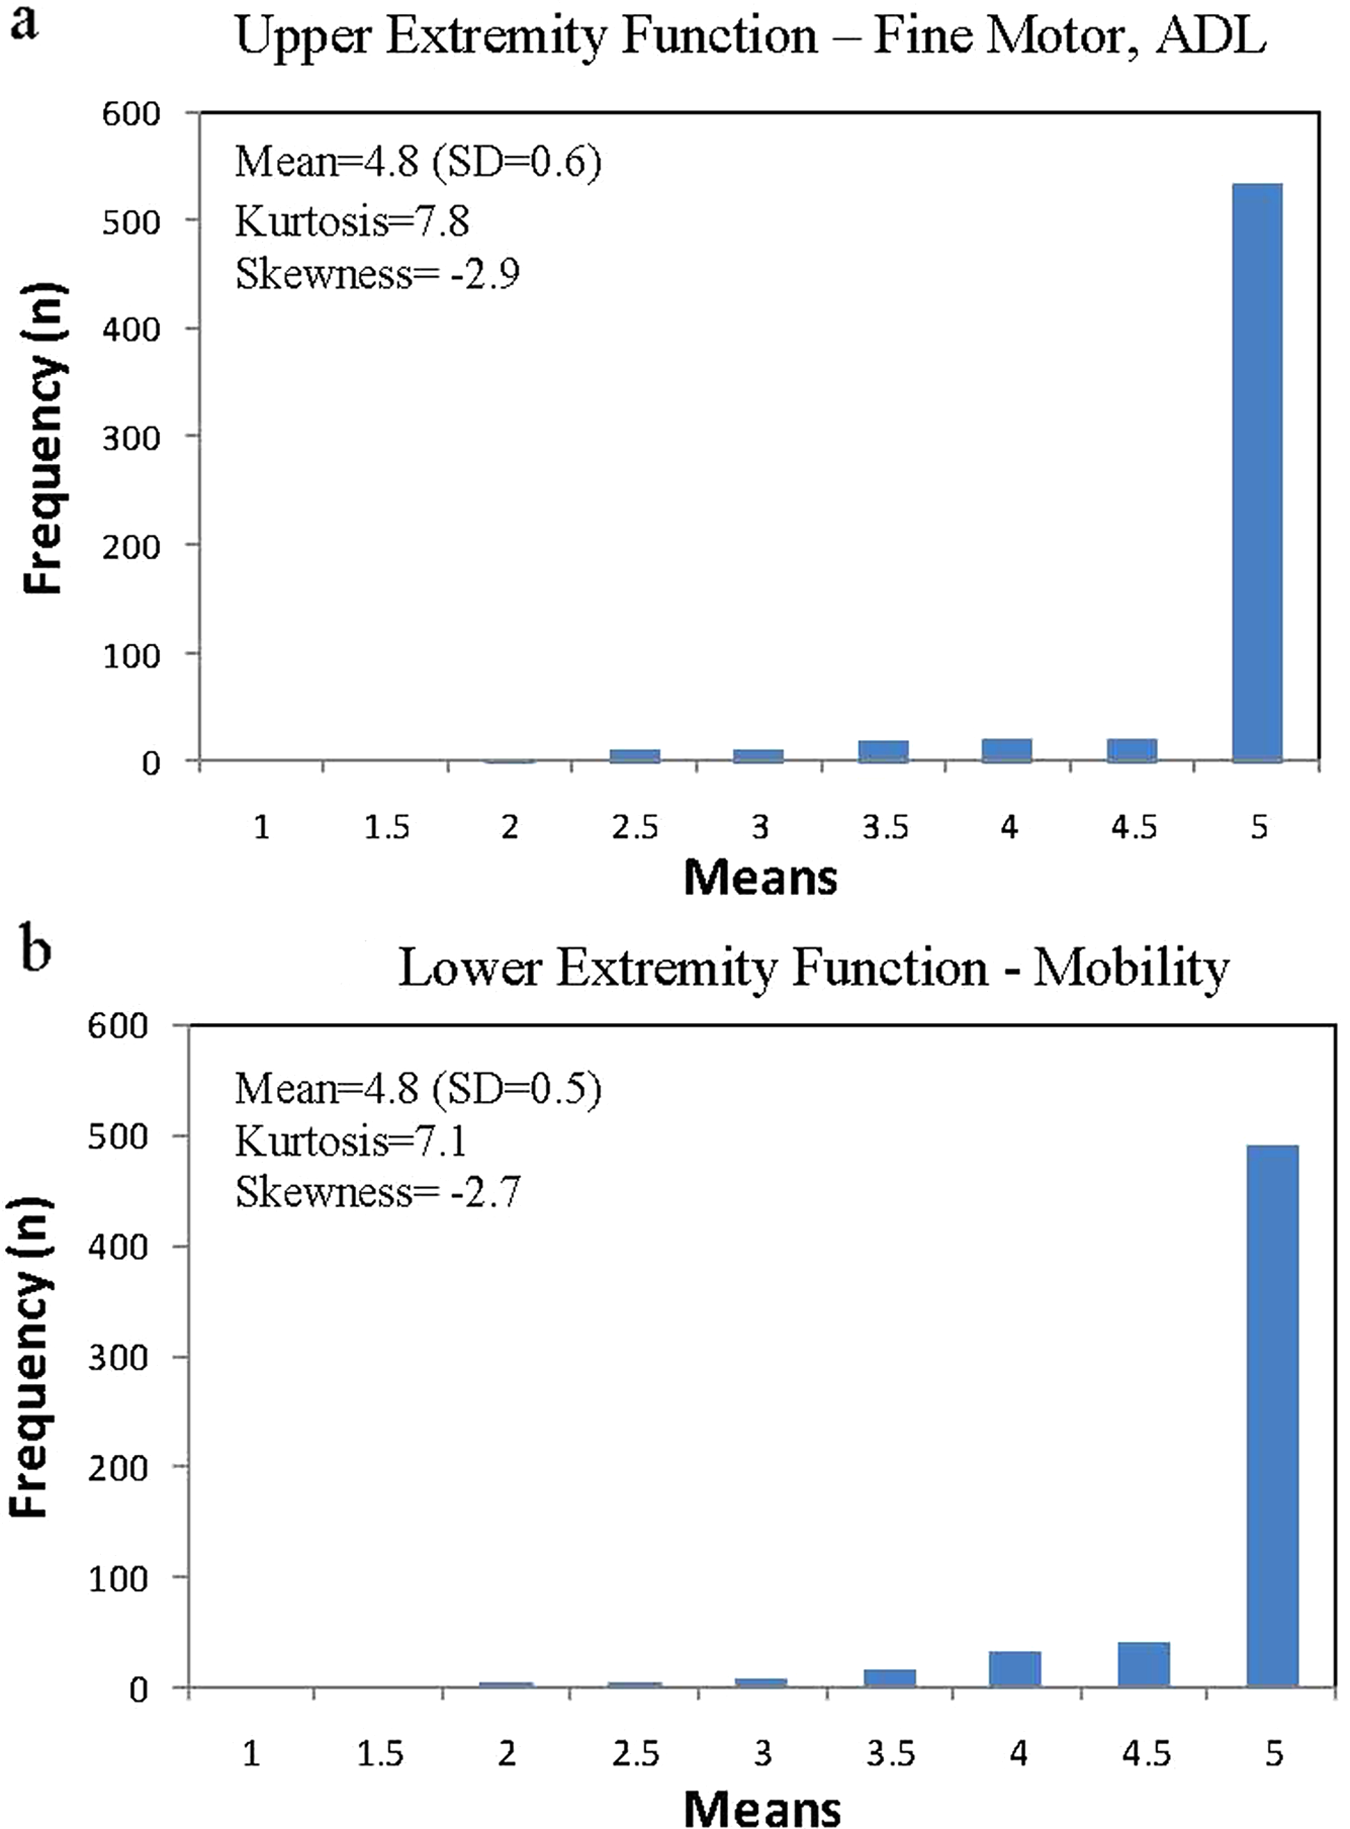
Distributions of upper and lower extremity function scales (in raw score unit). Possible scores range from 1 to 5 and higher scores represent better function. a.Upper extremity function—Fine motor, ADL (activities of daily living). b. Lower extremity function—Mobility.
Lower extremity function—Mobility
Item–total correlation ranged from .65 to .85, and Cronbach α for all 20 items was .97. Similar to Upper Extremity Function domain, a skewed distribution (see Figure 2b) was found: All items had more than 65% of the sample selecting the most functional response category. The EFA scree plot revealed a dominant single factor that explained 82.2% of variance. All items had factor loadings >0.3 on the first factor, ranging from 0.67 (I fall down easily) to 0.89 (I could get in and out of a car). CFA fit statistics were good (CFI = .98, RMSEA = .08), all R2 > .3; no local dependence was detected, and all items had acceptable fit statistics. The unidimensionality of these items was supported.
The item parameters for both domains showed high slope values, ranging from 3.6 to 8.6 for Lower Extremity Function—Mobility (19 item had slope >4) and from 3.5 to 12.3 for Upper Extremity Function—Fine Motor, ADL (18 items had slopes >4). This resulted from the skewed distributions, which were mainly because of insufficient numbers of patients with severe physical dysfunction. We therefore opted not to calibrate physical health items using IRT. Instead, we produced brief scales.
Targeted Domains: Fatigue, Pain, Applied Cognition—General Concerns and Stigma
Applied Cognition: General Concerns
Item–total correlations ranged from .54 to .83 and Cronbach α for these 19 items was .96. The EFA scree plot supported a single dominant factor explaining 63.0% of the variance. The factor loadings on the first factor ranged from 0.36 to 0.82. Five items were removed because of local dependence. For the remaining 14 items, CFI = .91, RMSEA = .15, all R2 > .3, and no local dependence was detected. The fit statistics showed that all 14 items had adequate or better model fit except for one item (I sometimes forget what I was going to say; P = .0012). We retained this item as it is one of the most common complaints of patients and parents. Because of the smaller sample size, threshold parameters were estimated using 1-PL model. Thresholds ranged from −1.07 to 1.78 and IRT-scaled scores ranged from −2.60 to 1.80. Although the scaled score distribution is slightly skewed (Figure 1e; Table 3); when scaled scores ranged from −1.5 to 0.5, 63.2% of the sample was measured reliably.
Fatigue
Item–total correlations ranged from .44 to .82, and Cronbach α was .92. The scree plot revealed a single dominant factor with an eigenvalue of 7.92 that explained 60.9% of the variance. In the CFA, all items had R2 > .3 except one (I had energy (or strength), R2 = .25). The CFI (.92) was acceptable with RMSEA = .12. The residual correlation between I had energy (or strength) and I could do my usual things at home (.234) exceeded the expected value. We hypothesized this was partially because they were the only 2 positively phrased items in the pool and the direction of question wording can itself be a factor independent of the concept being measured. As both items tap important concepts in measuring fatigue experiences, the team decided to retain both items in the pool. All items had acceptable fit statistics. Threshold parameters ranged from −1.45 to 2.82. Although the scaled score distribution is slightly skewed, when the scores ranged from −0.6 to 3.0, 74.9% of the sample was measured reliably (Figure 1f; Table 3).
Pain
Item–total correlations ranged from .75 to .88, and Cronbach α was .95. The scree plot supported a single factor, with an eigenvalue of 8.24, explaining 82.4% of the variance. Acceptable fit indices were found in the CFA (CFI = .99, RMSEA = .07), all R2 > .3, no local dependence was detected, and all items had acceptable fit statistics. Thresholds ranged from −0.23 to 2.31 and scaled scores for the sample ranged from −0.87 to 2.61. Although the scale score distribution is skewed, when the scores ranged from −0.5 to 2.6, 67.8% of the sample was measured reliably (Figure 1g; Table 3). Among patients who had scaled scores with r < 0.9, only 3 children reported severe pain and the rest reported minimal or negligible pain.
Stigma
Item–total correlations ranged from .77 to .88, and Cronbach α was .97. In EFA, one factor was supported by the scree plot, with an eigenvalue of 14.5 and explaining 80.6% of the overall variance. CFA results were acceptable (CFI = .95) although a slightly larger than expected RMSEA value (.16) was found, and all R2 > .3. No local dependence was detected and in the IRT-related analyses, all items had acceptable fit statistics. Threshold parameters ranged from −0.45 to 2.30. The scaled scores for the sample ranged from −1.27 to 1.47, with 89.3% of the sample measured reliably (Figure 1h; Table 3).
Discussion
We report the development and psychometric properties of the pediatric Neuro-QOL’s 8 item banks (Anxiety, Depression, Anger, Social Relations—Interaction with Peers, Fatigue, Applied Cognition—General Concerns, Stigma, Pain) and 2 scales (Upper Extremity Function—Fine Motor, ADL; Lower Extremity Function—Mobility). The pediatric Neuro-QOL system overview is shown in Figure 3. With one exception, the unidimensionality of all item banks and scales was supported. That exception was Social Relations—Interaction with Adults. For all banks, item parameters were estimated using IRT models, either 2-PL or 1-PL, depending on the sample size. These banks are the foundation for both dynamic CAT and static short-forms, which are available for clinical use. With respect to the scales, we decided not to calibrate Upper Extremity Function and Lower Extremity Function because of their high item parameters values. We believe that such high values resulted from skewed distributions (see Figure 2), despite the acceptable fit indices noted in CFA. Both of the physical function domains target patients commonly seen in rehabilitation clinics, and items were developed based on clinical experiences and neurological rehabilitation-related theories such as motor control,32-34 with reference to the International Classification of Functioning, Disability and Health. 35 We were unable to recruit sufficient numbers of patients with severe limitations in either upper or lower extremity functioning and thus did not pursue further IRT-related analyses for these domains at this time. These 2 domains are key concerns for children with neurological conditions and excluding them was untenable as they capture important concerns for most children with neurological conditions. Given the satisfactory results of the classical test theory analyses, we concluded that traditional summation scoring of these 2 scales can be used in research and clinical settings. In terms of interaction with adults, we were unable to support the unidimensionality of these 9 items, despite its high internal consistency. Further research should be conducted to support reliable, valid measurement of this domain.

Pediatric Neuro-QOL Model (B = item bank; S = scale). *“Interaction with adults” is domain identified, and no scale or item bank is available for this domain.
Several strengths of the pediatric Neuro-QOL are noted. The domains and items included in the pediatric Neuro-QOL were built on a patient/parent perspective reflecting the concept of HRQL being self-referenced. Additionally, this measurement system consists of both generic and targeted domains, which allows investigators to compare children’s health status with other disease groups and even the US general population while capturing unique experiences from individual patient groups. The pediatric Neuro-QOL provides an opportunity to better understand the components of well-being for children with neurological conditions and is not the only measurement system calibrated on children in the US general population; others include the pediatric Patient Reported Outcomes Information System (pediatric PROMIS; http://www.nihpromis.org) and the pediatric Perceived Cognitive Function item bank (pedsPCF). 36 Further evaluation of the commonalities and differences between item banks capturing the same concepts but using different samples from the US general population is warranted. Reconciliation among these measurement systems can be of tremendous benefit to clinical researchers and the field of HRQL for children with chronic illness.
Several limitations are also noted. Targeted item banks were calibrated using a 1-PL IRT model. Ideally, we would like to apply both 1-PL and 2-PL IRT models to the data, as each has valuable information to offer. For the current project, we chose 2-PL IRT when possible to incorporate the discrimination function of each item into the final item information function estimation. Theoretically, such an approach could improve the efficiency of the CAT administration as the most informative items are differentiated from less informative items and are more likely to be chosen. Sample size limitations on the targeted banks required that we restrict analyses to a 1-PL (Rasch) model. Future research can help determine the extent to which these results are replicated or consistent with a 2-PL approach. Second, different degrees of skewness were noted across domains, with skewed distributions especially hindering the implementation of the IRT analysis to the domains of upper and lower extremity function. An expanded sample pool, in particular one that includes those with moderate or severe symptoms, is needed to produce stable IRT results and to evaluate the robustness of the pediatric Neuro-QOL measurement properties. Third, when defining reliable measures as those with associated reliability >.9, 3 targeted item banks (Applied Cognition, Fatigue, and Pain) had less than 80% of samples reliably measured; however, the majority of the remaining cases were children with better functioning (ie, less fatigue, less pain, and better applied cognition). We are less concerned about low precision for children with high functioning and expect that the range of reliable measures will be improved by expanding the sample pool. Because of finite resources, we limited our clinical samples to children with either epilepsy or muscular dystrophy in this initial effort. We hoped to cover the majority of concerns experienced by children with other neurological conditions; specifically, using data from children with muscular dystrophy to establish more stable item parameter estimation for physical-related domains and data from children with epilepsy to enhance measurement properties for cognitive-related domains. Future studies should evaluate the applicability of the pediatric Neuro-QOL to children with other neurological conditions and to younger children, and evaluate its validity against important clinical variables. Our ultimate goal is to have a psychometrically sound measurement system for children with all neurological conditions.
In conclusion, the pediatric Neuro-QOL is a psychometrically sound measurement system that can be used in a research setting. Studies to evaluate its clinical validity should be completed before it is used for condition-specific clinical trials. The pediatric Neuro-QOL will be available in Assessment CenterSM (http://www.assessmentcenter.net/ac1/) in the near future for use by the research community. Calibration of a Spanish version of the pediatric Neuro-QOL will be available soon.
Footnotes
Appendix
Neuro-QOL Pediatric Short-Form Domains, Contexts, Item Stems, and Response Options
| Domain | Context | Item Stem | Response Options |
|---|---|---|---|
| Stigma | Lately | Because of my illness, others my age avoided me. Because of my illness, I felt left out of things. Because of my illness, others my age made fun of me. Because of my illness, I felt embarrassed when I was in front of others my age. Because of my illness, I was treated unfairly by others my age. Because of my illness, others my age tended to ignore my good points. Because of my illness, I felt different from others my age. I avoided making new friends to avoid talking about my illness. |
1 = Never 2 = Rarely 3 = Sometimes 4 = Often 5 = Always |
| Depression | In the past 7 days | I felt too sad to do things with friends. I felt sad. I felt lonely. I was less interested in doing things I usually enjoy. It was hard for me to care about anything. It was hard for me to have fun. I felt like I couldn’t do anything right. I felt everything in my life went wrong. |
1 = Never 2 = Almost never 3 = Sometimes 4 = Often 5 = Almost always |
| Anxiety | In the past 7 days | I felt afraid to go out alone. Being worried made it hard for me to be with my friends. It was hard to do schoolwork because I was nervous or worried. I felt afraid. I worried when I was at home. I felt worried. I worry that my health might get worse. I worry about doing well in school. |
1 = Never 2 = Almost never 3 = Sometimes 4 = Often 5 = Almost always or 1 = Not at all 2 = A little bit 3 = Somewhat 4 = Quite a bit 5 = Very much |
| Anger | In the past 7 days | Being angry made it hard for me to be with my friends. It was hard to do schoolwork because I was angry. I felt angry. I was so mad that I felt like throwing something. I was so mad that I felt like hitting something. I was so mad that I felt like yelling at someone. I was so mad that I felt like breaking things. I was so mad that I acted grouchy toward other people. |
1 = Never 2 = Almost never 3 = Sometimes 4 = Often 5 = Almost always |
| Interaction with peers | In the past 7 days | I felt close to my friends. I was able to count on my friends. I felt comfortable with others my age. I was happy with the friends I had. I felt comfortable talking with my friends. I spent time with my friends. My friends and I helped each other out. I had fun with my friends. |
1 = Never 2 = Almost never 3 = Sometimes 4 = Often 5 = Almost always |
| Applied cognition: General concerns | I forget schoolwork that I need to do. |
5 = Not at all |
|
| Fatigue | In the past 7 days | I felt tired. |
1 = None of the time |
| Pain | In the past 7 days | I had a lot of pain. |
1 = Never |

Acknowledgements
We acknowledge Seung Choi, PhD, for psychometric programming support, and Vitali Ustsinovich, MA, for project coordination. We thank Dr Douglas R. Nordli, MD, at the Epilepsy Center, Children’s Memorial Hospital, Chicago for contributing patients for field testing.
The author(s) declared no potential conflicts of interest with respect to the research, authorship, and/or publication of this article.
The author(s) disclosed receipt of the following financial support for the research, authorship, and/or publication of this article: This project is supported by the National Institute of Neurological Disorders and Stroke (HHSN265200423601C; Principal Investigator: David Cella).