
Abstract
Background and Purpose. Little is known about the outcome and recovery mechanisms of visual perception after a focal lesion of the occipital lobe in humans, especially after stroke. In this study, the authors aimed to describe the clinical course and the neural substrates of conscious perceptive visual deficit after posterior cerebral artery infarct. Methods. The authors prospectively included 8 patients (7 men and 1 woman; mean age, 64.6 ± 18 years) with visual deficit induced by partial damage of the striate cortex related to acute posterior cerebral artery infarct. Conscious perception of color and motion was assessed from the acute phase to the third month. Functional magnetic resonance imaging was performed to investigate neural substrates of visual recovery. Results. In the acute phase of stroke, visual deficiency was global (3/8 patients), selective to color (4/8 patients), or selective to motion (1/8 patients). During the follow-up, visual performance increased with respect to color (from 29% to 70%; P < .005) and with respect to motion (from 47% to 74%; P < .005). Despite a lack of ipsilesional V1 area activation in the acute phase, activations in this area and in the contralesional extrastriate cortex were obtained during follow-up. Both ipsilesional and contralesional V4 activations were correlated with better outcome. Conclusions. Extensive visual recovery occurs early after partial acute posterior cerebral artery infarct. Spared islands in ipsilesional V1 area and transcallosal pathways might be involved in poststroke visual recovery.
Introduction
Stroke is the leading cause of disability in adults. The natural history and processes of functional recovery of motor and language deficits after stroke have been extensively studied.1,2 However, little is known about early cerebral reorganization after poststroke visual deficit. Posterior cerebral artery infarct (PCAI), accounting for 5% to 10% of all strokes, 3 causes mainly visual deficit: homonymous hemianopia (HH) or homonymous quadranopia (HQ). Residual vision after chronic damage to the striate cortex and hypothesis about the neural substrates of these preserved visual functions have been widely described.4,5 Nevertheless, reports concerning the description and outcome of conscious visual perception deficit after acute damage to the striate cortex seem to be nonexistent. The aim of our study was to describe conscious visual perception deficit and its outcome after acute PCAI causing damage to striate cortex and to describe the dynamic processes of functional visual recovery.
Subjects and Methods
Subjects
Eight patients admitted to a tertiary stroke unit because of acute PCAI causing visual deficit were prospectively included. The study was approved by Purpan Hospital Human Studies Committees. All subjects gave their written informed consent to the study. Inclusion criteria were the following: (a) clinical evidence of HH or HQ, (b) striate cortex damage due to acute PCAI demonstrated by brain imaging (computed tomography or magnetic resonance imaging [MRI]), and (c) delay of between 24 hours and 30 days between visual deficit onset and inclusion. Exclusion criteria were the following: (a) associated middle cerebral artery infarct; (b) visuospatial neglect explored with line bisection test, Albert line cancellation test, 6 and figure copying test; (c) associated language deficit; (d) prior severe visual loss; (e) cognitive deficit with score of less than 24 on the Mini-Mental Status Examination; and (f) contraindications to MRI.
Each patient took part in 3 sessions: session 1 (between 24 hours and 30 days after acute PCAI), session 2 (1 month later), and session 3 (3 months later). During each session, the same examinations were performed: neurological and neuropsychological examination, ophthalmological examination, visual behavioral study, and brain functional MRI. The ophthalmological examination included dynamic perimetry (Goldman), static perimetry (Humphrey Field Analyzer HFA II 750 30-2; Carl Zeiss Meditec Inc, Dublin, California), and visual acuity assessment (Monoyer and Parinaud chart). No rehabilitative treatment was performed during follow-up.
Visual Behavioral Study
In this study, we focused on conscious color and motion perception with a 4-response design. Unaware perception, termed blindsight, 7 was not evaluated. Visual stimuli were generated by a PC running EVA display software and projected with JVC DLA-SX21F projectors on to a black 180° panoramic screen. Subjects were sitting at a viewing distance of 1.6 m with a device avoiding head movement and were asked to fixate a white central cross. Visual stimuli were displayed either in the “blind” hemifield or in the “safe” hemifield for only 200 ms to avoid eye movements. For each patient, stimuli position was determined by its own static perimetry at session 1. In the “blind” hemifield, visual stimuli were located at 3° horizontal eccentricity from the median border of scotoma and 3° vertical eccentricity from the altitudinal border of the scotoma (patients with hemianopia had stimuli presented at 0° vertical eccentricity). In the “safe” hemifield, visual stimuli were placed symmetrically about the central meridian. For the color experiment, stimuli were colored pixels (isoluminant red, green, yellow, and blue; 0.46 cd/m2) randomly distributed in a 5° × 5° square. For the motion experiment, we used a 5° × 0.5° black and white checkerboard, which was displayed in a 5° × 5° square located in the same position of color stimuli. Within this square, the checkerboard was displayed with a random movement (right, left, up, and down) of 5° amplitude (Supplementary Figure 1). During each session, 448 color/motion stimuli were randomly displayed in the “safe” and “blind” hemifields. The subject had to indicate the color/direction of the stimulus with a 4-position joystick. For each subject, the proportion of right responses was computed. In this individual analysis, we performed a χ2 test to compare performances obtained during the 3 sessions. Then, for the statistical group analysis, repeated-measures analysis of variance (ANOVA) was performed with 3 factors (hemifield, session, condition). A Tukey test was used for post hoc analyses.
Magnetic Resonance Imaging
Visual Stimuli
Visual stimuli were generated by a PC running PRESENTATION software (Neurobehavioral Systems, Albany, California) and projected through video goggles (NordicNeurolab, Bergen, Norway). Visual stimuli were the same as those used during the behavioral study. During rest, the screen remained black. During activation, patients had to fixate a white cross in the center of the screen, and stimuli were presented either in the blind field, at 3° into medial border of the scotoma, or symmetrically, in the safe field.
Task Paradigm
In the functional MRI experiment, 4 runs (2 conditions and 2 hemifields) were performed in a blocked design. Each run lasted 4 minutes and 30 seconds, with 11 blocks of 3 random conditions: (a) rest; (b) task: color/motion (for color runs, colored stimuli were randomly presented with a duration of 625 ms; for motion runs, the checkerboard moved in a random direction at a speed of 10°/s and an amplitude of 5°; (c) control: for color runs, control stimuli were isoluminant gray stimuli with the same shape as the colored stimuli; for motion runs, control stimuli were the same checkerboard as those used in the motion block but presented in a stationary condition with random vertical or horizontal positions.
Magnetic Resonance Imaging Data Acquisition
MRI was performed on a 1.5-T scanner (Magneton Siemens Vision, Erlangen, Germany). A 3D high-resolution T1-weighted data set of the whole brain (3D Magnetization Prepared Rapid Acquisition Gradient Echo) was acquired for each subject (relaxation time, TR = 15 ms; echo time, TE = 7 ms; inversion time, TI = 300 ms; FA 12°; 30 × 30 cm field of view (FOV); 256 × 256 matrix; voxel size = 1.17 × 1.17 × 1.17 mm3; 128 slices). Sixteen contiguous, 5-mm-thick, axial images were obtained parallel to the intercommissural plane (proton density-weighted images, TR 418 ms, TE 10 ms, FA 30°, 20 × 20 cm FOV, 128 × 128 matrix, voxel size = 1.56 × 1.56 × 5 mm3, 16 slices). A FLAIR sequence was performed to precisely define the borders of PCAI. In the functional MRI experiment, Blood Oxygen Level-Dependent (BOLD) imaging was performed using a T2 EG-weighted single-shot EPI sequence (TR 2.5 s, TE 60 ms, 90° flip angle, 20 × 20 FOV, 64 × 64 matrix, 3.125 mm in-plane resolution, 5-mm slice thickness). Sixteen slices parallel to the anterior–posterior commissure line were acquired. In each functional run, 110 volumes were collected (11 blocks of 10 volumes).
Functional MRI Postprocessing
Image analysis was performed with SPM5 (Statistical Parametric Mapping, Wellcome Department of Cognitive Neurology, London, UK). The lesioned hemisphere was conventionally the right hemisphere for functional MRI analyses. Echo-planar images were realigned to the first functional image of each time series and normalized to the SPM MNI template to perform a group analysis. The images were smoothed with a Gaussian kernel of full-width at half-maximum 7 × 7 × 10 mm.
Statistical Analyses of Functional MRI Images
Significant signal changes between rest and visual stimulation were assessed with SPM5. A voxel-by-voxel comparison according to the general linear model and t statistics was used in each patient. Single-subject contrast images (task vs rest; task vs control) were first created for each hemifield and for each session, which were then used in a second-level analysis (1-sample t test, P < .01 uncorrected) to create group maps.
Session effects
Using single-subject contrasts of task versus rest/control at each session, the session effect was assessed by an ANOVA (random effect, contrast Session 3 − Session 1 > 0, P < .01 uncorrected, extent threshold = 20 voxels; inclusive mask Session 2 − Session 1 >0; Session 3 − Session 2 >0).
Correlation analyses
Finally, with SPM, we performed a correlation analysis between the performance during the behavioral task and the functional MRI signal changes during the task (color/motion vs rest contrast) at each session (regression analysis, P < .05, uncorrected for multiple comparisons, corrected for spatial extent = 50, masked with the corresponding task activation map). Coefficients of correlation were also determined (Spearman r; Pearson r).
Results
Eight patients (7 men and 1 woman; mean age, 64.6 ± 18 years) were included (Table 1). Six patients had right PCAI, and 2 patients had left PCAI. None of them had total PCAI induced by proximal posterior cerebral artery (P1) occlusion. All of them had partial PCAI with occlusion of calcarine artery branches leading to a partial lesion of striate cortex. Five patients had restricted V1 ventral lesion. Three had V1 ventral and dorsal damage. Mean infarct volume was 19.03 cc (4.73-48.99). Perimetry showed HH (3/8 patients) or superior HQ (5/8 patients; Figure 1). The mean delay between PCAI onset and session 1 was 16.5 ± 9.5 days. All subjects participated in the whole study except 1 patient who did not finish session 3.
Demographic and Clinical Data of the 8 Patients
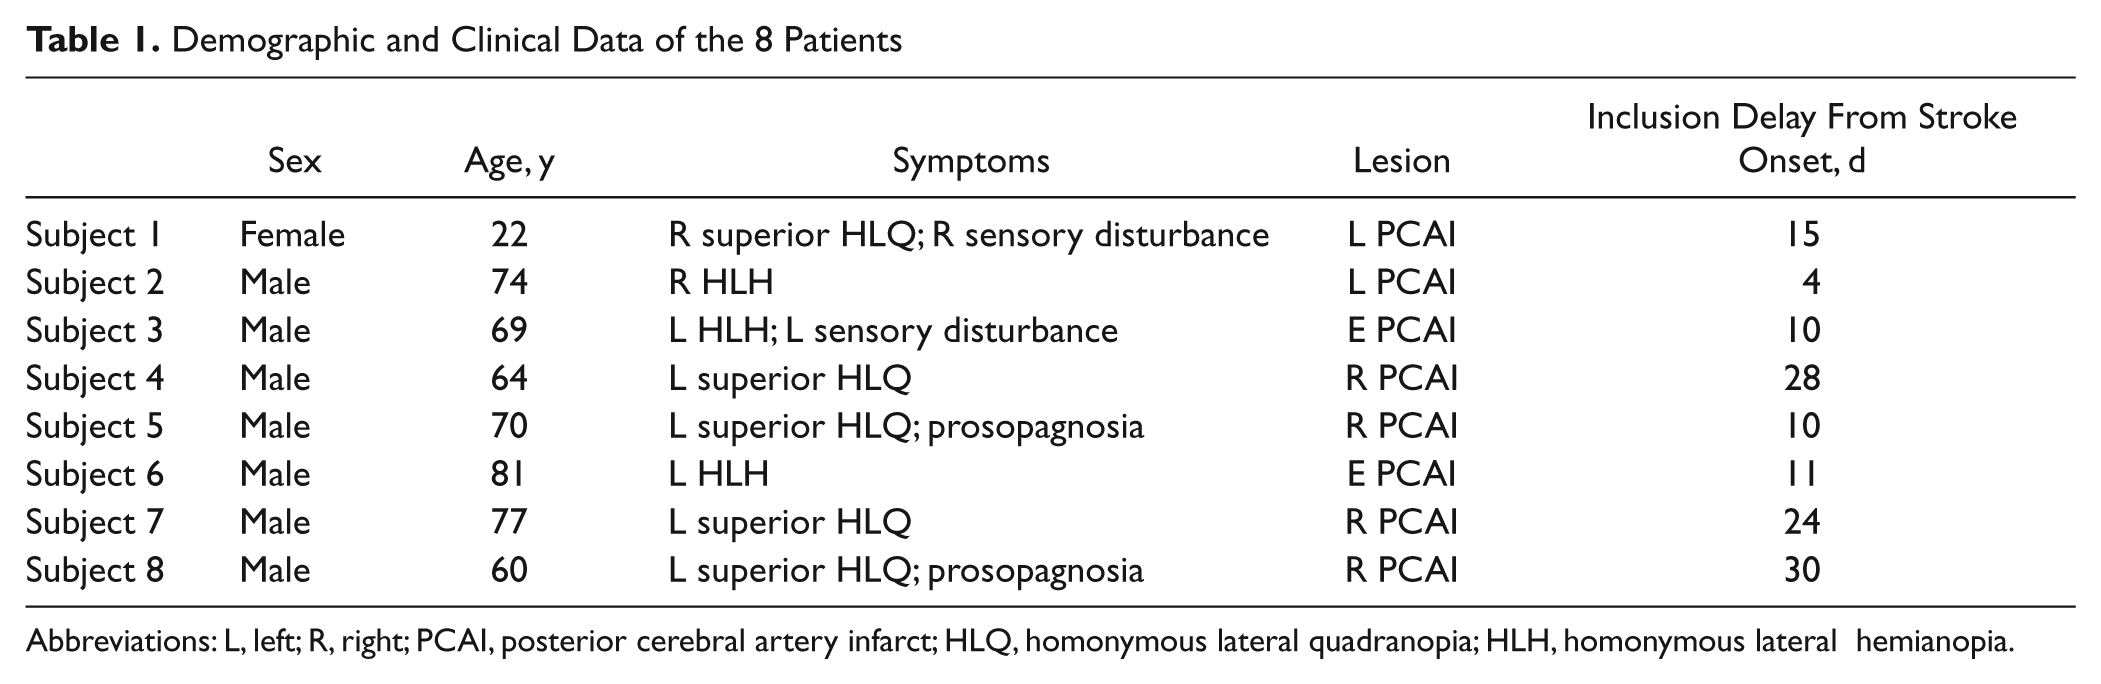
Abbreviations: L, left; R, right; PCAI, posterior cerebral artery infarct; HLQ, homonymous lateral quadranopia; HLH, homonymous lateral hemianopia.
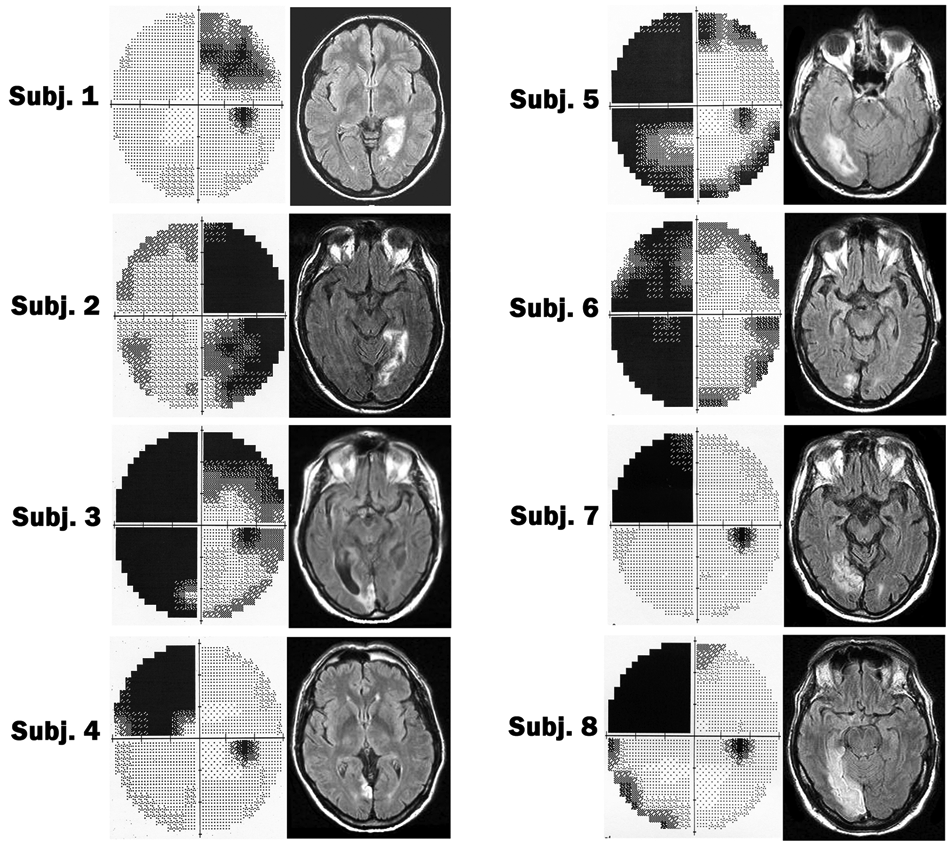
Individual visual static perimetry (Humphrey) and anatomic brain imaging (FLAIR sequence) of the 8 patients. In visual perimetry, the right visual field is represented on the right side. The black areas represent blind spots. Brain imaging is presented in radiological convention (right hemisphere on the left side).
Behavioral Testing
Individual results
Individual data are given for visual perception in the “blind” hemifield (Figure 2). In session 1, global deficiency (ie, color and motion perception) was observed for 3 of 8 patients. Four of 8 patients had color vision deficiency with relatively preserved motion vision. One of 8 patients had motion vision deficiency with relatively preserved color vision. During follow-up, visual performance increased significantly in all patients. Color and motion performance had already improved during the first month after cerebral infarct. Visual performance at the end of follow-up was not correlated with age, gender, infarct side, infarct volume, or initial visual deficit (global or selective). Improvement in color perception was associated to decreased scotoma observed in static perimetry, and improvement in motion vision was associated to decreased scotoma in dynamic perimetry.
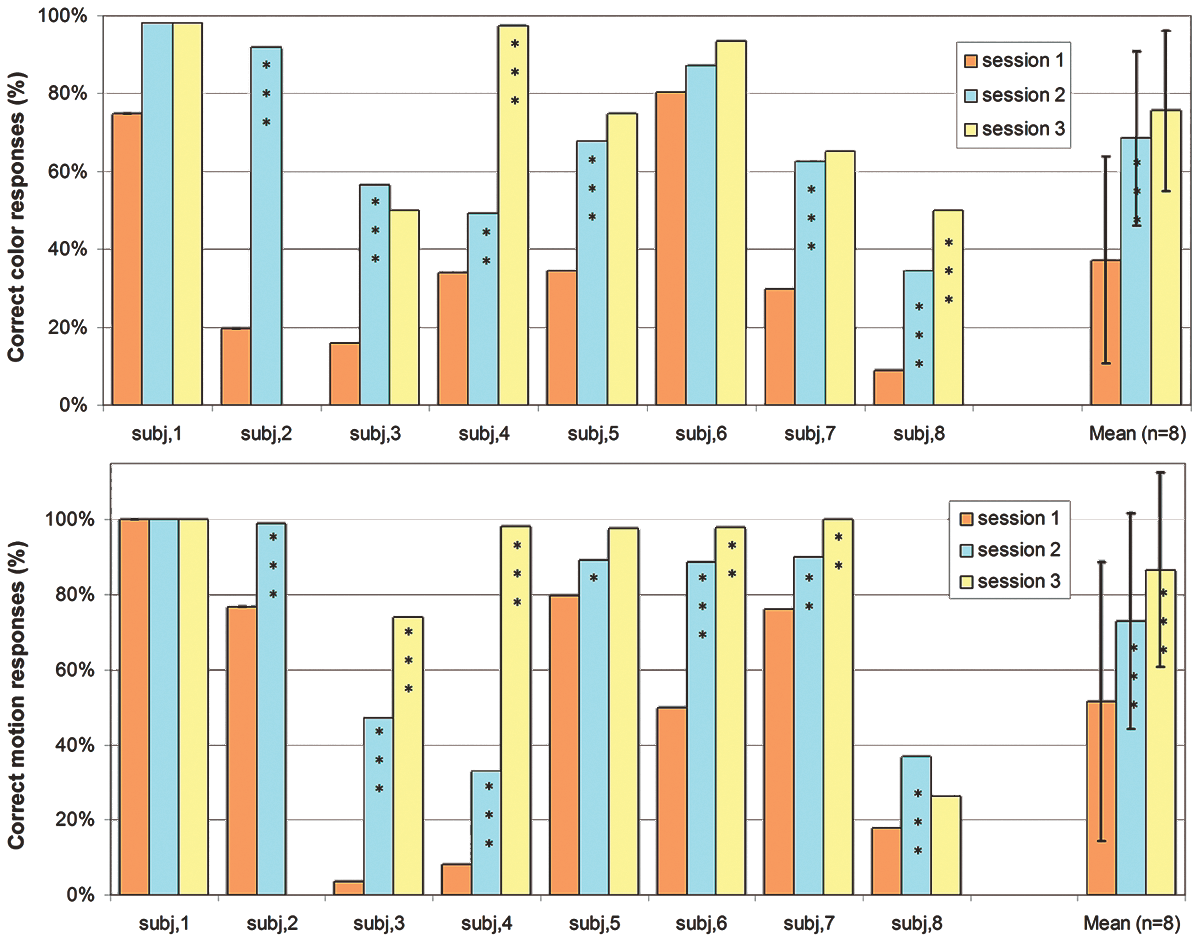
Individual and group (mean ± standard deviation) data of the 8 subjects in each session for color perception (top) and motion perception (bottom) when visual stimuli are presented in the affected hemifield. Difference with previous session: *P < .05; **P < .01; ***P < .005.
Group analysis
The ANOVA showed a significant effect of the hemifield (P < .005). In all sessions, visual performances were lower in the affected hemifield than in the unaffected hemifield both in the color experiment (session 1: 29% vs 86%, P < .005; session 2: 57% vs 92%, P < .005; session 3: 70% vs 93%, P < .005) and in the motion experiment (session 1: 47% vs 90%, P < .005; session 2: 69% vs 96%, P < .005; session 3: 84% vs 98%, P = .09). The feature effect (motion/color) was nearly significant (P = .052). In session 1, visual performances in the affected hemifield were higher in the motion condition than in the color condition (47% vs 29%, P = .01). In the next sessions there was no significant difference between motion and color conditions. The session effect was highly significant (P = .0001). Visual performances in the affected field increased significantly during follow-up and more rapidly during the first month (Figure 2), both in the color condition (session 1 vs session 2: 29% vs 57%, P < .005; session 2 vs session 3: 57% vs 70%, P = .1, ns) and in the motion condition (session 1 vs session 2: 47% vs 69%, P < .005; session 2 vs session 3: 69% vs 74%, P = .03). Thus, these results show a high visual recovery of color and motion perception, especially within the first month after stroke.
Functional MRI Visual Activation: Group Analysis
Activity elicited by color stimuli presented to unaffected hemifield (Supplementary Figure 2)
In “color versus rest” contrast, stimulation of the unaffected hemifield induced activation of the left unaffected striate cortex V1 and large activations of the bilateral extrastriate cortex (V2/V3, V4, and V5).
In “color versus control” contrast, stimuli presented in the unaffected hemifield induced activation in the left unaffected fusiform gyrus (Talairach coordinates: x = −32; y = −62; z = −10), corresponding to the V4 area. 8
Activity elicited by color stimuli presented to the affected hemifield (Table 2)
In “color versus rest” contrast (Figure 3), stimulation of the affected hemifield induced bilateral activation of the extrastriate cortex (V2/V3, V4, and V5) that increased from session to session, with the occurrence of an activation of ipsilesional V1 in the last session.
Activity Elicited by Visual Stimuli Presented to the Affected Hemifield in Each Session a
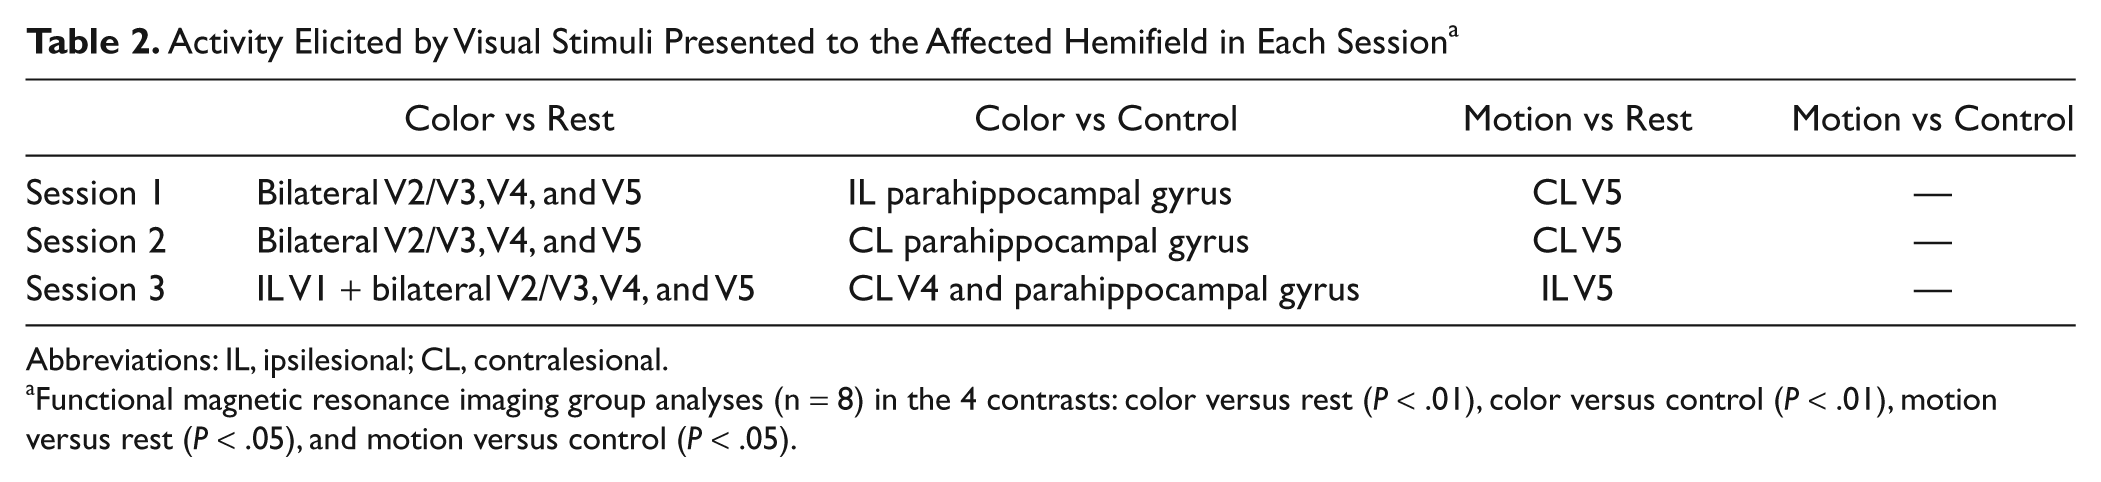
Abbreviations: IL, ipsilesional; CL, contralesional.
Functional magnetic resonance imaging group analyses (n = 8) in the 4 contrasts: color versus rest (P < .01), color versus control (P < .01), motion versus rest (P < .05), and motion versus control (P < .05).
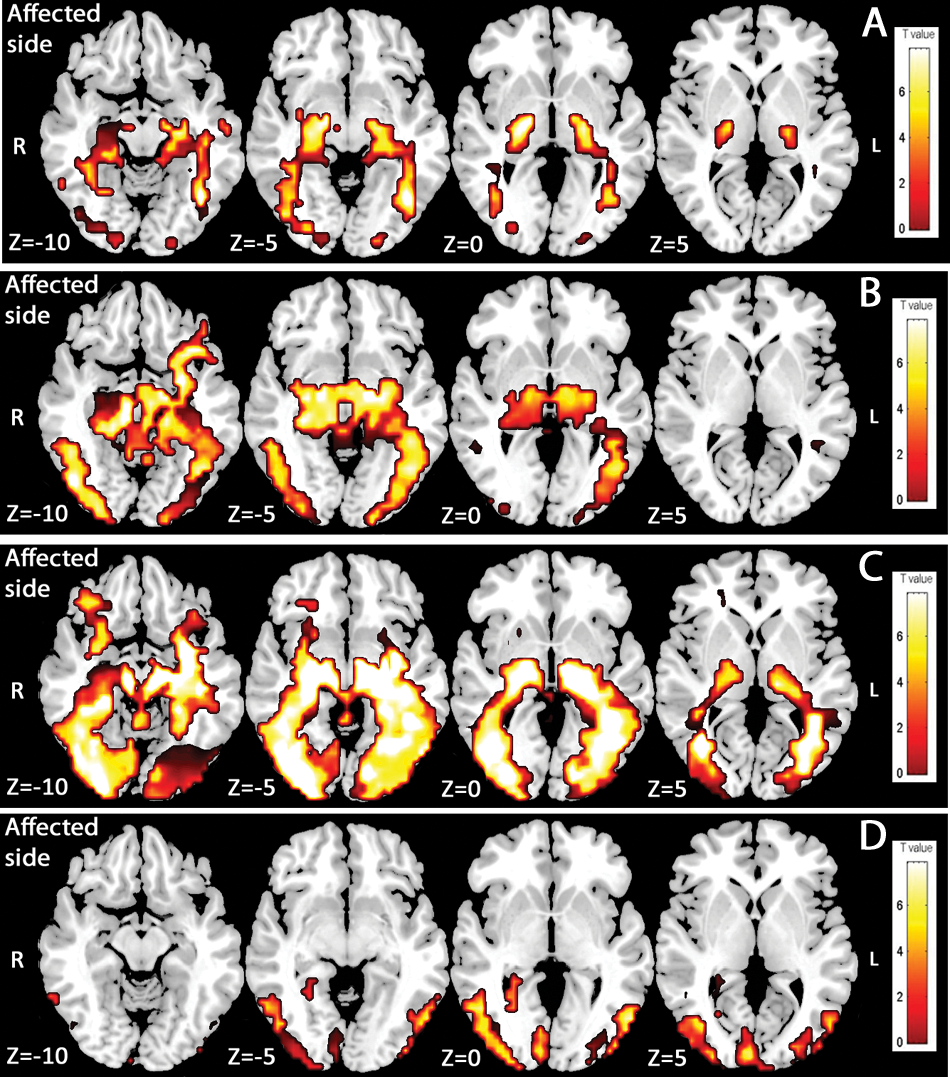
Activity elicited by color stimuli presented to the affected hemifield. Functional magnetic resonance imaging group analyses (n = 8). Color versus rest contrast (P < .01) in session 1 (A), session 2 (B), and session 3 (C). Session effect (D): Areas presenting a significant increase in activation between session 1, session 2, and session 3 when color stimuli are presented to the affected hemifield for the color versus rest contrast (P < .01, uncorrected).
In “color versus control” contrast (Figure 4), activation in the ipsilesional parahippocampal gyrus (x = 21; y = −40; z = −7) without visual cortex activation was observed in session 1. In session 2, no visual area was activated, and activation was observed in the contralesional parahippocampal gyrus (x = −18; y = −39; z = −7). Finally, in session 3, a contralesional V4 activation (x = −29; y = −64; z = −7) appeared in addition to the same activation of the contralesional parahippocampal gyrus.
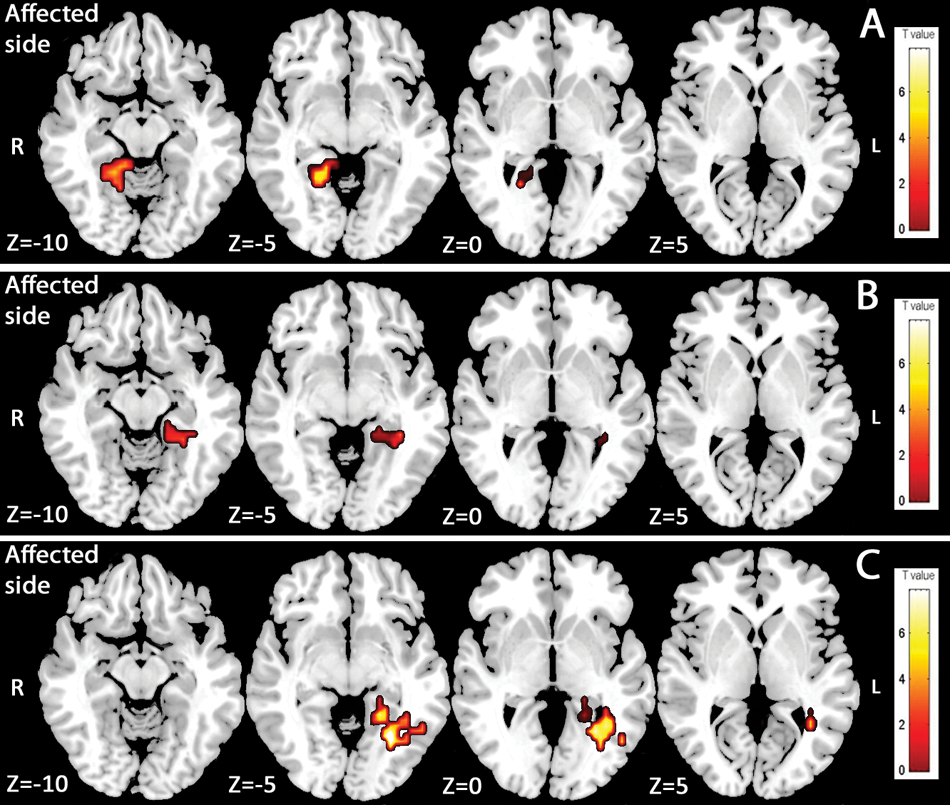
Activity elicited by color stimuli presented to the affected hemifield. Functional magnetic resonance imaging group analyses (n = 8). Color versus control contrast (P < .01) in session 1 (A), session 2 (B), and session 3 (C).
Session effect in color condition
To approach the kinetics of activations more precisely during follow-up, the session effect was assessed by ANOVA. In color versus rest contrast in the affected hemifield (Figure 3D), several areas showed a significant increase (P < .01, uncorrected) in activation among sessions: ipsilesional V1, ipsilesional V4, and bilateral V2/V3 and V5 areas. In color versus rest contrast in the unaffected hemifield, bilateral V2/V3 showed a significant increase (P < .01, uncorrected) in activation among sessions. However, no increase in activation was found either in unaffected V1 or in unaffected V4.
Activity elicited by motion stimuli presented to the unaffected hemifield (Supplementary Figure 3)
In the contrast “motion versus rest” as in “motion versus control,” visual stimuli presented to the safe hemifield-induced activations in the left (x = −63; y = −50; z = 5) and right (x = 51; y = −68; z = 3) middle temporal gyrus corresponding to area V5. 9
Activity elicited by motion stimuli presented to the affected hemifield (Table 2)
In “motion versus rest” contrast (Figure 5), activations of the contralesional V5 area (x = −51; y = −69; z = −3) were obtained in sessions 1 and 2. In session 3, no activation was obtained in the contralesional hemisphere and activation of ipsilesional V5 appeared (x =47; y = −74; z = 1).
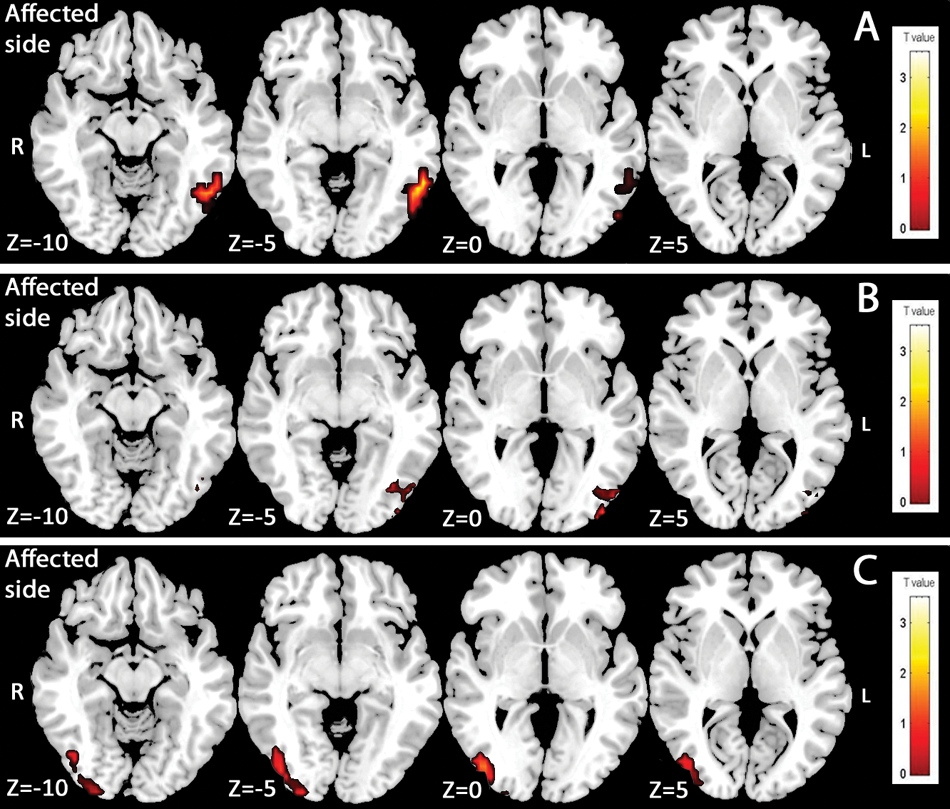
Activity elicited by motion stimuli presented to the affected hemifield. Functional magnetic resonance imaging group analyses (n = 8). Motion versus rest contrast (P < .05) in session 1 (A), session 2 (B), and session 3 (C).
In “motion versus control” contrast, no significant activation was obtained in any session. In the motion condition, no V1 activation was observed either for the affected hemifield stimulation or for the unaffected hemifield stimulation. Stimulation of the affected hemifield induced no specific activation. These poor activations obtained in motion experiments could be explained by the small size of the stimuli used in motion conditions.
Correlation between activation and visual performance
In the color experiment, statistical SPM analyses showed positive correlations between color performance and BOLD signal on session 2 (Supplemental Figure 4) in ipsilesional V4 (Pearson r = .97, P < .005) and contralesional V4 (Pearson r = .88, P = .004). The higher the activation in bilateral V4 area, the better was the performance. No significant correlation was found on session 1 and session 3. In the motion experiment, no significant correlation was found.
Discussion
The strength of this prospective longitudinal study of poststroke visual deficit is an extensive analysis of conscious color and motion perception from the acute phase to the chronic phase. Visual deficits in chronic hemianoptic patients have been widely investigated, but visual deficit in the acute phase of stroke and its outcome remain to be described. Our study aims to describe the natural history of conscious perceptive visual deficit after PCAI. In the acute phase, visual deficit was global—color and motion perception—(3/8), selective to color perception (4/8), or selective to motion perception (1/8). Thus, visual dissociations—conscious motion perception without color perception, named Riddoch syndrome, 4 or conscious color perception without motion perception 10 —described in chronic hemianoptic patients do appear in the early stages of stroke. Although poststroke visual recovery was thought to be limited, 11 our results illustrate a great potential for visual recovery. Color and motion vision recovery was complete or subcomplete in most subjects and began only 1 month after stroke.
In the acute phase of stroke, the analysis of the cortical activation profile allows several comments. First, ipsilesional V1 activation was never obtained during the first session, either in color condition or in motion condition. Second, the contralesional hemisphere may play a role in this early stage of functional recovery with nonspecific bilateral V4 activation in color experiments and nonspecific contralesional V5 activation in motion experiments. As widely described in poststroke motor or language recovery,1,2 contralesional hemisphere participation in cerebral plasticity is a phenomenon also reported in visual recovery.12,13 It has been hypothesized that these contralesional activations could rely on transcallosal pathways. Another possible explanation is a stimulation of the contralateral macula induced by small deviations from central fixation. Because we did not control fixation during functional MRI, we cannot rule out minor eye deviations from the fixation point. However, in this case, we would have obtained contralesional V1 activation, which was not the case. Finally, functional specialization of the visual cortex observed with stimulation of the unaffected hemifield was not obtained during the acute phase of stroke with stimulation of the affected hemifield. No specific activation of V4 in color conditions or V5 in motion conditions was obtained in task versus control contrasts during session 1. This early cerebral reorganization could be a target for rehabilitation approaches. Convincing evidence is still lacking that visual stimulation of the blind hemifield leads to restitution of the occipital cortex in a clinically relevant way. 14 Therefore, visual restoration therapies should be evaluated in the acute phase of stroke and not in chronic hemianoptic patients.
During the follow-up, cortical activation mapping changes were observed. In color perception, ipsilesional V1 activations appeared in session 2 and extended in session 3 in the group analysis. However, in individual analysis, only 3 of 8 patients activated ipsilesional V1 in the last session. This difference between group and individual analysis may be explained by a higher statistical power of the group analysis. This ipsilesional V1 activation is a major point in the understanding of functional visual recovery processes. Indeed, few authors have suggested that visual recovery relies on spared islands in ipsilesional V1.15,16 Nevertheless, other authors hypothesized that residual vision was supported by extrageniculostriate pathways that bypass V14,17 because no ipsilesional V1 activation was obtained. Most of these studies were based on single case analysis. Our results suggest that spared islands in ipsilesional V1 have a role in functional recovery and allow conscious visual perception and not only blindsight as previously stated. 18 Such a mechanism may be allowed because of partial damage to V1 as in each of our patients.
Visual areas specialized in color (V4/V8) and motion perception (V5) also seem to play a role in functional recovery. In color condition, the role of ipsilesional V4 is illustrated by the session effect analysis with a continuous significant BOLD signal increase observed in this area during follow-up. Our results show that this ipsilesional V4 activation was correlated with performance in color perception (Supplemental Figure 4). However, in color versus control contrast, instead of ipsilesional V4 activation, contralesional V4 activation was obtained in the last session. This could illustrate a reorganization of specific treatment of color perception with an interhemispheric balance effect. These contralesional activations described in motor or language recovery are not thought to be functional. 1 However, in session 2, our results showed positive correlation between contralesional V4 BOLD signal and performance in color perception. Implication of the contralesioned hemisphere also appeared in motion conditions. Isolated contralesional V5 activations were obtained in the first 2 sessions before ipsilesional V5 activation appeared in the last session.
Conclusion
This prospective study suggests that visual improvement occurs early after partial PCAI despite different initial visual deficits. Only 3 months after stroke, most patients had extensive recovery of color and motion perception. Our results illustrate cerebral plasticity of the visual cortex after PCAI. Spared islands in the ipsilesional V1 area and contralesional extrastriate cortex play a role in functional recovery after damage to the striate cortex.
Footnotes
The author(s) declared no potential conflicts of interest with respect to the research, authorship, and/or publication of this article.
The author(s) disclosed receipt of the following financial support for the research, authorship, and/or publication of this article:
This work was sponsored by the University Hospital of Toulouse for regulatory and ethic submission (N°0600301).