
Abstract
Background. The link between spasticity and impaired voluntary movement after stroke remains unclear because of the lack of suitable tools characterizing properties of spastic muscles. Describing this relationship early poststroke can potentially help predict the extent and time course of recovery. Objective. To describe the time course of changes in neuromuscular properties after stroke using the upper extremity Fugl-Meyer Assessment (FMA) at 1 month to predict recovery patterns over 1 year. Methods.Using a parallel cascade system identification technique, this study characterized intrinsic and reflex behaviors for different mean elbow joint angles, at specified times poststroke. Then the “growth mixture” model was used to characterize recovery patterns over 1 year. Logistic regression analyses were applied to predict these patterns. The impact of patient characteristics was also investigated. Results. In 21 stroke survivors, 14 had sustained hemorrhage and 7 had thromboses. The study observed several recovery classes, relating intrinsic and reflex stiffness magnitudes with changing elbow angle at different time points. The largest group (48%) showed progressive increase in reflex stiffness over time, but 33% showed declining reflex stiffness over the same period. A third class (19%) showed invariant reflex properties. These differences were linked to the initial reflex magnitudes. The FMA at 1 month showed an inverse relationship with key reflex patterns and proved to be a strong predictor of class membership. Stroke type was also influential. Conclusions. The logistical regression class may enable us to accurately predict reflex responses during the first year, allowing us to apportion impairment between central and peripheral mechanisms.
Introduction
The long-term goal of this study was to understand the origin of motor impairment following hemispheric stroke. To achieve this goal, we chose to quantitatively track the natural history of muscle and reflex properties and to use these data to develop predictors of change in neuromuscular properties during the early stage of stroke.
Motor impairments following stroke are quite diverse, ranging from alterations in muscle strength, to changes in motor coordination and to changes in muscle tone. Hypertonicity may affect 15% to 40% after ischemic stroke. 1 These impairments can vary greatly depending on the lesion site and stroke type, especially thromobosis versus hemorrhage. Abnormal postures or synergies are linked to abnormal activations of key muscle groups. These various impairments are caused by disturbances in descending commands and by changes in spinal neuron excitability. 2-5 Such mechanisms could include deficits caused by altered cortical commands 2 and/or by changes in peripheral neuromuscular properties. 6,7
To enable accurate estimation of prognosis, and to help us understand the etiology of such changes, we need to quantify the impact of altered cortical drive on neuromuscular properties. Understanding the contributions of these impairment mechanisms to clinical function also provides a basis for the rational development of effective therapies. 8
In this study, we used an advanced identification technique 9,10 to quantify the changes in neural and muscular properties associated with spasticity in the upper extremity of stroke survivors at different time intervals over 1-year poststroke. We then used the growth mixture models 11,12 to characterize these recovery patterns in different patients. Based on these observations, we postulate that there are distinct patterns (termed classes) of natural history for reflex and muscular mechanical properties during stroke recovery.
In addition, using the logistic regression model, 11,12 we explored the effects of Fugl-Meyer assessment (FMA) 1-month poststroke on class membership. Using this approach, we hypothesize accurate prediction of the natural history patterns of reflex and muscular stiffness for each patient based on the FMA measured at 1-month poststroke.
Finally, we investigated the relation between the subjects’ clinical characteristics recorded at 1 month on stroke recovery patterns over 1-year poststroke. In particular, we postulate that stroke type (ie, thrombotic vs hemorraghic) may be a major influential factor.
This study is a continuation of an earlier study that systematically examined reflex and muscular properties at the elbow over a 12-month period following stroke. 13
Methods
Subjects
A total of 28 hemiparetic stroke survivors were recruited within 4 weeks of the event, but only 21 (10 women and 11 men) patients (64 ± 12 years) completed the study. Subjects had left-sided (11) or right-sided (10) lesions, 14 sustained primary intracerebral hemorrhage, and 7 ischemia. Subjects were assessed prior to each experiment using the 6-point modified Ashworth scale (MAS) for spasticity 14,15 and the 66-point FMA for upper extremity motor function. 16,17 MAS and FMA scores were 1.6 ± 0.6 and 25 ± 23, respectively at 1-month poststroke. The characteristics and clinical assessments of subjects at 1-month after stroke are summarized in Table 1.
Characteristics and Initial Clinical Assessments of Stroke Subjects
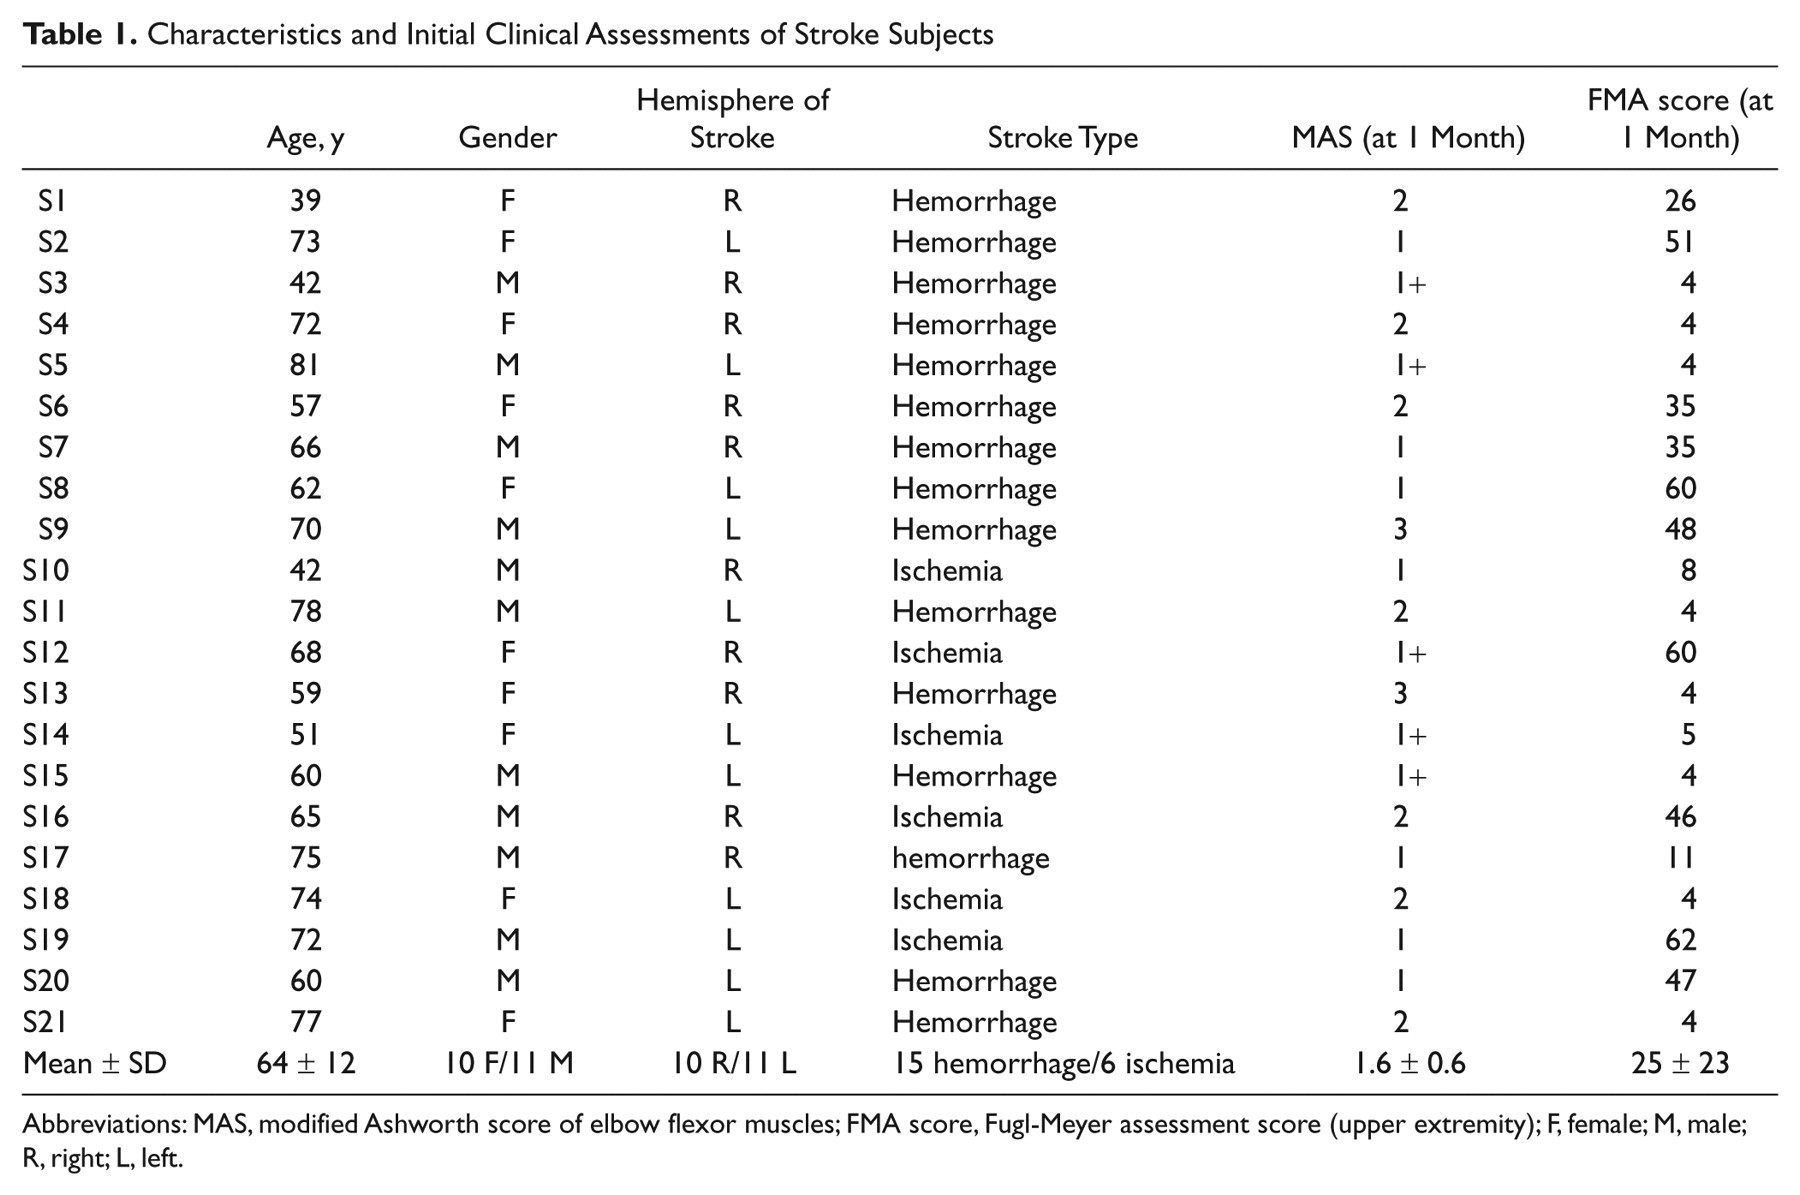
Abbreviations: MAS, modified Ashworth score of elbow flexor muscles; FMA score, Fugl-Meyer assessment score (upper extremity); F, female; M, male;R, right; L, left.
Patients met the following criteria: (a) first stroke, (b) age 30 to 80 years, (c) absence of aphasia or cognitive impairment, (d) no deficits in the nonparetic arm, (e) no major sensory deficits in the paretic arm (as evidenced by absence of detectable sensory loss on standard neurological exam), and (f) spasticity in the involved flexor elbow muscles (eg, MAS > 1 for elbow flexors). All subjects gave informed consent to the experimental procedures, which were approved by our institutional review board. Subjects were recruited from the Rehabilitation Institute of Chicago (RIC).
All subjects were drawn from the inpatient service of the RIC, and represent a convenience sample of stroke patients at the RIC.
Apparatus
The servo position-controlled motor was used to drive the elbow position to follow a command input. Subjects were strapped to an adjustable chair with the forearm attached to the beam via a custom-fitted fiberglass cast mounted on a torque cell (Figure 1). Shoulder abduction was 80° and the elbow axis of rotation was aligned with axis of the torque sensor and the motor shaft. 7 Elbow position and velocity were recorded with a potentiometer and tachometer, and torque was recorded using a torque transducer mounted between the beam and the motor shaft. An elbow angle of 90° was the neutral position (NP) and defined as zero. Electromyograms (EMGs) were recorded from the short head of biceps, brachoradialis, and triceps long and short heads, using bipolar surface electrodes. Position, velocity, torque, and EMGs were filtered at 200 Hz to prevent aliasing and sampled at 1 kHz.
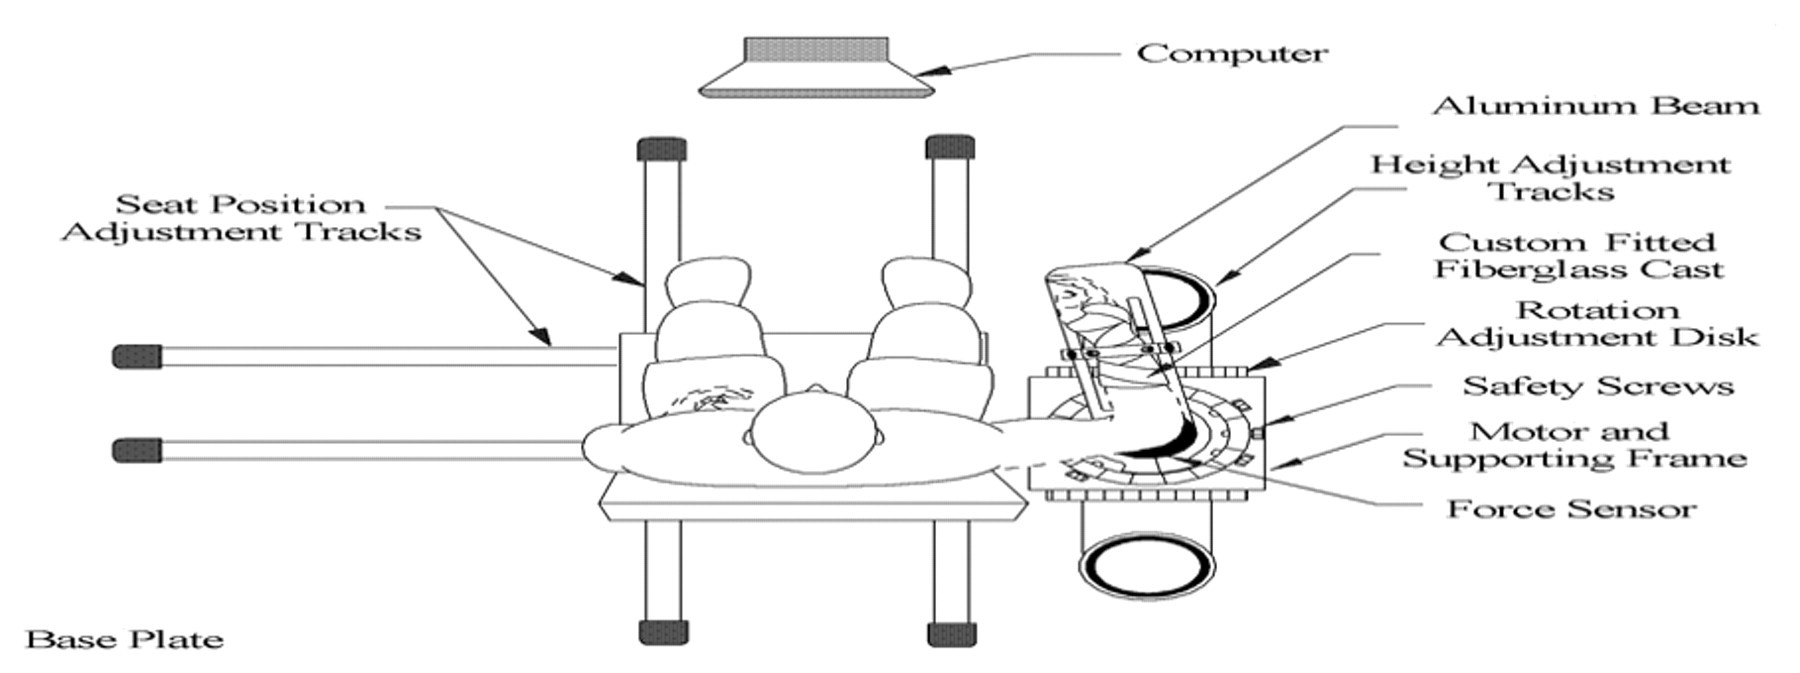
The apparatus, including the joint-stretching motor device, the height adjustable chair, and force and position sensors.
Experiment Procedure
We perturbed the paretic elbow joint using pseudorandom binary sequence (PRBS) position inputs with amplitude of 0.03 rad and switching rate of 150 ms, which contained power over enough bandwidth to identify the reflex and intrinsic dynamic stiffness. 10 PRBS trials were performed at different elbow positions from near full flexion, that is, −30°, to near full extension, that is 75°, at 15° intervals. Each position was examined with the subject relaxed; the subject’s state was checked by monitoring EMG signals during application of the PRBS. The experiment was repeated at 5 intervals following stroke onset (ie, months 1, 2, 3, 6, and 12 poststroke).
Analysis Procedures
The contributions of muscle and reflex dynamics to the elbow stiffness were identified using a parallel cascade system identification technique, including 2 pathways, namely, intrinsic and reflex as shown in Figure 2 (see details in Kearney et al 9 and Mirbagheri et al 10 ).
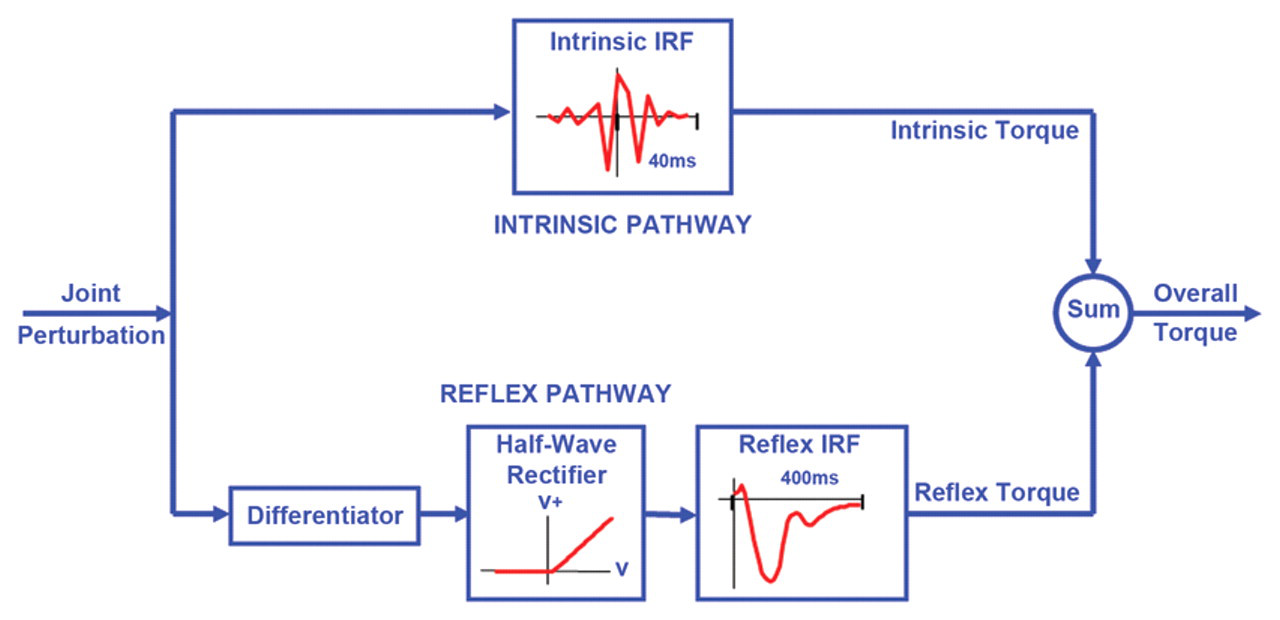
The parallel cascade structure used to identify intrinsic and reflex stiffness. Intrinsic dynamic stiffness is represented in the upper pathway by the intrinsic stiffness impulse response function. Reflex dynamic stiffness is represented by the lower pathway as a differentiator, followed by a static nonlinear element and then a linear impulse response function. The nonlinear element is a half-wave rectifier that shows the direction of stretch. V represents perturbation velocity. V+ represents half-wave rectified velocity.
In the intrinsic pathway, intrinsic stiffness dynamics were estimated in terms of a linear impulse response function (IRF), relating position, and torque over a broad range of frequencies. Intrinsic torque was predicted using the intrinsic IRF and subtracted from the recorded torque to provide the residual torque.
Reflex dynamics were estimated as a pathway comprising a delay, a differentiator, a half-wave rectifier, and linear dynamics, using a Hammerstein identification method. 18 Reflex stiffness dynamics were estimated by determining the IRF between half-waved rectified velocity as the input and the residual torque as the output. The reflex torque was predicted using the reflex IRF.
Linear models were fitted to the estimated intrinsic and reflex IRF curves using the Levenberg Marquardt nonlinear least squares fit algorithm. 19 The intrinsic and reflex stiffness gains were derived 7,10 and used to explore time dependence of mechanical abnormalities associated with spasticity.
Our parallel cascade system identification technique has been used repeatedly in many studies and shown to be both reliable and valid. 7,10,13 Our test–retest reliability correlations are also very high in normal controls. 20
Measurement errors are also known to be small, based on known precision of our instruments and systematic attention to the initial setup of the subjects in our measuring devices.
Statistical Analysis
We used the growth mixture model 11,12,21 to extract the recovery patterns (class) for each intrinsic and reflex stiffness parameter. In our earlier study, we have demonstrated the validity of this model. 22 The growth mixture model assumes that the population can be divided into several latent classes (subpopulations) and that there is a unique random effects model characterizing the associations between the longitudinal responses and a set of predictors in each subpopulation. The growth mixture modeling allows the membership of the latent classes to be associated with a group of baseline factors, via a multinomial logistic regression model. Estimation of the model parameters in the growth mixture model is based on maximizing the likelihood function via the expectation–maximization algorithm. 23
In the fitted growth mixture model, the multinomial (polytomous) logistic regression 11,12 was used to characterize the association between the membership and FMA. To predict the membership for each subject, we calculated the probability of the subject’s data lying in each of the potential subclasses, and identified the membership as the class with the highest predicted probability. This procedure helped us explore the association of FMA at 1-month poststroke with intrinsic and reflex stiffness class membership in the growth mixture model. Results with P values <.05 were considered significant.
The results were adjusted for multiple testing using the Bonferroni correction. Adjustments were done for the analyses of reflex parameters, where the Fugl-Meyer score was used to classify subjects into 3 classes.
MPlus was used to find the recovery patterns/classes from the growth mixture models and SAS 9.2 was used to compute the estimated coefficients and predicted probabilities from the logistic regression models.
Results
Time Course of Changes in Intrinsic and Reflex Stiffness
We studied the time course of changes in intrinsic stiffness gain (K) and reflex stiffness gain (G) of the paretic elbow over a range of elbow angles, at 5 different time points over the year poststroke.
Our results showed that both K and G were strongly position dependent (P < .0001; Figure 3) and that this dependence was broadly similar in all subjects. Specifically, both K and G increased progressively as the elbow was moved from full flexion to full extension. However, the slope of changes in K and G with increasing elbow angle varied between subjects between time points.
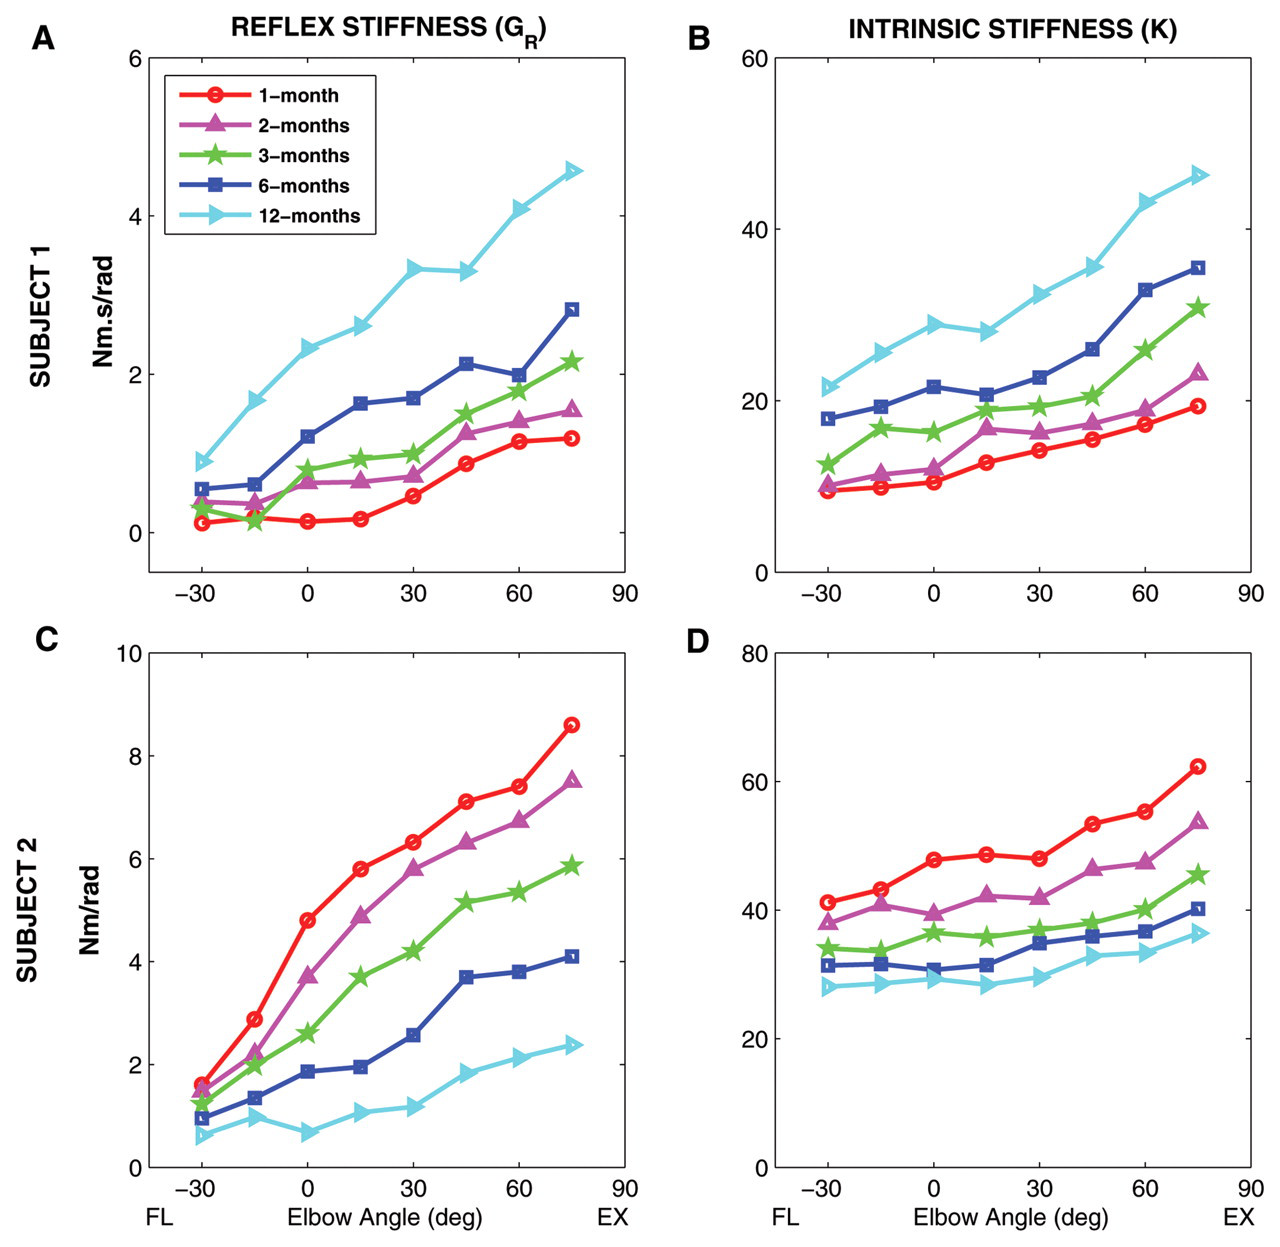
Time course of changes in intrinsic stiffness (K) and reflex stiffness (G R) as a function of elbow position over 1 year after stroke for 2 different stroke survivors (subject 1, top row; subject 2, bottom row) with different neuromuscular recovery pattern. Abbreviations: NP, neutral position (90°). FL, flexion; EX, extension.
Both K and G were also strongly time dependent (P < .007). Here, we observed 2 distinct time-dependent patterns. Figure 3 shows the modulation of K and G with changing elbow position at different time points for 2 typical stroke subjects, representing these 2 different patterns. For subject 1, G and K increased progressively with time from 1 to 12 months (Figures 3A and 3B, respectively), whereas subject 2 had decreased values of G and K with the passage of time (Figures 3C and 3D, respectively). There were also a small number of subjects for whom G and K changed in opposite directions over time.
Recovery Patterns of Intrinsic and Reflex Stiffness
To characterize the aforementioned modulation of reflex and intrinsic stiffness with elbow angle over 1 year, we fit a regression line to the changes of intrinsic and reflex stiffness versus the elbow angle at each time point for each subject. We then used the “growth mixture” model to characterize recovery of these measures over 1 year—that is, intrinsic intercept (K INT), intrinsic slope (K SLP), reflex intercept (G INT), and reflex slope (G SLP). The detailed statistical information for the growth mixture model is described in Table 2.
Information of the Growth Mixture Model and the Logistic Regression Model
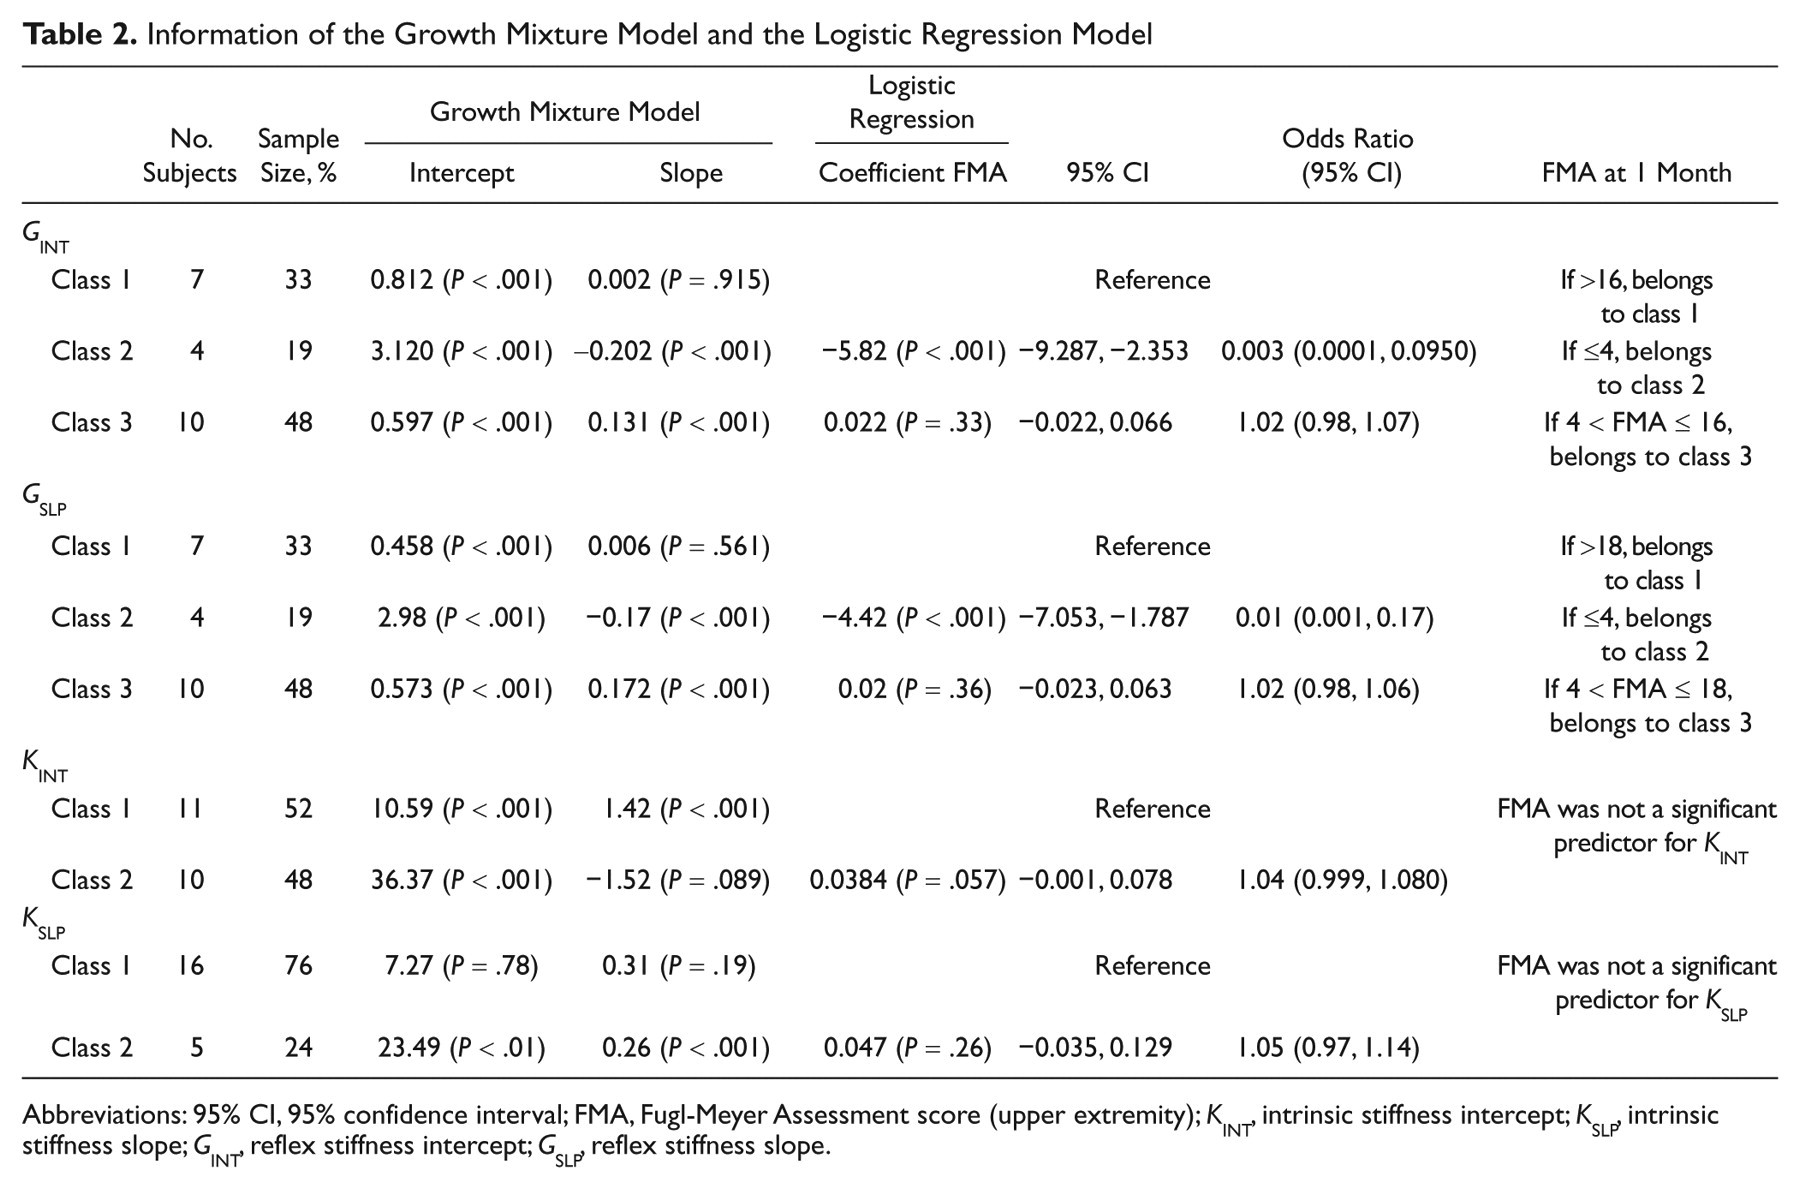
Abbreviations: 95% CI, 95% confidence interval; FMA, Fugl-Meyer Assessment score (upper extremity); K INT, intrinsic stiffness intercept; K SLP, intrinsic stiffness slope; G INT, reflex stiffness intercept; G SLP, reflex stiffness slope.
Based on data collected over this 1-year interval, we identified 3 recovery classes for G INT and G SLP. These classes are defined using the growth mixture model of the relationship between elapsed time and these reflex parameters. In particular, classification of individuals based on their most likely class membership resulted in a class sample size for class 1 of 7 subjects (33%), for class 2 of 4 subjects (19%), and for class 3 of 10 subjects (48%), for both G INT and G SLP.
Figure 4A shows the observed and estimated mean G INT for classes 1, 2, and 3 over time. For class 1, which defines the relation between elapsed time and G INT, the growth mixture model provides an intercept of 0.812 N m s/rad (P < .001), indicating a significant level of G INT was observed at 1-month poststroke. However, the slope of this (G INT–time) relation was 0.002 N m s/rad/mo, which is nonsignificant. For class 2, the intercept was 3.120 N m s/rad (P < .001), indicating a high level of G INT at 1 month. However, the slope was −0.202 N m s/rad/mo (P < .001), indicating a significant decrease in G INT occurred in 5 measurements taken over 1 year. For class 3, our estimate for the intercept and slope were 0.597 N m s/rad (P < .001) and 0.131 N m s/rad/mo (P < .001), respectively, indicating a significant increase in G INT at 1 month followed by significant growth in G INT over 1 year.
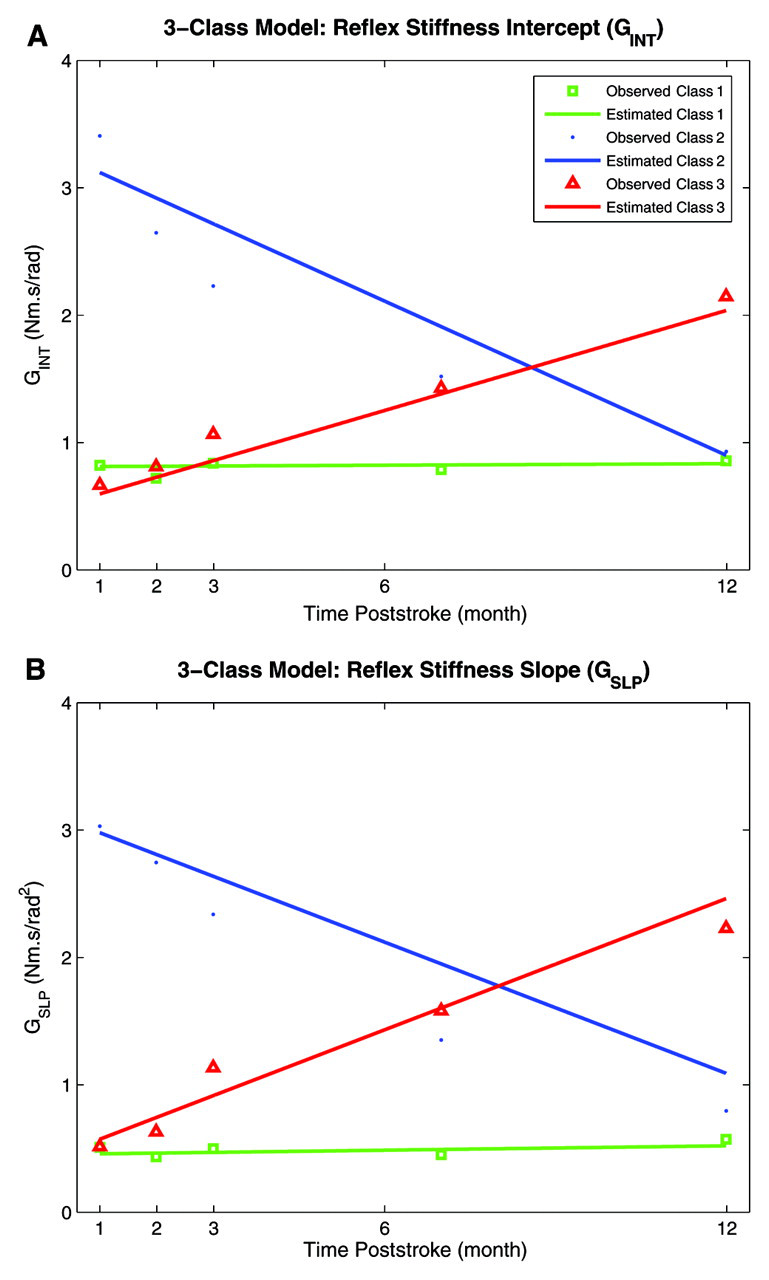
Recovery patterns of reflex intercept (G INT), and reflex slope (G SLP). A, G INT. B, G SLP. Class 1 in green, class 2 in blue, and class 3 in red.
Figure 4B shows both the observed and estimated mean G SLP for all 3 classes of recovery. Subjects in class 1 started with a low G SLP of 0.458 N m s/rad2 (P < .001) and did not change significantly over time. Subjects in class 3 started with relatively a larger G SLP (0.573 N m s/rad2, P < .001) and then increased significantly with the slope of 0.172 N m s/rad2/mo (P < .001). Finally, subjects in class 2 started with even larger G SLP, 2.98 N m s/rad2 (P < .001), but then decreased significantly with the slope of −0.17 N m s/rad2/mo (P < .001). A summary of this information is provided in the first few rows of Table 2.
Application of the growth mixture model to K INT data showed that there were 2 classes of recovery patterns (Figure 5A). Subjects were almost equally divided between 2 groups: 11 subjects (52%) to class 1 and 10 subjects (48%) to class 2. Subjects in class 1 started with a moderately low-level K INT, 10.59 N m/rad (P < .001) but increased significantly over time with the slope of 1.42 N m s/rad/mo (P < .001). In contrast, subjects in class 2 tended to start with a high-level K INT, 36.37 N m/rad (P < .001), and then decreased with the slope of −1.52 N m/rad over time but the decline was nonsignificant.
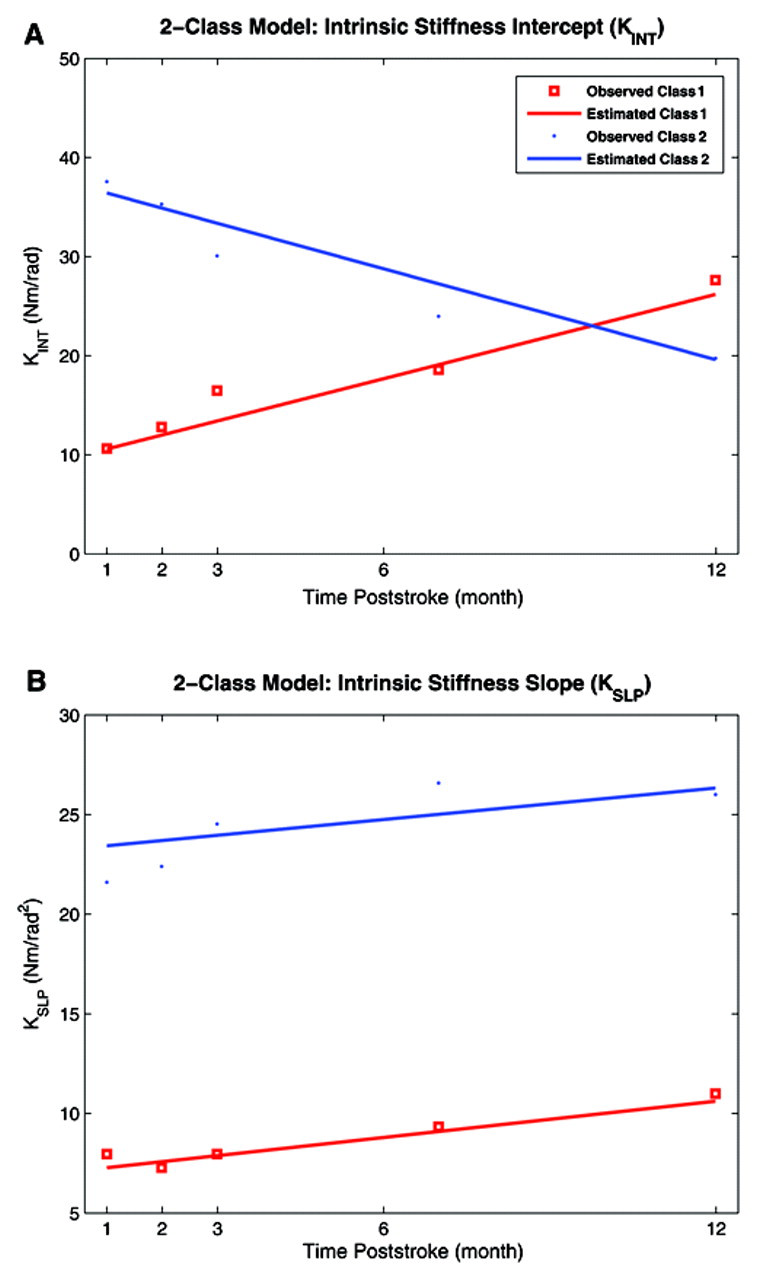
Recovery patterns of intrinsic intercept (K INT), and intrinsic slope (K SLP). A, K INT. B, K SLP. Class 1 in red and class 2 in blue.
Again, 2 classes of recovery patterns for K SLP were extracted; 16 subjects (76%) in class 1 and 5 subjects (24%) in class 2. Subjects in class 1 started with low level of K SLP, 7.27 N m/rad2 (nonsignificant), and did not change significantly over time (Figure 5B). Subjects in class 2 started with high K SLP, 23.49 N m/rad2, and then increased significantly with time with a relatively slow slope of 0.26 N m/rad2/mo (P < .001). A summary of this information is provided in the last few rows of Table 2.
Relation Between Reflex and Intrinsic Stiffness and FMA Score
The logistic regression was used to explore the effects of FMA score at 1-month poststroke on class membership, using class 1 as the reference group. The detailed statistical information for the logistic regression analysis is described in Table 2.
The classes are defined by the G SLP time history, as described above. The estimated coefficient for the FMA score was −4.42 (P < .001) and 0.022 (nonsignificant) for classes 2 and 3, respectively, indicating that the logit and thus probability for class 2 membership decreases as FMA score increases.
The logistic analysis showed that FMA at 1 month is a significant predictor for G SLP class membership. Thus, subjects with an FMA score of >18 at 1-month poststroke were more likely to belong to class 1. Subjects with FMA score of ≤4 were more likely to belong to class 2, and other subjects with FMA score between 5 and 18 were likely to belong to class 3.
Similarly, using class 1 as the reference group, the logistic analysis of G INT showed that the estimated coefficient for the FMA score was −5.82 (P < .001) and 0.02 (nonsignificant) for classes 2 and 3, respectively, indicating that probability for class 2 membership decreases as FMA score increases.
Again, based on our analysis, FMA measured at 1 month was a significant predictor for G INT class membership. Thus, subjects in class 1 had an FMA score >16, subjects in class 2 had an FMA score ≤4, and the rest of the subjects with FMA score between 5 and 16 belonged to class 3.
As summarized in Table 2, our logistic analysis also showed that the FMA score at 1 month is a weak but significant predictor for K INT class membership; the estimated coefficient was 0.0384 (P = .057) for the FMA score, using class 1 as a reference. For K SLP, the estimated coefficients for the FMA were nonsignificant, indicating that the FMA at 1 month is a poor predictor for class membership of intrinsic slope.
Relation Between Stiffness Measurements and Patient Clinical Characteristics
We further used the logistic regression analysis to explore the effects of gender, stroke side, stroke type, and degree of spasticity (evaluated by Ashworth scale at 1 month) on class membership of intrinsic and reflex intercepts and slopes, using class 1 as the reference.
For G INT, our logistic analysis showed that only stroke type has significant effects on class membership—this was the occurrence of hemorrhagic stroke. The estimated coefficients for the stroke type were 6.47 (P < .001) and 6.77 (P < .001) for hemorrhagic stroke. These stroke survivors were most likely to belong to class 2 or 3, for which G INT increased either sharply after 1-month poststroke or progressively over 1 year.
For G SLP, the only significant patient characteristic was again stroke type. The estimated coefficient for stroke type was −6.88 (P < .001) for class 2, indicating that probability for this class membership significantly decreased for hemorrhagic stroke survivors. Thus, these subjects started with low G SLP and then either remained invariant (class 1) or increased significantly (class 3) over 1 year.
For intrinsic stiffness, the only influential characteristic was gender, which had significant effects on K SLP. The estimated coefficient for gender effect was −7.83 (P < .001) for class 2, indicating that probability for this class membership significantly decreased for female subjects. Thus, in female stroke survivors, K SLP started with low values and did not change significantly with time, as manifested in class 1.
Discussion
Time Dependence of Neuromuscular Properties
To our knowledge, this is the first study to precisely characterize the time course of changes in neuromuscular properties in the paretic limb during stroke recovery. The current lack of long-term quantitative data, particularly data related to time course, is primarily because of the lack of objective techniques to characterize the mechanical properties of the neuromuscular system, a point discussed in our earlier publications. 7,10,24 To overcome this deficit, we have recently developed a parallel cascade identification model, which is capable of independently characterizing intrinsic and reflex stiffness in healthy subjects and in spastic subjects with stroke or spinal cord injury. 7,10,24 Our results reveal several major points.
First, in the subjects whose reflex stiffness increases sharply at 1 month, this stiffness change is reduced during later recovery. In contrast, in subjects with moderate increases in reflex stiffness at 1 month, the reflex stiffness increases significantly over time.
Second, both G INT and G SLP changed significantly over time, indicating that stroke affects both reflex stiffness magnitude (offset) and its modulation with the joint angle. This addresses controversy in literature regarding the nature of changes in reflex properties (threshold 25-28 or gain 6,7,24,29-31 ) poststroke, revealing changes in both with time.
Third, in contrast to other reflex and intrinsic parameters, for K SLP, there was no response pattern in which the slope decreases over time. Class 1 starts with small slope value and does not change whereas class 2 starts with high slope and increases significantly with time. This pattern is different from the typical recovery patterns previously described. These results demonstrate that, in those subjects whose intrinsic stiffness slopes change sharply at 1-month poststroke, changes occur slowly during recovery.
Finally, intrinsic stiffness variation is associated with gender. Female stroke survivors have initially low values of K SLP, which do not change significantly with time, as manifested in class 1. However, the analysis was based on a relatively small sample (28 subjects), which is a limitation of the study. A larger study population will be needed to confirm the potential clinical applications. Furthermore, we are unable to compare these findings with published reports, because there have been no studies that explicitly address analogous changes in mechanical and reflex variables with time.
Nature of Stretch Reflex Abnormalities
There is no clear understanding as to which abnormality of stretch reflex activation explains increased muscle tone. Some authors attribute it to a decrease in stretch reflex threshold, 25,27,28 whereas others believe that it is because of an increase in stretch reflex gain. 29,30,32
Reflex threshold
Stretch reflex threshold is usually defined as the minimum angular position 25,27,28 or velocity 33 at which a joint displacement regularly evokes reflex responses. The hypothesis that spastic hypertonia arises from a reduced stretch reflex threshold 25,27,28 is supported by the following evidence.
First, a clear stretch reflex threshold is readily discernable in spastic muscle, appearing as an abrupt increase in joint force or muscle EMG activity appearing in an initial quiescent muscle. Such thresholds are either not visible or evident at only greater muscle lengths in normal muscles. Second, reflex threshold angle was found to be inversely proportional to the clinical severity of hypertonia, 28 whereas reflex stiffness gain of spastic subjects was reported to be essentially normal. 25,27,28
Reflex gain
Reflex gain is usually defined as the slope of the relation between the sensory stimulus magnitude (here measured using stretch velocity, for example) and the reflex output (recorded as EMG or force). Most studies have applied transient perturbations to the joint and estimated reflex gain as the ratio of torque (or EMG) change to the amplitude of position (or velocity) change. 27,33-35 This gain estimate has usually been derived at a specific latency from the onset of perturbation, assuming a linear relation between reflex torque or EMG and stimulus properties. However, these relations are known to be highly nonlinear. 9,18,36
The hypothesis that spastic hypertonia is caused by enhanced stretch reflex gain is supported by the following evidence.
First, the gain of the short-latency EMG response, recorded under both passive and active conditions, and of the long-latency EMG under passive condition is larger in spastic than in normal subjects. This gain has been estimated using transient perturbations such as ramp or pulse displacements. 29,32,33,35
Second, reflex gain is substantially greater in spastic than in normal subjects. This finding was reported in studies that used the path length of the Nyquist diagram to estimate gain. This path length measure was derived using the torque responses to a range of sinusoidal frequencies to threshold reflex contractions. 37-40
Our findings address this controversy by demonstrating that both G INT and G SLP changed significantly in the vast majority of subjects (>80%) over time. G INT, an indirect measure of reflex threshold, increased sharply at 1 month, or gradually over 1 year, indicating that reflex threshold increases after stroke.
In a small portion of subjects (<20%) G INT increased slightly at 1 month and remained invariant (group 1). We observed similar behavior for G SLP, indicating an increase in abnormal modulation of reflex gain versus joint angle after stroke. We therefore conclude that changes in both reflex stiffness gain and threshold are responsible for abnormal behavior of stretch reflexes.
Relationship Between Neuromuscular Properties and Impaired Voluntary Movement
There are conflicting views regarding the link between spasticity and impaired voluntary movement. Some studies have demonstrated a relationship between spastic hypertonia and disturbed function. 41-43 Furthermore, reducing hypertonia by therapeutic intervention has resulted in increases in maximum voluntary force 44-47 and improved function. 8,44,46-49 Other studies reject this relationship based on clinical observations 50,51 that reducing reflex hyperexcitability does not always promote functional improvement.
We believe that these controversies arise from 3 main sources. First, there is a lack of accurate methodology for quantifying spasticity and separating reflex and intrinsic torques associated with it. Spasticity is manifested as a mechanical abnormality, but our earlier studies demonstrated no link between clinical measurements of spasticity and intrinsic and reflex mechanical abnormalities associated with spasticity. 7,13,24 Second, stretch reflex hyperexcitability may not directly induce impaired function, but rather, may promote abnormal modulation of stretch reflexes during a voluntary movement and may also cause impairments. 43 We have therefore investigated the relationship between abnormal modulation of intrinsic and reflex stiffnesss versus joint angle. Third, therapy’s direct effect on voluntary movement may be limited by atrophy and contracture, which are manifested as mechanical abnormalities.
In summary, stroke triggers numerous modifications of the neuromuscular system that profoundly influence voluntary movement. However, because of technical limitations, it is currently impractical to perturb the joints during spontaneous movement and to obtain valid data. Therefore, we are obliged to perform these measurements with subjects attached to the testing device, and then to explore the associations of neuromuscular changes, represented by K INT, K SLP, G INT, and G SLP, to FMA measures.
Our results reveal that FMA measured at 1 month is a significant predictor of the reflex recovery patterns. In fact, we found an inverse relationship between the FMA at 1 month and key reflex patterns. From a practical standpoint, the findings from subjects with high initial values of G INT and G SLP forewarn the treating clinician that high initial scores on the FMA may predict declining levels of hyperreflexia with time and that pharmacologic treatments may not be warranted long term. Conversely, subjects with midrange FMA at the initial evaluation will often develop hyper-reflexia and warrant careful tracking of their clinical status.
Finally, our results demonstrate a link between reflex abnormalities and the stroke type. Thus, in hemorrhagic survivors, G INT either increases sharply after 1 month or progressively over 1 year, whereas G SLP starts with low values and then either remains invariant or increases significantly during stroke recovery.
Footnotes
Acknowledgements
Statistical consultation was provided by Professor J. Huang, PhD, Professor Alfred W. Rademaker, PhD, and Jungwha Lee, PhD, Biostatistics Collaboration Center, Northwestern University, Feinberg School of Medicine. We wish to acknowledge Krista Settle, Montakan Thajchayapong, Marianne Buckley, and Charles Ventura, for their collaboration in data collection or analysis.
The author(s) declared no conflicts of interest with respect to the authorship and/or publication of this article.
The author(s) disclosed receipt of the following financial support for the research and/or authorship of this article: This research was supported by the National Institutes of Health (NIH-R21), the National Science Foundation (NSF), and the American Heart Association (AHA-SDG) awards to MMM.