
Abstract
The study evaluated the use of sonographic measurements as an alternative to assessments based on clinical or other imaging techniques for the diagnosis of body-fat abnormalities. The study enrolled 179 HIV-infected patients, 81 (45.3%) of them diagnosed as lipodystrophy (LD)-positive based on a clinical standard questionnaire. Association between clinical LD and sonographic measurements of face, right upper limb, subcutaneous abdomen, and visceral compartments was evaluated by multiple logistic regression. The predicted probability of the logistic model was 0.64, corresponding to a maximum sensitivity of 69.1% (58%-79%), a specificity of 94.9% (88%-98%), and to positive and negative predictive values of 92% (82%-97%) and 79% (70%-86%), respectively. Kappa measure of concordance was 65% (54%-77%). Low sensitivity poses a problem for the use of sonography to detect LD in the clinical routine as a single exam, speaking in favor of the combined use of clinical and sonographic measurements over time.
Keywords
Introduction
HIV-associated lipodystrophy syndrome (LD) includes changes in the body shape and metabolic disorders associated with either the progression of HIV infection itself or the very clinical management of HIV disease with different antiretroviral medicines.1–3 Brazil is in a unique situation respecting HIV management and care in general, and in the diagnosis and management of LD, in particular, due to its 14-year-long experience with the large-scale use of the highly active antiretroviral therapy (HAART). HAART is provided to any Brazilian citizen at no cost at the point of delivery as mandated by the federal legislation approved in 1996. As a middle-income country, with a large public health system and over 180 000 patients under HAART, Brazil has been challenged by the increasing costs of ARV medicines.4,5 In this context, the assessment of relatively simple and cheap technologies to be used in the proper management of patients under HAART constitutes a top priority.
LD is characterized by lipid and glucose metabolism alterations including hypercholesterolemia, hypertriglyceridemia, insulin resistance, and diabetes mellitus, together with altered body-fat distribution. One typical fat redistribution pattern is the loss of subcutaneous fat in the face, limbs, abdomen, and buttocks while preserving the lean tissue (lipoatrophy). Another one is the combined enlargement of visceral, dorsocervical, and breast fat depots (lipohyperthrophy). A combination of lipoatrophy and lipohyperthrophy features has been also described.6,7 LD is routinely diagnosed either by physician’s physical examination or by patient’s self-report of body change, and these strategies have been regarded as valid in the context of epidemiological studies.8–10 However, subjective perceptions of body change are not always consistent with the findings of imaging techniques, such as computed tomography (CT) and dual energy X-ray absorptiometry (DEXA), both regarded as the gold standard for diagnosing HIV-associated LD.11–13
More recently, sonography started to be used as an alternative to the reference approaches mentioned before. The putative advantages of sonography include its availability, harmlessness, noninvasiveness, low cost, and high acceptability by patients. Such characteristics may be especially relevant in resource-poor contexts, with high caseloads, since other methods may be unacceptably expensive, require specialized well-trained staff, and a good infrastructure. Its use has been expanding in different clinical settings, in the context of the permanent need to develop and fully implement practical, cheap, and objective diagnostic procedures for LD.14–18
The goal of this study was to assess the level of association between sonographic measures of body fat in the facial, abdominal, arm, and visceral compartments, and the outcome of a self-evaluation of LD status in a population of HIV-infected individuals under follow-up in a large outpatient unit in Rio de Janeiro, Brazil.
Methods
All participants assessed by the study were HIV-infected patients recruited during their periodic visit to the outpatient clinic in state-owned hospital in Rio de Janeiro city, between November 2006 and October 2009. They were eligible if they were receiving antiretroviral therapy (ART) and were aged 18 years or more.
A physician examined all participants’ body surface of interest and then asked them to fill out a questionnaire 10 blinded to his/her evaluation where they reported putative alterations in their body shape, such as loss of subcutaneous fat in the face, limbs and buttocks, and/or gain of truncal and/or abdominal fat.
The diagnosis of LD-HIV relied on the presence of at least 1 readily noticeable sign tandem with another mild sign of the altered body fat compartment as mentioned before, the agreement between physician’s and participants’ self-report evaluations concerning the body fat compartments examined, and in the absence of any signs of AIDS defining illnesses in the 30 days before their appointments. Abdominal obesity was disregarded as a sign of LD-defining case.
The documents summarizing the findings of the doctor’s and participants’ assessments were kept in a safe place by the principal investigator and cross-compared with the sonographic findings only after the completion of previous assessments.
Sonography
Sonographic measurements (SA-8000 EX device, Medison Co. Ltd) were performed by a single well-trained and experienced operator who was blind to the patients’ medical data. Two repeated assessments were taken of each body-fat compartments (BFCs; face, right upper limb, subcutaneous abdomen and visceral compartments) and the average value was entered into a standard case report form. Sonographic device calibrations had the following features: frame average = 2, edge enhanced = 0, dynamic range 105%, reject level = 2, view area = wide, tissue = normal, trapezoid = off, apex = up, frame rate = fast, and power = 80. The average elapsed time between the self-report diagnostic and sonographic assessment was 3 days.
Measurements of fat thickness were taken with a high-frequency (10 MHz) linear transducer, transversally and gently positioned on a perpendicular angle over the body surface while the patient was kept laid in the supine position without a pillow. For positioning, 3 anatomic reference points were chosen according to Martinez et al’s study description. 14 At the malar region, on the most prominent part of the zygomatic bone, facial fat thickness was measured from the inner layer of the skin to the outer fascia of the superficial facial musculature (Figure 1 ). At the upper arm region, the middle third of the right arm was placed in prone position and aligned with the body. Once the image of the humerus and biceps muscle was visualized together on the screen, the image was frozen and the subcutaneous fat thickness was measured from the inner layer of the skin to the outer fascia of the biceps (Figure 2 ). At the umbilical region, right above the umbilicus, fat thickness was measured from the inner layer of the skin to the upper surface of the rectus abdominis muscle, on the middle of the linea alba area, with patient holding breath (Figure 3 ). Visceral fat thickness was assessed at the umbilical region, with a low-frequency (3.5 MHz) transducer placed in perpendicular angle with the body surface and transversally positioned. Measurement was taken from the inner (posterior) surface of the rectus abdominis muscle to the posterior wall of the abdominal aorta artery, right above its bifurcation according to Radominski et al’s report 19 (Figure 4 ).
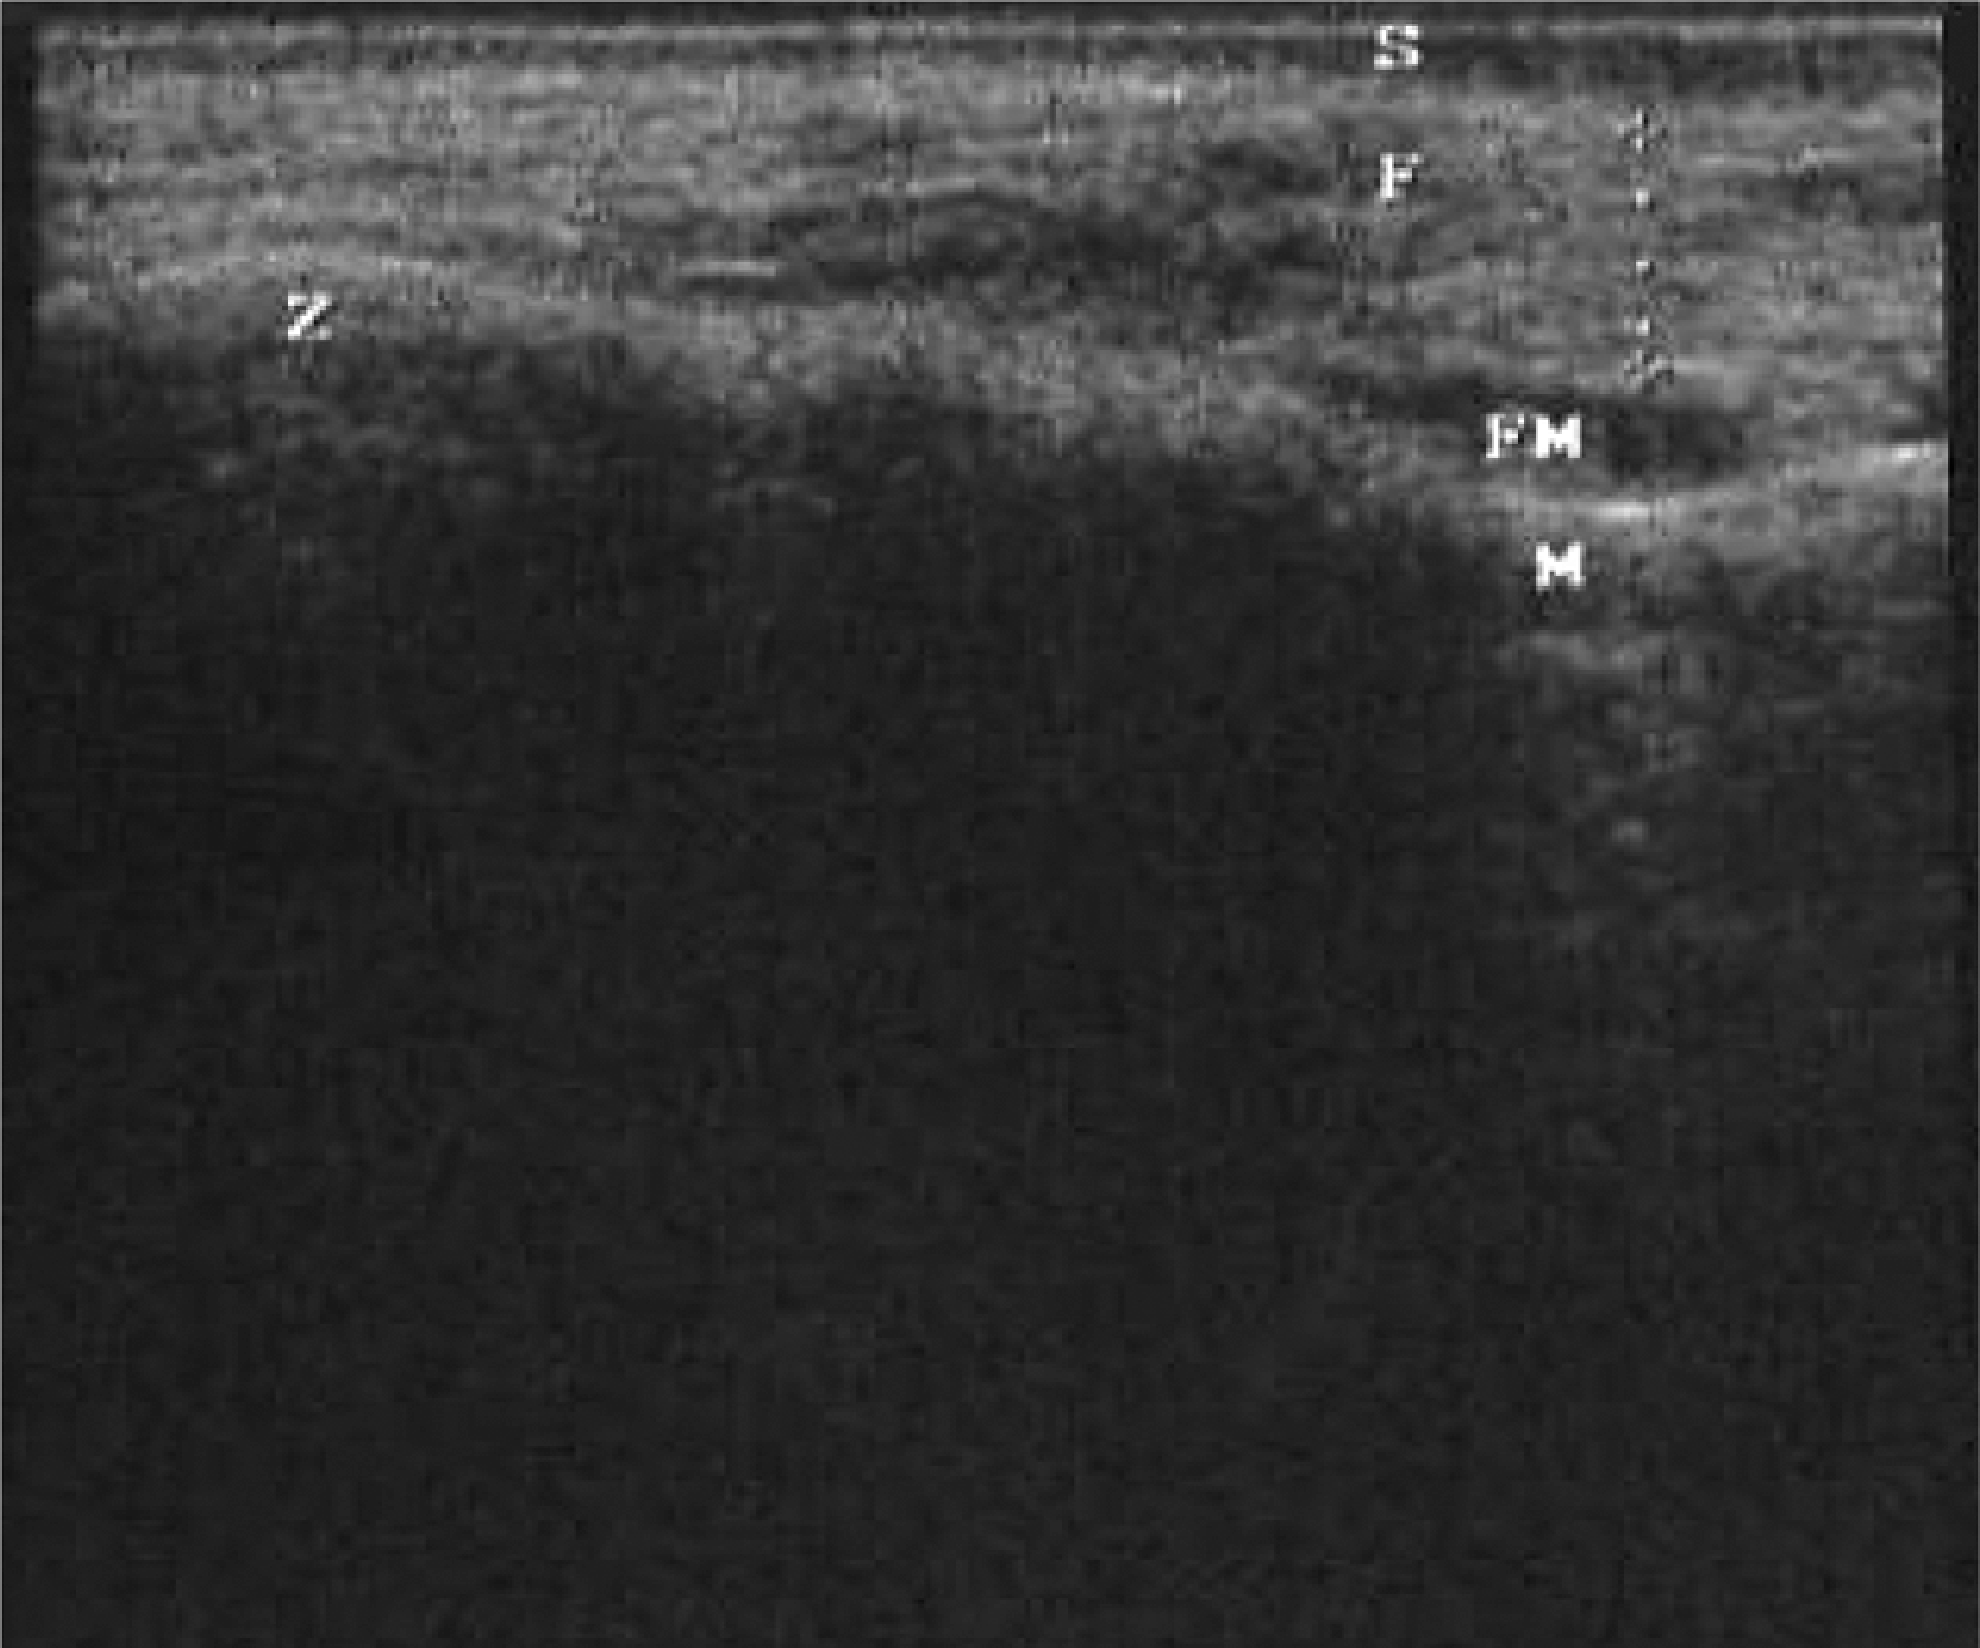
Assessment of face subcutaneous fat thickness. Transverse scan (10 MHz) of the most prominent part of the zygomatic bone, from the inner layer of the skin to the outer fascia of the facial musculature. S indicates skin; F, subcutaneous fat tissue; FM, facial muscle; M, malar bone; Z, zygomatic bone; M, maxilla.

Assessment of upper arm subcutaneous fat thickness. Transverse scan (10 MHz) of the middle third of the right arm, from the inner layer of the skin to the outer fascia of the biceps. S indicates skin; F, subcutaneous fat tissue; B, biceps muscle; H, humerus; MT, middle third of the right arm; (A), arm.

Assessment of abdominal subcutaneous fat thickness. Transverse scan (10 MHz) of the abdomen, from the inner layer of the skin to the upper surface of the rectus abdominis muscle. S indicates skin; F, subcutaneous fat tissue; LA, linea alba; R, rectus abdominis muscle; ABD, abdomen; U, above umbilicus.

Assessment of visceral adipose tissue thickness. Transverse scan (3.5 MHz) from the inner (posterior) surface of the rectus abdominis muscle to the posterior wall of the abdominal aorta artery. S indicates skin; F, subcutaneous fat tissue; R, rectus abdominis muscle; VA, visceral adiposity; AO, aorta; IVC, inferior vena cava.
All the patients gave their written consent for the assessment of their BFCs and the questionnaire, and the research protocol was approved by the Hospital’s Ethics Committee.
Statistical Analysis
Association between self-reported LD and sonographic measurements was evaluated by multiple logistic regression. The variables gender and body mass index (BMI) were also included in the model as key covariates and potential confounders. Statistical significance was determined as a P value of <.05. The best fit and more parsimonious model was used to calculate the expected probability of LD from the sonographic measurements. Receiver operating characteristic (ROC) curves were used to examine the value that best discriminated between participants with and without self-reported LD. The expected probability of LD with the greatest sensitivity on ROC curve was chosen to determine an appropriate cutoff point for LD diagnostic. The cases with higher or equal probabilities than that of the cutoff point were considered with LD; otherwise they were considered LD-negative group.
The Cohen’s kappa measured agreement between the predicted LD diagnostic based on the multiple logistic model and that formed from the self-report questionnaire.
The statistical analysis was performed with the help of the open source statistical package R, version 2.9.1. 20
Results
The study population was composed by 179 HIV-infected participants, of these, 81 (45.3%) reported symptoms of lipodystrophy, whereas 98 (54.7%) did not. The sample mean age was 42 years (range of 23-77). The mean age of the LD group (49 years) was significantly higher that the mean age of the LD negative group (37 years; t test= −8.7, df = 177, P < .0001). Most interviewees were male (72.1%), with 50 (27.9%) women, corresponding to a sex ratio of approximately 2.6:1.0 (Table 1 ).
Demographic, Clinical, and Sonographic Characteristics of Patients According to the (Self-Reported) Diagnosis of Lipodystrophy

Abbreviation: BMI, body mass index.
a With no lipodystrophy.
b Number plus/minus standard deviation.
c T test P value.
d (mm).
The mean (±SD) duration of exposure to ART for participants with and without LD was 116 ± 49 and 7 ± 4 months, respectively (T test = −26.1, df = 176, P < .0001). The body mass index (BMI) in LD-negative (25.7±3.7) and LD-positive patients (23.7±4.4) was significantly different (T test = 3.35, df = 177, P < .01). The LD group consisted of 2 subgroups: 40 patients with lipoatrophy and 41 patients with a combination of lipoatrophy and lipohyperthrophy features (no case of lipohyperthrophy alone was observed).
The fat thickness of facial, upper limb, and subcutaneous abdomen compartments were lower in participants of the LD group than in those of the LD-negative group. Conversely, the visceral adiposity of the former group was greater than of the latter group (Table 1).
The multiple logistic model included all sonographic variables, plus gender and BMI (Table 2 ). The facial (odds ratio .64 (.44-.94], P = .02), subcutaneous abdomen (odds ratio .92 (.87-.98), P = .01), visceral (odds ratio 1.2 [1.10-1.22], P = .02) body compartment measurements were all predictive of LD. The single exception among the sonographic assessments was the upper limb fat thickness (odds ratio 0.70 [0.49-1.02], P = .06), that was only marginally significant and was kept in the final model.
Multiple Logistic Regression Model on the Association between Self-Reported Lipodystrophy and Sonographic Measurements of Body Fat Compartments Combined with Body Mass Index and Gender

Abbreviations: Adj. OR, adjusted OR; BMI, body mass index; OR, odds ratio; CI95%, confidence interval.
a Sonographic variables were mm.
b Male is the reference category.
Linearity, the main assumption of logistic regression models, was assessed by visual inspection of partial residual plots. 21 Based on this approach, 3 influential points were excluded from the modeling process in order to meet the linearity assumption. The points excluded had the following values (sample distribution (median [25th-75th percentiles])): 1° case Face: 7.75 (3.27 [2.5-4.1]), 2° case: upper limb: 17.80 (1.50 [.60-2.7] and 3° case: subcutaneous abdomen: 48.55 (13.20 [6.1-20]).
Receiver operating characteristic curves showed a predicted probability of 0.64, corresponding to a cutoff point with maximum sensitivity of 69.1% (95%CI: 58%-79%) and a corresponding specificity of 94.9% (95%CI: 88%-98%) for the diagnostic of LD. Additionally, that cutoff point had respectively positive and negative predictive values in identifying cases of LD equal to 92% (95%CI: 82-97%) and 79% (95%CI: 70-86%).
The fitted multiple logistic model diagnosed LD in 61 (34%) out of 179 participants. The percentage of corrected classified cases and Kappa coefficients were 83% and 65% (CI95% 54%-77%), respectively (Table 3 ).
Agreement between Lipodystrophy (LD) Diagnoses Derived from Multiple Logistic Model and Self-Report Questionnairea

Abbreviation: LD, lipodystrophy.
a Kappa: 0.65-IC95%: (0.54–0.77).
b With no lipodystrophy.
Discussion
It is estimated that 33.4 million people live with HIV in the world, of those more than 95% live in low- to middle-income countries, where approximately 4 million people are receiving ART. 22 Despite a substantial increase in survival time and quality of life associated with combined ART, a prolonged treatment has been difficult to sustain because of problems with adherence and toxic effects.23,24
In the clinical practice, clinicians usually rely on patients’ self-report, besides their own evaluation (subjective information), for diagnosing LD due to its considerable advantages, such as low cost and high flexibility of design (questionnaire suit individual language abilities). 25 Recently, an objective case definition of lipodystrophy, which included 10 clinical, metabolic, and body composition variables, which was assessed by DEXA, was developed with 80% accuracy to diagnose lipodystrophy. However, the complexity of this method, which is based on sophisticated metabolic tests and DEXA, has restricted its use in clinical settings in most health facilities. 26 In our understanding, the sonographic technique could present an intermediate option between the high cost, less widely available high-tech methods and the low cost, widely available, and highly subjective self-report methods.
Alike other authors that have reported similar correlation between subjective perceptions and sonography in the subcutaneous and visceral body fat compartments,15,17,18,27 our study estimated a kappa statistic of substantial agreement between the findings obtained by sonographic measurements and clinical LD. Thinner facial fat compartment, upper arm, and subcutaneous abdomen fat as well as thicker visceral adiposity were associated with clinical LD, as well as sex and BMI.
With a cutoff of 0.64 in the ROC curve, the logistic model showed moderate sensitivity and high specificity. These results suggest that the adopted cutoff point was more specific than a sensitive marker of LD. Consequently, there are patients with clinical LD and negative sonographic-based test whose sonographic measurements are compatible with those from the LD-negative group. One potential explanation for the low sensitivity of sonography, in comparison to self-report, is that in the latter method, patients compare their current shape with an image of themselves retrieved from their memories. In reverse, we had just 1 sonographic measurement that could neither be compared nor discriminated concerning a loss or a gain of fat in the examined body areas, over time.
Low sensitivity poses a problem for the use of sonography to detect LD on the clinical ground as single examination, but this difficulty could be overcome if physicians included it in their clinical routine in a combination of clinical and sonographic measurements, over time, in parallel or in series, which would improve the accuracy of diagnostic tests. This approach, for instance, has been done to study the surrogate markers of immunodeficiency and metabolic alterations in HIV-infected patients. 15
Other studies, using ROC curves to compute the accuracy of the sonography assessment, found specific, separate cutoffs for each one of the body compartments involved in the definition of LD.14,16–18 These studies also support the use of sonography to assess body fat compartments in HIV-infected persons. Since they did not fit a model to compute ROC curves, we cannot compare the accuracy of these tests with our results.
One advantage of sonography, mentioned in the literature, is its low variability (less than 5%) in measuring subcutaneous fat thickness, especially if examinations are carried out by the same operator.14,15 Furthermore, sonography allows measurements in different fat compartments, such as the visceral and subcutaneous abdomen (pinched belly) fat contents, which is not feasible in subjective diagnostic methods.2,12,28.
Padilla (2007) 17 and Martinez et al (2006), 27 comparing CT and DEXA and sonography, reported statistical correlations between those methods in assessing fat lipoatrophy in the upper arm and subcutaneous abdomen. In the latter compartment, Spearman rank coefficient test correlations varied from 0.64 to 0.84, whereas in the former, these correlations were weak, but significant and ranked from .34 (P value ≤.05) to .40 (P value = .001).17,27 Likewise, concerning the visceral adiposity, the sonography was accurate on assessing visceral fat thickness when compared with CT (r = .84). 17
In the literature, results are contradictory regarding the sonographic assessment of the facial compartment; some authors found a good accuracy compared with clinical methods.14,29,30. On the other hand, study of Carey et al 31 reported no significant correlation between the malar region assessed by sonography and other body regions assessed by different assessment methods, as CT and DEXA. However, Martinez et al 27 argued against these findings, attributing their negative result to ambiguities in the study design assessed subcutaneous compartments at different sites using 2 distinct techniques, for example malar fat assessed by sonography with mid-thigh subcutaneous fat by CT, when it would be more reasonable to study the same sites with both techniques instead of studying different sites with each technique.
Moreover, other studies27,30 that argued for sonography pointed out that this method has been less used than CT or DEXA for the measurement of regional body fat in HIV-infected patients and still present problems in terms of standardization of the sonographic assessment of the facial compartment. Gulizia et al, 30 in a correspondence to the editor, proposed that technical difficulties regarding standardization might be one possible reason for the fact that Carey and collaborators 31 did not find a correlation between gold standard methods and sonography. Finally, they all concluded that sonography should not be disregarded before proving its usefulness or not on quantifying body fat compartments; on what, we completely agree.
Limitations of our work include the impossibility to detect fat changes in the body fat compartments over time.
We believe that with proper standardization, this technique will be able to help physicians to make early diagnosis of LD and take decisions over replacing antiretroviral agents associated with LD, by other ones with an improved side-effect profile.
Footnotes
The author(s) declared no conflicts of interest with respect to the authorship and/or publication of this article.
The author(s) received no financial support for the research and/or authorship of this article.