
Abstract
Discrepancies in size and shape of the jaws are the underlying etiology in many orthodontic and orthognathic surgery patients. Genetic factors combined with environmental interactions have been postulated to play a causal or contributory role in these craniofacial abnormalities. Along with the soon-to-be-available complete human and mouse genomic sequence data, mouse mutants have become a valuable tool in the functional mapping of genes involved in the development of human maxillofacial dysmorphologies. We review two powerful methods in such efforts: N-ethyl-N-nitrosourea (ENU) large-scale mutagenesis and quantitative trait linkage (QTL) analysis. The former aims at producing a plethora of novel variants of particular trait(s), and ultimately mapping the point mutations responsible for the appearance of these new traits. In contrast, the latter applies intensive breeding and mapping techniques to identify multiple loci (and, subsequently, genes) contributing to the phenotypic difference between the tested strains. A prerequisite for either approach to studying variations in the traits of interest is the application of effective mouse cephalometric phenotype analysis and rapid DNA mapping techniques. These approaches will produce a wealth of new data on critical genes that influence the size and shape of the human face.
Introduction
It has been postulated that human maxillofacial and dental morphology, both normal and abnormal, is determined by a combination of genetic factors and environmental influences. The intricate nature of the craniofacial/maxillofacial structural variations in a family has suggested that such inheritance is, in part, polygenic in origin, with polymorphisms involving multiple genes (Shum et al., 2000). Our understanding of the primary mechanisms controlling craniofacial development has expanded rapidly in recent years. However, we still do not know how many and which primary and modifier genes determine normal maxillofacial pattern formation. One of the major sources of information on craniofacial genetics is the association of maxillofacial dysmorphogenesis with various human genetic diseases and disorders (Wilkie and Morriss-Kay, 2001). The rate of discovery of genes linked to such diseases and disorders is accelerating, resulting in expanding databases, e.g., Online Mendelian Inheritance in Man (OMIM). However, the identities of genes linked to phenotypes of more prevalent and milder anomalies, such as maxillofacial size and shape discrepancies, remain elusive.
Decoding the complete DNA sequences of humans will be accomplished in the near future; attributing functions to these genes is the emerging challenge. Various computational methods are being used to elucidate functions of these genes and regulatory elements; however, investigators commonly discover gene sequences about which little functional information can be inferred algorithmically. Comparative sequence analysis reveals conserved elements in different species, and information about function in one species provides clues to functions for homologous genes in other species. Therefore, studies inquiring about gene function may be effectively addressed in the well-characterized comparative animal model. For example, the evidence that HOX genes participate in craniofacial pattern formation is largely provided from animal models (Whiting, 1997).
Historical perspectives suggest that mice first became popular as pets; however, it is because of their genetic variation that these mammals have become an important model organism in biomedical research. While naturally occurring mutations in mice have increased the genetic variation and have led to investigation in several biological processes, it became clear early on that the mouse as a tool could be exploited if the mutation rate could be accelerated (Ignelzi et al., 1995; Slavkin, 1995). Radiation as a physical method to induce mutations in mice was explored at places like the MRC Radiobiology Unit in Harwell (Oxford, UK) and the Oak Ridge National Laboratory (Tennessee, USA). A whole range of important radiation-induced mutants and chromosomal re-arrangements was generated. Radiation-induced mutations often yielded large lesions in the DNA and made mapping difficult. Alternative approaches include the use of chemical mutagens that affect the mouse germline, such as N-ethyl-N-nitrosourea (ENU). In addition, there is an array of new methods, beyond the physical and chemical, which induce mouse mutants, such as gene trap mutagenesis, engineered gene inversions and deletions by use of the cre-lox system, and retroviral insertional mutagenesis. These mouse mutagenesis approaches show increasing promise in the investigation of craniofacial and dental dysmorphogenesis (reviewed in Elanko et al., 2001). Each mutagenesis method carries similar critical limitations. Many genetic mutations result in early embryonic lethal phenotypes, thus precluding direct analysis of the functions of these genes during craniofacial morphogenesis and cytodifferentiation, as is particularly evident when attempts are made to create null mutations in specific loci. Quantitative trait linkage (QTL) analysis is another distinct approach, which applies intensive breeding and mapping techniques to identify multiple loci (and, subsequently, genes) in existing inbred strains differing in characteristic phenotypes. QTL analysis may discover the single nucleotide polymorphisms (SNPs), between different mouse species, which critically affect the craniofacial/maxillofacial structures.
Mouse genes linked to craniofacial or dental defects most often have homologues in humans, and mutations of human homologues often also result in craniofacial or dental defects, although the phenotypic details may vary. These experimental models are especially informative because the genetic backgrounds of laboratory mouse strains are relatively homogenous, and the phenotypic outcomes are likely to be reproducible. Furthermore, studies of the same mutation in different species or strains can effectively demonstrate interactions of various alleles and loci (Satokata and Maas, 1994; Vastardis et al., 1996; Maas and Bei, 1997).
In this review, using the mouse model, we will discuss, and assist the reader’s understanding of, the complete set of genetic factors influencing the size and shape of the human face in health and disease. We selected two approaches: ENU mutagenesis and QTL analysis.
(I) N-ethyl-N-nitrosourea (ENU) Mutagenesis
Progress in elucidating the functions of individual genes in humans has been made through studies of model organisms such as the fruitfly Drosophila, the nematodo worm Caenorhabditis elegans, and the zebrafish Danio rerio mutants. Because it is possible to generate large numbers of progeny for each of these organisms, one can use chemical mutagenesis to produce thousands of mutants with specific phenotypes of interest. An important attribute of this approach is that it is possible to obtain mutations of various degrees of severity in individuals, ranging from complex to partial loss of function. Therefore, the ability of the chemical mutagenesis approach to generate alleles with partial function can uncover functions for genes in craniofacial development that would lead to early embryonic lethality when introduced.
C. elegans is the first animal whose complete genomic sequence was determined. Computational analysis of genomic data revealed that many positionally cloned human disease genes have C. elegans orthologs (genes encoding proteins with similar multidomain architecture and predicted function) (Mushegian et al., 1997, 1998). Ethylmethane sulfonate (EMS) mutagenesis in C. elegans led to the identification of deletions in hundreds of target genes (Jansen et al., 1999; Liu et al., 1999). Recently, ENU mutagenesis applied to zebrafish facilitated the isolation of mutant strains carrying different mutations in specific target-genes such as rag1 (Wienholds et al., 2002). These and other studies clearly indicate that the random mutagenesis approach has been enormously useful in functional genome analysis. The interest in zebrafish as a model for craniofacial studies has grown (Yelick and Schilling, 2002). With their high fecundity, externally fertilized eggs, and transparent embryos that can be easily manipulated, zebrafish may play a unique role, particularly for the molecular genetic lineage studies defining the cellular sources of the cranial skeleton and the morphogenetic behaviors of these cells in skeletal condensations. This review focuses on the mouse model for large-scale chemical mutagenesis that has a discrete advantage in producing offspring carrying discrepancies and deformities of size and shape of the maxillofacial complex that mimic human disorders.
(1) ENU-induced mutations
ENU, a potent chemical mutagen, acts directly through random alkylation of nucleic acids. The presence of these spurious ethyl groups alone does not constitute a mutation, but it can cause inaccurate DNA replication, resulting in single-base substitutions; ENU predominantly induces point mutations. In the mouse testis, the action of ENU is most potent in spermatogonial stem cells, and its optimal dose produces about one mutation with phenotypic effects per gene per 700–1000 gametes (Hitotsumachi et al., 1985). The most commonly reported mutations in the mouse germline are AT to TA and AT to GC, which together comprise 82% of the total lesions sequenced. Among 61 ENU-induced alleles reviewed, 39 were missense mutations, 6 nonsense mutations, and 16 splice-site mutations (Noveroske et al., 2000). These mutations often resulted in loss of function, and allowed for the identification of single amino acids critical for protein structure and function. In addition to complete and partial loss of function, ENU-induced mutations can yield gene products with opposing/dominant-negative function as well as exaggerated function.
ENU produces the highest mutation rate of any germline mutagen tested in the mouse (Justice et al., 2000; Noveroske et al., 2000; Weber et al., 2000). Its ability to produce single-base-pair mutations in vivo allows for a detailed analysis of a gene’s normal functions and the physiological consequences when mutated, making it ideal for modeling human diseases. Effective ENU doses and specific mutagenesis protocols have been optimized for various strains of mice to affect single gene mutations in the progeny of males exposed to the chemical.
(2) Large-scale screening of ENU mutants
Although ENU mutagenesis affects genes at random, systematic application in large-scale programs combined with screening for specific phenotypes allows for the isolation of mutants or variants affecting specific processes (Trans-NIH Mouse Genomics and Genetics Resources Coordinating Group, http://www.nih.gov/science/models/mouse/). In fact, large-scale ENU mutagenesis can be used to the point of approaching “saturation” of a particular phenotype, i.e., isolating all possible viable mutants and variants on the specific genetic background utilized (Justice et al., 1999; Justice, 2000; Nadeau and Frankel, 2000). Moreover, large-scale ENU mutagenesis, combined with an effective breeding program, can be used for the identification of dominant as well as recessive traits (Herron et al., 2002). The ability of ENU to produce a range of different protein products and phenotypic effects has made it useful for the creation of a series of mutant alleles at single loci to uncover multiple gene functions. For example, multiple mutant alleles of the MyoVA (dilute) locus in the mouse have been generated, and these affect skin and nerve cell functions, with various degrees of severity (Huang et al., 1998a,b).
A major advantage of the large-scale ENU mutagenesis method is that each locus is randomly mutated, creating a variety of amino acid substitutions in the encoded proteins and non-coding regulatory regions. Therefore, unlike targeted mutagenesis, the ENU mutagenesis approach does not require any previous information about specific gene function. At least some ENU-induced mutations are expected to result in non-lethal phenotypes and altered protein function instead of complete abrogation, thus increasing investigators’ opportunity to identify mutants that are informative for that locus. This approach is also more likely to produce variants that mimic phenotypes commonly seen in humans in the clinical setting.
The isolation of a circadian rhythm mutant by the ENU screening method, and the cloning of the key gene (King and Takahashi, 2000), were pivotal in demonstrating the unique advantages of this technique. Since then, the ENU mutagenesis approach has also been utilized for the identification of gene mutations for abnormal phenotypes related to oncogenesis (Schindewolf et al., 2000) and malformation of eyes (Baird et al., 2002; Thaung et al., 2002), among other processes.
(3) Polygenetic determinants identified by a saturation mutagenesis strategy
Despite more than 100 years of research in mouse genetics, only a few thousand genes have functions attributed to them. Analyses of spontaneous as well as engineered mutants have contributed profoundly to our understanding of development, disease etiology, and pathogenesis. Positional cloning of mutated genes remained the most time-consuming and expensive aspect of mutagenesis experiments until very recently. The genetic map of the mouse had modest resolution, and no physical map of the genome was available (Brown and Balling, 2001). However, the higher resolution of the mouse genetic map and the development of tools that allow for the rapid assessment of mutations to precise chromosomal locations make the ENU strategy accessible to a broad scientific community. The emerging challenge now is to attribute functions to all genes in the genome. Recent progress in mouse genetics and genomics shows that large-scale studies produce comprehensive collections of mouse mutations to attribute functions and allow for the identification of effecter genes in a systematic, efficient, and high-throughput manner.
(4) A potential use of ENU mutagenesis for craniofacial/maxillofacial abnormality study
It has been postulated that any maxillofacial abnormality can be independently caused by an alteration of a few primary genes and further modulated by modifier genes. For example, the abnormal phenotype with a disproportionately large mandible (Angle’s malocclusion Class III) may be caused by mutated genes that produce a large mandible, a small maxilla, or a combination of both. Therefore, it is likely that more than several discrete models for Class III phenotypes can be isolated from the screening of ENU mutants. One of the advantages of the large-scale ENU mutagenesis program is that a trait such as Class III is expected to be mutated to an estimated 95% saturation, leading to the development of a comprehensive, if not complete, collection of mutants and variants representing relevant genetic loci. In ENU mutagenesis strategies, different inbred strains are used to guard against strain backgrounds resistant to trait modification with induced mutations. The surveys will emphasize tests for 95% of the genes affecting particular traits, saturation mutagenesis.
In an active ENU mutagenesis program, approximately 100 mice per week can be screened for mutations with dominant effects (5000 mice per year), and 250 families per year (12 mice per family, or 3000 mice per year) for mutations with recessive effects. For screening of recessive traits, the chance of missing a recessive homozygote in 12 mice tested per family is < 0.001, assuming 100% penetrance. At mutation rates of 0.002 and 0.0002 per gene per gamete for mutations with recessive and dominant effects, respectively, these sample sizes correspond to a full genome survey for mutations with dominant effects and a scan of 50% of the genome for mutations with recessive effects, per year.
Several variants and mutants with specific phenotypes may be collected to ensure that all relevant genetic loci are represented in the resulting archive. A single phenotype may be represented multiple times in the archive, in association with multiple genes, as previously seen in the case of craniosynostosis, which has been associated with several genes—Twist, FGFR1, FGFR2, FGFR2, FGFR3, and Msx2 (Muller et al., 1997; Wilkie, 1997; Elanko et al., 2001). Similarly, one gene may be mutated in association with multiple phenotypes, as seen in the case of mutations in the FGFR2 gene, where resulting phenotypes include Crouzon’s disease, Apert’s syndrome, Pfeiffer’s syndrome, Jackson-Weiss syndrome, and Beare-Stevenson syndrome (FGFR2, OMIM 176943) (Shum et al., 2000). These apparent redundancies can be better indexed following initial chromosomal assignment and rough mapping of the mutants. Effective indexing of such mutants has been demonstrated in ENU mutagenesis-based studies of heritable cataracts of the lens (Favor and Neuhauser-Klaus, 2000). This approach has eventually led to the identification of a relatively small number of genetic loci (~ 20) and has already allowed relevant genes to be identified in mice and humans.
The effective use of the ENU mutagenesis strategy may complete the entire list of genes primarily and secondarily influencing the size and shape of the jaw. It is not yet clear how many primary genes are involved in maxillofacial discrepancies, and how many mutants and variants will need to be included in our collection to provide comprehensive coverage (saturation). Although the collection may include multiple repetitions of some phenotypes and some genotypes, there is no simple way to eliminate this apparent redundancy prior to genotyping without risking elimination of specimens representing unique genotypes, because the same phenotype may result from several different genotypes. Similarly, this collection may include redundancy in the form of distinct mutations in a single gene, which result in distinct phenotypes for specific alleles, as experienced in a saturation mutagenesis program for genes causing cataracts of the lens in the mouse (Favor and Neuhauser-Klaus, 2000).
(II) Quantitative Trait Loci (QTL) Analysis
A method for mapping Mendelian factors underlying quantitative traits in mammalian models has been established with the use of genetics interval mapping based on DNA markers. This method can be used to localize quantitative trait loci (QTLs) contributing to various phenotypic differences among mouse strains in natural and experimental populations (Lander and Botstein, 1989). The QTL analysis involves, in general, two or more strains or populations with distinct phenotypes. These are crossed to generate the F1 generation. All F1 individuals are hybrids of the two parental strains and are genetically identical. These F1 mice are then intercrossed to generate the F2 generation. Due to independent assortment and crossovers, F2 individuals will have distinct genetic constitutions. The inheritance of one or the other parental phenotypes is then correlated with the inheritance of specific loci from each parent for the identification of QTLs that underlie the phenotypic differences between the parental strains. Combining genomes of different inbred strains of mice can result in traits that are dominant, recessive, or additive.
The F2 population of these parent mice undergoes stringent phenotype evaluation. QTL analysis works most efficiently for the phenotypes with a dominant and fully penetrant Mendelian inheritance pattern. The molecular genetic markers that distinguish chromosomal regions in the parental mice are mapped in the F2 population. The phenotype and genetic data for the F2 generation are concomitantly analyzed for linkage of the genetic markers to the phenotype. Association of a particular phenotypic difference with inheritance of specific genetic markers from a single parent indicates that a QTL contributed to the phenotype. Genotyping of complex traits is still a daunting task. However, the technique has been used successfully for several traits. For example, genetic loci potentially associated with the regulation of bone density have been identified by means of the QTL strategy (RF Klein et al., 1998; Beamer et al., 1999, 2001; Shimizu et al., 1999, 2001; Benes et al., 2000; Rosen et al., 2000; Drake et al., 2001; OF Klein et al., 2001; Orwoll et al., 2001; Bouxsein et al., 2002; Gu et al., 2002; Li et al., 2002).
(1) Methods of fine chromosomal mapping
The increasing availability of microsatellites that can be used as genetic markers to distinguish parental strains makes QTL mapping extremely efficient (Keightley et al., 1996; Grisel et al., 1997; Ferraro et al., 1998; Vadasz et al., 1998). High-throughput genetic analysis methods can now be based on automated, computerized electrophoresis systems utilizing a set of standardized polymerase chain-reaction (PCR) primers with colored fluorescent labels. The resulting PCR products are normally from 80 to 400 bp, and size differences between alleles are discerned by means of a high-resolution electrophoresis system. Depending on the number of microsatellite markers screened, QTLs can be easily mapped to about 10 cM from a marker locus. This approach should provide a regional localization that may reveal candidate genes for immediate evaluation and that can be the basis for positional cloning.
For finer-resolution mapping, the same DNA samples used in regional localization can be typed again, this time with a set of 10–120 microsatellites or other markers spanning the previously identified ~ 20-cM region. This secondary step commonly results in localization of the QTLs to a region of 1 cM or less. Once the QTL is localized to one of these intervals, one can use standard positional cloning methods, which include typing additional markers to localize the candidate gene in the QTL as precisely as possible in the genetic map. The goal is to map the candidate gene to a 0.2-cM (400-kb) interval. Candidate genes can be evaluated in the mouse genomic database, or the genomic interval can be completely sequenced.
QTL mapping allows for the initial production of a linkage of the specific trait to a specific chromosomal region with the use of a modest number of mice. For example, the genes and loci that are related to lipid metabolism and atherosclerosis in mice have been identified by QTL analysis (Hyman et al., 1994; Welch et al., 1996; Lembertas et al., 1997; Gu et al., 1998; Ivandic et al., 2001). These studies identify four loci on chromosomes 6, 7, 12, and 15 that contribute to obesity in the mouse.
(2) QTL fine mapping with the use of congenic mouse lines, recombinant inbred mouse lines,
in silico
SNP haplotype analysis, and DNA microarray technology
QTL mapping by microsatellite markers is currently the most powerful method for deciphering the genotypes of specific mouse mutants or variants. For many mapped QTLs, candidate genes with relevant function lie within the mapped region. The desired outcome of this strategy should be identification of the gene(s) underlying the phenotype. However, mapping algorithms often localize a QTL to a fairly large chromosomal region, and the subsequent processes involving confirmation of the effect and localizing the target gene(s) in the QTLs have been time-consuming. Several laboratories are attempting to establish even faster genotyping methods.
Increasingly, congenic mouse lines are being used in confirmation and fine mapping of QTLs. The congenic mouse line contains a small chromosomal region from the donor strain which is “introgressed” into the background recipient strain’s chromosome. The typical congenic mouse lines are made on the basis of phenotype selection for single locus traits. With each generation of backcrossing, approximately one-half of the donor genome is replaced by that of the recipient, except in the region linked to the chromosomal segment being introgressed, called the differential locus. In general, after 10 backcross generations, the recipient strain contributes 99.9% of the unlinked genome (Dudek and Tritto, 1995). The homozygous animals resulting from crossing between heterozygotes at the differential locus are called congenics. Multiple generations of backcrossing reduce the unlinked donor genome to less than 0.1% (Crabbe et al., 1999; Bennett, 2000). Much initial work has used specialized panels of inbred congenic strains, called recombinant inbred (RI) strains. RI strains are developed by re-inbreeding from an F2 cross between two inbred strains. An example is the BXD RIs, comprised of 26 inbred strains that are fixed homozygous for a mosaic of chromosomal segments derived from either C57BL/6J or DBA/2J progenitor inbred strains. The BXD RI strains have been genotyped systematically for more than 1500 genetic markers scattered throughout the 20 mouse chromosomes, and an elaborate linkage map exists with each marker positioned precisely within a chromosomal region (The Jackson Laboratory Mouse Genome Informatics, http://www.informatics.jax.org). Phenotypic comparisons between mice congenic for the donor region or RI strains and controls from the recipient strain allow for confirmation of the QTL effect and further narrow the intervals in the chromosome for better identification of the effecter gene(s).
When the congenic mouse lines and/or RIs are not available, identifying complex-trait candidate genes after initial low-resolution mapping has proven to be difficult and labor-intensive. One of the central goals of the fine mapping is to identify the effecter gene(s) containing haplotype sequence uniqueness. In other words, a series of novel single-nucleotide polymorphisms (SNPs) within the QTL region may represent another opportunity for the effecter gene(s) to be identified (Lyons et al., 2000; Park et al., 2003). With the rapid availability of the entire sequence of mouse chromosomes of different inbred strains, it may be possible for a mouse inbred strain SNP database to be developed. Recently, it has been suggested that in silico SNP haplotype analysis might be a useful strategy for mapping complex traits (Grupe et al., 2001).
Further application of a recent technological advancement to QTL fine-mapping is the DNA microarray strategy. The basic principle underlying microarray technology is that complementary nucleic acids will hybridize; however, unlike the traditional techniques such as Northern and Southern blots, the microarray contains hundreds to thousands of immobilized DNA spots, which can be simultaneously hybridized with two samples labeled with different fluorescent dyes (Iida and Nishimura, 2002). The microarray method can be adapted to genomic DNA comparison (Cheung et al., 1998). The technical possibility of the combined representational display analysis (RDA) and microarray analysis for fine-mapping of chromosomal DNA has been addressed in the yeast system (personal communication, Dr. S.F. Nelson, UCLA School of Medicine). Although not yet fully established for the mouse, it is a promising method, because RDA can allow for fast screening with about 2000–3000 markers, about an order of magnitude more dense than currently available with microsatellite markers. The combination of RDA with DNA microarray technology promises much faster analysis of the samples, compared with the gel electrophoresis method currently required for microsatellite analysis.
(3) QTLs contributing to craniofacial morphology
Recent QTL studies reported that there might be several loci contributing to the size and shape of the mandible. A series of papers by Leamy, Cheverud, and their colleagues reported QTL analyses in the F2 progeny of F1 hybrids produced by crossing the large (LG/J) and small (SM/J) inbred strain (Cheverud et al., 1997; Leamy, 1997; Leamy et al., 1997, 1998, 2000). Both strains were screened for 472 microsatellite loci, and 10 distance measurements of five landmarks in the mandible were analyzed. From 34 to 37 QTLs have been identified for these distance measurements of mandible landmarks (Cheverud et al., 1997; Leamy et al., 1997). Another study investigated the F2 generation of a cross between SM/J and A/J strains (SMXA RI). Chromosomes 10 and 11 have been found to carry 1 and 2 QTLs, respectively, which potentially influence the mandible length measured as the menton-gonion distance (Dohmoto et al., 2002). In this study, the SM/J-derived loci were located between D11Mit152-Hba and D11Mit229-D11Mit163. The similar measurement depicting mandibular length in the F2 population of LG/J and SM/J was also found to be influenced by a locus between D1Mit14-8.0 and -16.0 (Leamy et al., 1997). Although the resolution of microsatellite loci is not yet sufficiently fine to allow any conclusions to be drawn, it may be postulated that an allele located within this region of chromosome 11 could regulate mandibular length.
We have recently evaluated the morphometric differences of the mouse head between C57Bl/6J and DBA/2J strains and found reproducible differences in width of the zygomatic arch and in snout length (Fig. 1). Cephalometric radiographs of over 150 F2 mice between C57Bl/6J and DBA/2J were evaluated and showed the expected distribution pattern of the zygomatic arch measurement. QTL mapping of these F2 mice has indicated significant logarithm-of-odds (LOD) scores, suggesting that there might be candidate alleles contributing to the size and shape of zygomatic arch and the snout length (Fig. 1).
(III) Mouse Craniofacial Phenotyping
An important advantage of phenotype-based approaches is that they are unbiased, and many genes can be observed simultaneously for their ability to affect phenotypic traits of interest. A predicted end-phenotype results from the action of multiple regulatory and structural genes that constitute the developmental and physiological pathways that underlie biological traits. Therefore, an essential step in any functional genome screening is the establishment of a reproducible quantitative phenotype analysis system.
(1) Geometric morphometrics
The shape measurements can be defined by ratios of inter-landmark distances or angles, or by principal components from outline data or landmark configurations. The direct measurement of mouse bones has been used as a quantitative assay for various studies, including those addressing the QTLs affecting bone size and shape. The dried mouse mandible can be easily separated at the symphysis, resulting in a relatively flat bone sheet. The outline of the mouse mandible can be manually traced or digitized by means of a flatbed scanner. The landmarks such as coronoid process, molar alveolar point, incisor alveolar point, menton, and gonion can be identified and their distances measured (Leamy et al., 1997; Dohmoto et al., 2002).
Recently, a different analysis of shape based on the Procrustes superimposition has been applied in QTL studies (Keightley et al., 1996; Workman et al., 2002). This method appears to be suitable for the study of individual variation and asymmetry, which defines shape as all aspects of the geometric configuration of landmark points except size, location, and orientation. One QTL study on mandible size and shape with the Procrustes measurement identified 12 QTLs affecting overall size and 25 QTLs affecting shape. The total of 37 QTLs appears to be consistent with the previously identified QTLs based on the distance measurement of landmarks, although the detail locus and further allele are yet to be determined.
(2) Cephalometric radiography for a large-scale mutagenesis program
Cost/benefit considerations are paramount in any large-scale program such as ENU mutagenesis. The identification of mutations affecting craniofacial morphology is highly amenable to the ENU approach, because a simple visual examination screens efficiently for initial phenotypes. We have conducted a preliminary study screening any craniofacial/maxillofacial phenotypes in the ENU mutagenesis program established at the Case Western Reserve University School of Medicine (Nishimura et al., 2001). ENU mutagenesis on BALB/cByJ and B6CBF1/J male mice produced mutant offspring. An animal-care technician visually inspected the young mutant offspring (3–5 wks old) for unusual facial or occlusal features. When a morphological abnormality was identified, the animals were then subjected to the non-standardized preliminary radiographic examination. The digitized radiograph was then sent online to the craniofacial experts for further evaluation. The mouse with the confirmed phenotype was transferred to the craniofacial expert team for detailed analysis, including cephalostat-assisted radiography (Fig. 2). The initial screening protocol involving simple visual inspection requires about 30 sec per subject and yields about 1 maxillofacial mutant per 200 offspring animals screened. It must be noted, however, that this method identifies only the more obvious mutants and variants, and many subtle phenotypes are probably missed in visual inspection. Considering these less obvious mutants, we estimate that the maxillofacial traits of interest may be detected in approximately 1% of the animals screened. Careful training of the animal-care technician and implementation of a well-structured evaluation method are likely to improve the sensitivity of this method.
Cephalometric radiography analyses have been developed for the evaluation of specific craniofacial features of rodents. For example, cephalometric radiology was used for the analysis of morphological changes in the chondrocranium of transgenic mice carrying a dominant-negative type X collagen mutation (Chung et al., 1997) and inter-strain variations in mandibular morphology (Bailey, 1986), as well as orthodontic tooth movement in the maxilla (Gange and Johnston, 1974). However, no comprehensive standardized cephalometric analysis has been generated for mice for the purpose of large-scale screening of mutants.
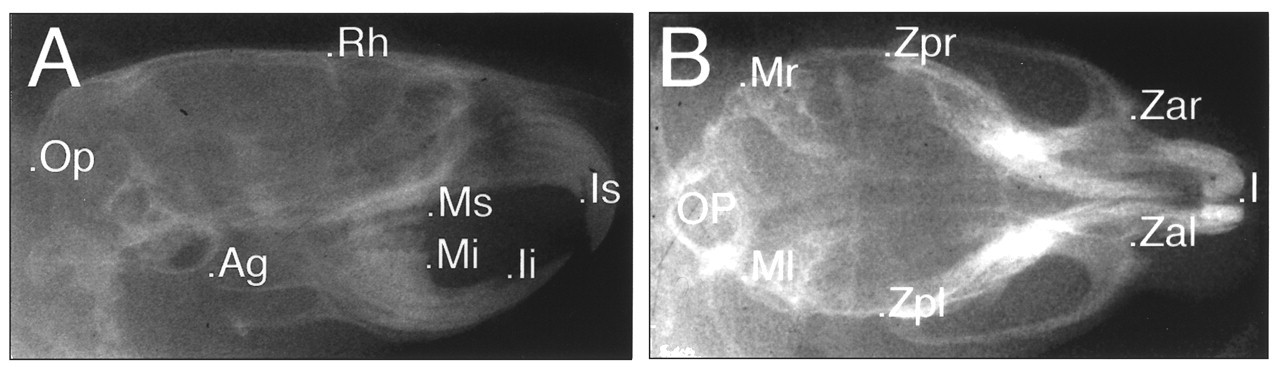
With proper anesthetic procedures, mouse mutants can be evaluated by this method and used for future breeding experiments for identification of the affected allele(s). Therefore, cephalometric radiography can be an important screening method for ENU mutagenesis studies. We designed a cephalostat-assisted dental radiographic technique to produce consistent lateral and submental-vertex views of the maxillofacial skeleton on high-resolution radiographic films (Fig. 3). The cephalographic images are digitized with a scale bar in mm and enlarged approximately 10x in a computer. The landmarks are identified, and cephalometric measurements are calculated by counting of the pixel number between landmarks, which is then normalized by the pixel number between the unit distances (10 mm) (Table). Efforts to limit this cephalometric analysis to a small number of reliable and informative landmarks facilitate the application of this method to the large-scale screening of mutagenesis offspring. Our present analyses are from direct linear measurements, but proportional measurements expressed relative to an internal reference unaffected by a specific mutation can be added to control for potential differences in growth rates among littermates, or uniform overall changes in the size of the craniofacial skeleton. In some analyses, projected or angular measurements are used.
The rapid identification of these ENU mutants is striking, given the paucity of similar mutants in existing catalogues of mouse variants (Lyon et al., 1996). We analyzed the cephalographs of selected ENU mutants. A mutant—Stubby—displays an unusually small mandible and maxilla, as well as a flattened facial appearance (Figs. 2A, 4). Fig. 4E illustrates our measurements of Stubby compared with wild-type littermates, with our screening lateral and submental vertex cephalometric analyses. Analysis of the data demonstrates reductions in specific measurements for anterior-posterior length of the skull (Op-Is and Op-I), anterior-posterior length of the anterior body of mandibular length (Mi-Ii), and pre-maxilla length (Ms-Is). In contrast, the maxillary/cranial height (Rh-Ms) is increased in Stubby, possibly as a compensatory mechanism, and there is no decrease in the overall length of the body of the mandible. Transverse measurements show widening of the maxillofacial region and the posterior skull in Stubby relative to the wild-type littermate (Zar-Zap, Zpr-Zpl, Mr-Ml). Analysis of the cephalometry data suggests a pattern of dysmorphology of the skull in Stubby.
(3) Three-dimensional craniofacial image analysis by micro -CT
For further evaluation and comparison of the jaw morphology of mutants compared with wild-type littermates, micro-CT imaging can be applied. Fig. 5 illustrates a 3-D image of a wild-type mouse skull produced by this method, which allows for the demonstration of structures and landmarks that are impossible to identify by conventional radiographic methods. It also allows for the selection of sections at any desired level and angulation, and the calculation of 3-D distance between any two points.
For example, the distance between the posterior-most point on the angular process of the mandible and the posterior point on the condylar process is 3.97 mm in the 3-D image (Fig. 5). Of particular interest are measurements that cannot be easily obtained by 2-D radiographs, such as details of the coronoid and condylar processes, as well as transverse distances between the same points on the two sides of the maxilla or mandible. The 3-D database of the mouse craniofacial structure is important to provide an integral reference for future studies involving large-scare mutant screening.
Conclusions
As the first phase of the Human Genome Project approaches completion, attention has shifted from problems of gene structure and genome organization to questions of protein function, developmental and physiological pathways, and systems biology. Laboratory mice have many attributes that make them important models for diseases and inherited abnormalities in humans. The striking DNA sequence similarities between humans and mice suggest that discoveries in one species lead to strong inferences in the other, which provides an opportunity for investigators to use functional and experimental studies in mice to learn about the human genome. Planned crosses can be used with genetically defined strains, large sample sizes provide considerable statistical power, mutations can be engineered in specific genes, mutant mice can be examined to identify genetic variants of biomedical interest, and functional assays can be applied to assess diverse disease-related traits at various stages of development. Mouse models provide systems for the evaluation of potential therapeutics, prediction of pharmaceutical effects, and prioritization of treatments for clinical trials.
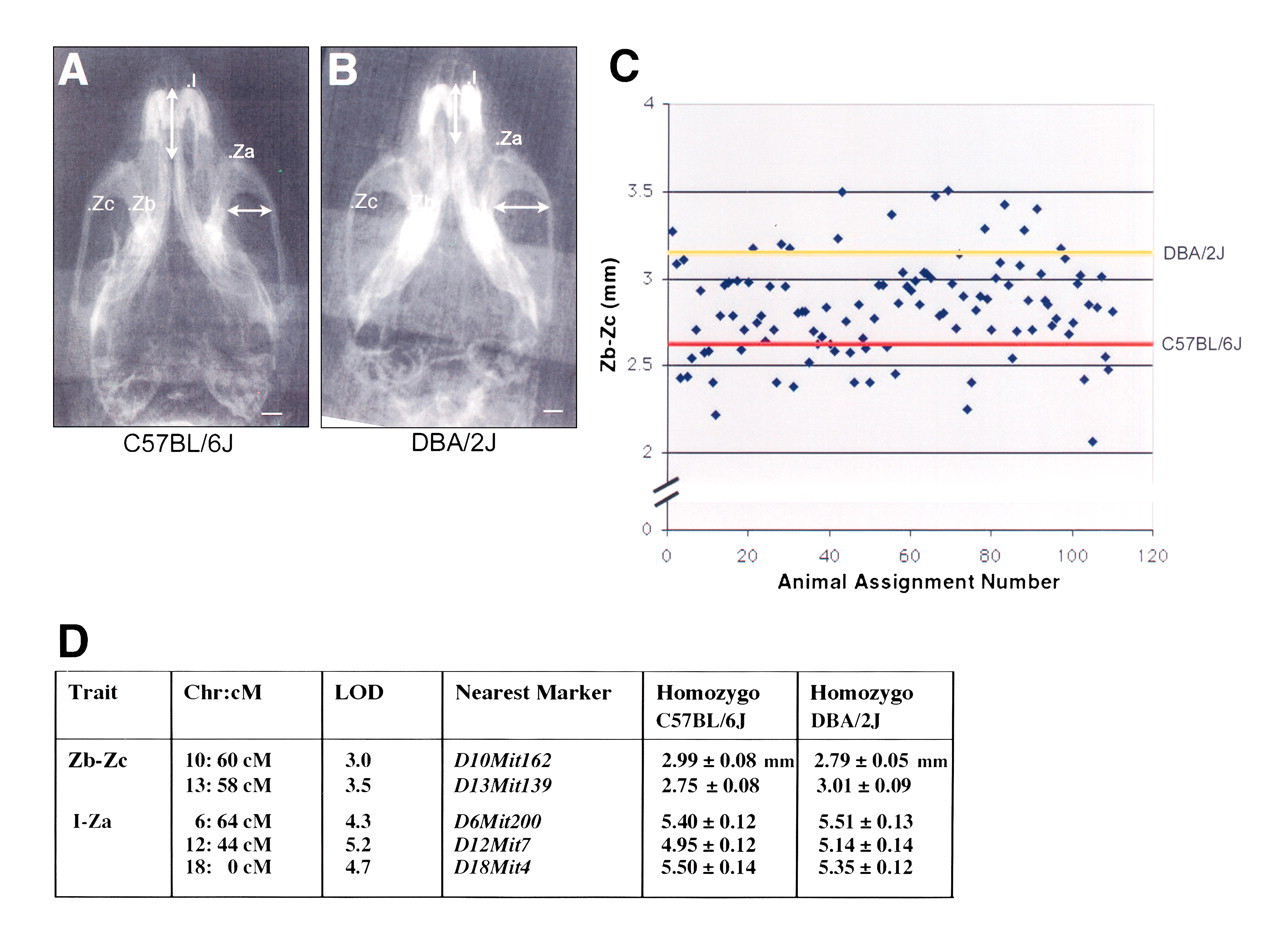
Submental-vertex cephalographs of C57BL/6J
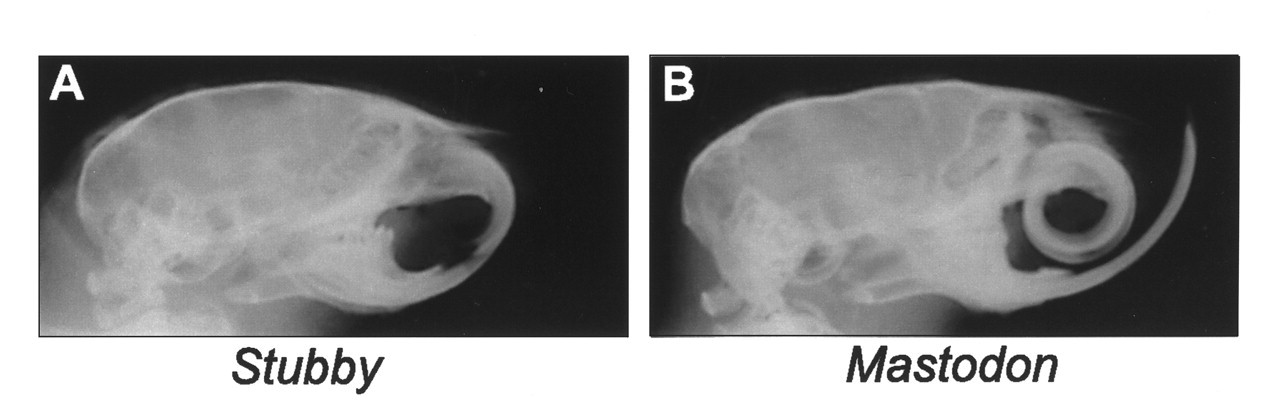
Radiographs of ENU mutants exhibiting craniofacial abnormalities.
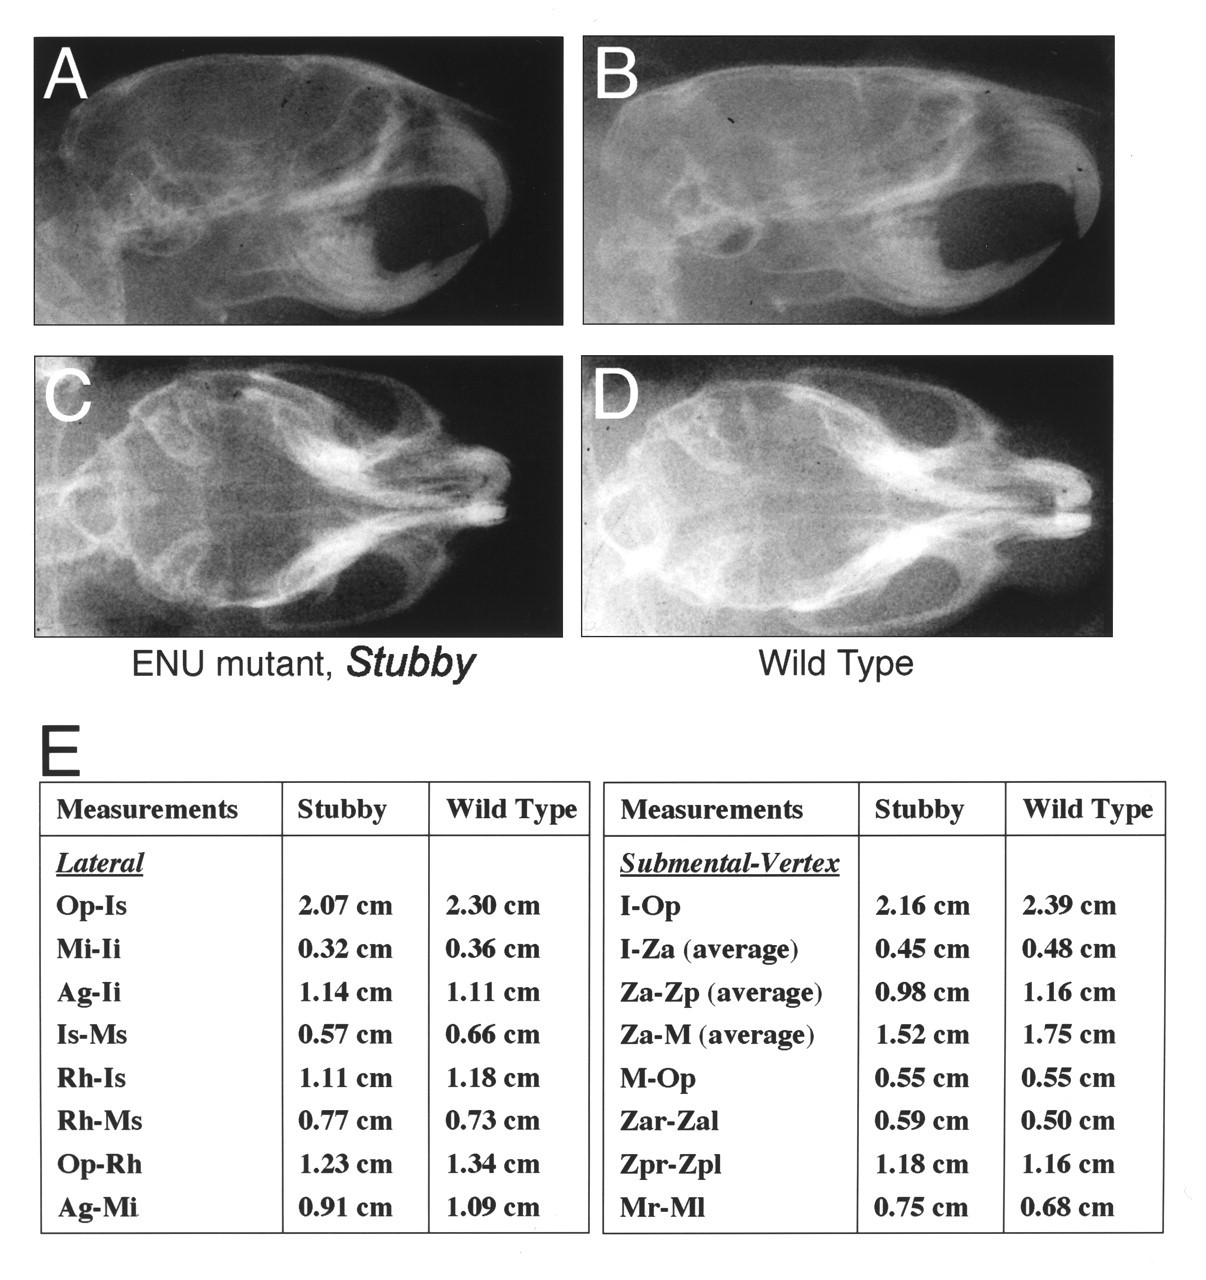
Lateral and submental-vertex cephalographs of the ENU mutant, Stubby (
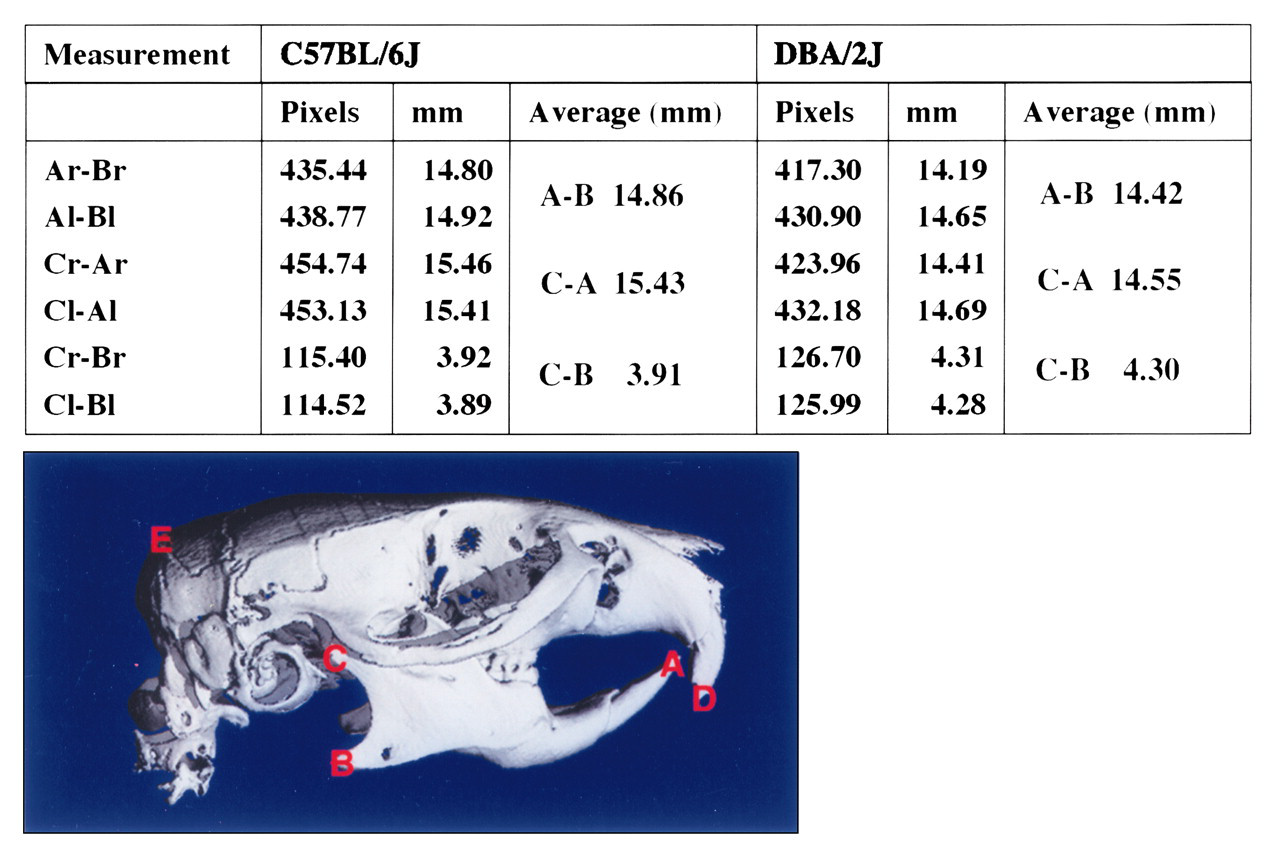
3D cephalometric measurements on microCT images of C57BL/6J and DBA/2J mice. The length and size measurements of the mandible for the right side (r) and left side (l) showed good agreement, suggesting the minimal error from the image acquisition process.
Footnotes
Acknowledgements
This review is based on the research project supported in part by NIH/NIDCR F33DE05750 (JZ), the Dean’s Seed Grant Program of the UCLA School of Dentistry (IN), and NIH/NCRR RR12305 (JHN). We acknowledge the following researchers involved in the preliminary study of ENU mutagenesis screening: Mr. Arash Danny Molayem(UCLA, Anthropology), Mr. Shinya Kurata (University of Tokyo, Department of Integrated Biosciences), Dr. Clarice Law (UCLA School of Dentistry Sections of Pediatric Dentistry and Orthodontics), and Ms. Wendy Liao (UCLA School of Dentistry). We thank Dr. Linda Dubin (UCLA School of Dentistry) for her editorial assistance.