
Abstract
In disability research, there is an increased focus on the well-being of families with a child with a disability, also known as family quality of life (FQOL). However, the well-being of families with a child with profound intellectual and multiple disabilities (PIMD) has not yet been explored, even though their well-being may be affected by the pervasive support needs they need to manage. In turn, sufficient well-being of the family is necessary to guarantee adequate support and thus well-being for the person with PIMD. The purpose of this study was to examine the well-being of families with a child with PIMD, including possible differences between parents and siblings, and how individual and familial factors are related to FQOL. A total of 82 participants from 44 families with a child with PIMD in the Netherlands participated. Multilevel models were employed to analyze FQOL scores and which factors significantly affected scores. Families scored moderately high on both total score and subscales, scoring lowest on emotional well-being. There were significant differences between parents and siblings and a significant effect of age of the respondent on emotional well-being, material well-being, and disability-related support. Siblings scored higher than parents, and scores decreased with age on these domains. Although families with a child with PIMD scored, on average, satisfactory on their FQOL, they were least satisfied with the support for their emotional well-being, and may therefore require additional support for this aspect of their family life. Results of this study contribute to understanding the lives of families with a child with PIMD and their support needs.
Keywords
Persons with profound intellectual and multiple disabilities (PIMD) have both a profound intellectual disability and severe-to-profound motor disabilities (Nakken & Vlaskamp, 2007; Schalock et al., 2021; Van der Putten et al., 2017). They also have extensive limitations in their adaptive behavior (Schalock et al., 2021). In addition, they often need support for their health, related to, for example, epilepsy, gastroesophageal reflux disease, and scoliosis (Nakken & Vlaskamp, 2007; Van Timmeren et al., 2017). Their communication focuses on not only sounds and gestures but also physiological signals such as perspiration and pupillary responses. They may use augmentative and alternative communication aids or rely on others to interpret their gestures (Van der Putten et al., 2017). The support needs of persons with PIMD can therefore be classified as pervasive (Schalock et al., 2021). For formal support, persons with PIMD experience a high turnover of paid support providers (Stringer et al., 2018). Meanwhile, their informal social network is smaller than average and consists mostly of family members (Kamstra et al., 2015). Family members are therefore often an important constant in the lives and support of persons with PIMD.
Moreover, as young people with an intellectual disability today usually live at home, family members, especially parents, provide most of the support for persons with PIMD, and therefore have to manage the pervasive support needs of these persons (Schalock et al., 2021; Van der Putten et al., 2017). Also, due to their fragile health condition, children with PIMD are often hospitalized, which negatively affects the parent’s quality of life (QOL; Seliner et al., 2016). In addition, parents are at times confronted with difficult health care decisions (Zaal-Schuller et al., 2016). Compared with parents of typically developing children, parents of children with PIMD report less leisure time and less time for social contacts due to the time they spend with their child (Luijkx et al., 2017). Maintaining the well-being of their family and its members is therefore complex and a continuous challenge for parents of children with PIMD (Geuze & Goossensen, 2021; Geuze et al., 2022). The amount of support is likely to increase due to the shift (Dermaut et al., 2020) toward informal care in welfare states (i.e., a democratic free-market state where the government tries to guarantee acceptable living standards for its citizens through welfare programs; Delsen, 2016). For example, the Netherlands, which has welfare programs such as social support for families (Nugroho, 2018), is moving toward a “participation society” where a higher degree of social responsibility is expected from citizens (Delsen, 2016; Dermaut et al., 2020).
It is important to note that supporting someone with an intellectual disability does not carry significant problems for the majority of parents and siblings (Hastings, 2016) and may also have a positive impact, such as personal development, increased persistence and understanding, and/or a new perspective on life (Beighton & Wills, 2019). Thus, a solely negative narrative (i.e., in which families are viewed as burdened) does not accurately reflect the life of families with a child with an intellectual disability, and should make place for a more complex and nuanced perspective (Hastings, 2016). Instead of being reduced to the single feature of having a child with a disability, families rather have to manage unique and additional support demands, which is a possible stressor that each family deals with differently (Steel et al., 2011). Indeed, families with a child with PIMD report that their child affects their family life both positively and negatively (Luijkx et al., 2019).
Providing specialized and continuous support is typical for families with a child with an intellectual disability. As a family is understood as a unique, dynamic, and complex system in which each family member affects another and that should therefore be studied as a whole (White et al., 2018), the impact of providing support should be studied from a system perspective (Boelsma et al., 2017). In turn, the well-being of support providers may affect the quality and continuity of the support they provide, and by that, the QOL of the person with an intellectual disability. Disability research has therefore taken an interest in the life and needs of families with a child with an intellectual disability, which has led to the development of the concept of “Family Quality of Life” (FQOL; Zuna et al., 2010). FQOL is defined as “a dynamic sense of well-being of the family, collectively and subjectively defined and informed by its members, in which individual and family-level needs interact” (Zuna et al., 2010, p. 262). In addition, a theoretical framework has been developed that describes FQOL as the outcome of, but also the input to, the interaction of various factors at four different levels: (a) individual family members (e.g., age, gender, ethnicity); (b) family (e.g., family income, geographic location, family size); (c) support, services, and practices (e.g., respite care, medical care, therapy); and (d) systems, policies, and programs (e.g., government regulation of provided services, education).
To measure FQOL, the Beach Center FQOL Scale was developed (Hoffman et al., 2006). This questionnaire constructs FQOL out of five domains: (a) family interaction, (b) parenting, (c) emotional well-being, (d) material well-being, and (e) disability-related support. So far, it has been used to study the FQOL scores of families with children with various disabilities, such as Down syndrome (Foley et al., 2014), autism (Gardiner & Iarocci, 2015; Pozo et al., 2014), Tourette syndrome (Khoury, 2010), developmental disability and delay (Davis & Gavidia-Payne, 2009), and intellectual disability (Boehm & Carter, 2019; Vanderkerken et al., 2018), but not PIMD specifically. Overall, families in these studies were satisfied with the FQOL constructs, with the lowest scores in the domain of emotional well-being.
Notable, however, is that the majority of studies that use the Beach Center FQOL Scale have only included the mother’s perspective and not the father’s, which is a common bias in studies about families of persons with an intellectual disability (Davys et al., 2017). Studies that did include both parental perspectives (e.g., Khoury, 2010; Vanderkerken et al., 2018; Wang et al., 2006) found no significant differences in scores between mothers and fathers. Furthermore, siblings have a different perspective than their parents on the impact of their brother or sister’s disability (Guite et al., 2004), and also have a different perspective on what FQOL entails (Correia & Seabra-Santos, 2021; Moyson & Roeyers, 2012), and could therefore score differently on FQOL than parents. However, a study by Vanderkerken et al. (2018) appears to be the only study using the Beach Center FQOL Scale that has included siblings. Although they found no significant differences between parents and siblings on FQOL scores, more research is needed to gain further insights into the similarities and differences between parents and siblings regarding FQOL scores, so as to properly support all family members. Considering the pervasive support needs of a person with PIMD, we are interested in gaining insights as to how this affects the experience of siblings.
Apart from understanding how families with a child with PIMD experience their FQOL, we are also interested in what factors affect the well-being of these families (Zuna et al., 2010). A growing number of studies have generated more insights into the influence of various factors on the well-being of families with a child with an intellectual disability (Luitwieler et al., 2021). Residence of the child has been found to have an impact on FQOL, in that families whose child with severe disabilities lives at home report higher FQOL scores compared with families whose child lives in a residential facility (McFelea & Raver, 2012). For other factors, there are mixed findings regarding their impact on FQOL. For example, parental employment status has (Giné et al., 2015; Vanderkerken et al., 2018) and has not (Mas et al., 2016) been found to affect FQOL. Similarly, age of the child with an intellectual disability has (Giné et al., 2015; Luitwieler et al., 2021) and has not (Boehm & Carter, 2019; Davis & Gavidia-Payne, 2009; Luitwieler et al., 2021; Schertz et al., 2016; Vanderkerken et al., 2018) been found to affect FQOL. Age of the respondent has been found to affect FQOL positively (Luitwieler et al., 2021), negatively (Vanderkerken et al., 2018), or not at all (Davis & Gavidia-Payne, 2009). Family income too has (Boehm & Carter, 2019; Davis & Gavidia-Payne, 2009; Luitwieler et al., 2021; Wang et al., 2004) and has not (Luitwieler et al., 2021) been found to affect FQOL. No studies have looked into how these factors influence the FQOL scores of families with a child with PIMD specifically, and we therefore included these in our study.
While no study has explored the FQOL scores of families with a child with PIMD, there is a clear need to do so, considering the pervasive support needs these families have to manage. In the current study, we therefore investigated the well-being of families with a child with PIMD and asked the following research questions:
While this study is exploratory, we can make predictions based on previous research. We expect families to be satisfied with their FQOL on average, but least satisfied with the domain of emotional well-being (e.g., Boehm & Carter, 2019; Foley et al., 2014; Gardiner & Iarocci, 2015; Khoury, 2010; Vanderkerken et al., 2018). Based on the study of Vanderkerken et al. (2018), no differences between parents and siblings in FQOL scores are expected. For individual and familial characteristics, we expect to find no impact of gender (e.g., Khoury, 2010; Vanderkerken et al., 2018; Wang et al., 2006) and a higher FQOL for families whose child lives at home (McFelea & Raver, 2012). The impact of other characteristics is difficult to predict, due to mixed findings of previous studies (Luitwieler et al., 2021). By answering these research questions, we may gain further insights into the lives of families with a child with PIMD and how their well-being is formed.
Method
Recruitment
Information regarding the study and the overall project was sent out to possible participants through social media, conferences, websites, newsletters and magazines, leaflets and letters sent out to service-providing facilities, and personal messages. Interested parties could sign up and (when agreeing to participate) were approached by email to complete an online questionnaire regarding the characteristics of their child (e.g., indication of the level of the intellectual disability, motor functioning skills, communicative abilities, and additional health conditions), by which the researchers could determine if the child had PIMD. Children were considered to have PIMD if they had a profound intellectual disability (i.e., estimated intelligence quotient of <25 points/developmental age <24 months) and a severe or profound motor disability (i.e., Level IV or V on the Gross Motor Functioning Classification System [GMFCS]; Palisano et al., 1997). Only families with a child with PIMD between the ages of 0 and 30 years were included, as we planned to do a follow-up study involving the experiences of siblings of a person with PIMD aged 30 and older (Dorsman et al., 2023).
Participants
A total of 44 families participated, of which 23 fathers aged 33 to 67 years (M = 47.9, SD = 8.1), 41 mothers aged 29 to 66 years (M = 44.9, SD = 8.1), six brothers aged 12 to 20 years (M = 15.2, SD = 2.8), and 12 sisters aged 13 to 20 years (M = 16.3, SD = 2.8) participated. All participants were from the Netherlands and spoke Dutch. The 44 children (21 men, 23 women) with PIMD were aged 3 to 30 years (M = 12.1, SD = 6.8). See Table 1 for additional participant characteristics.
Characteristics of Participants (Family, Parents, and Child with PIMD).
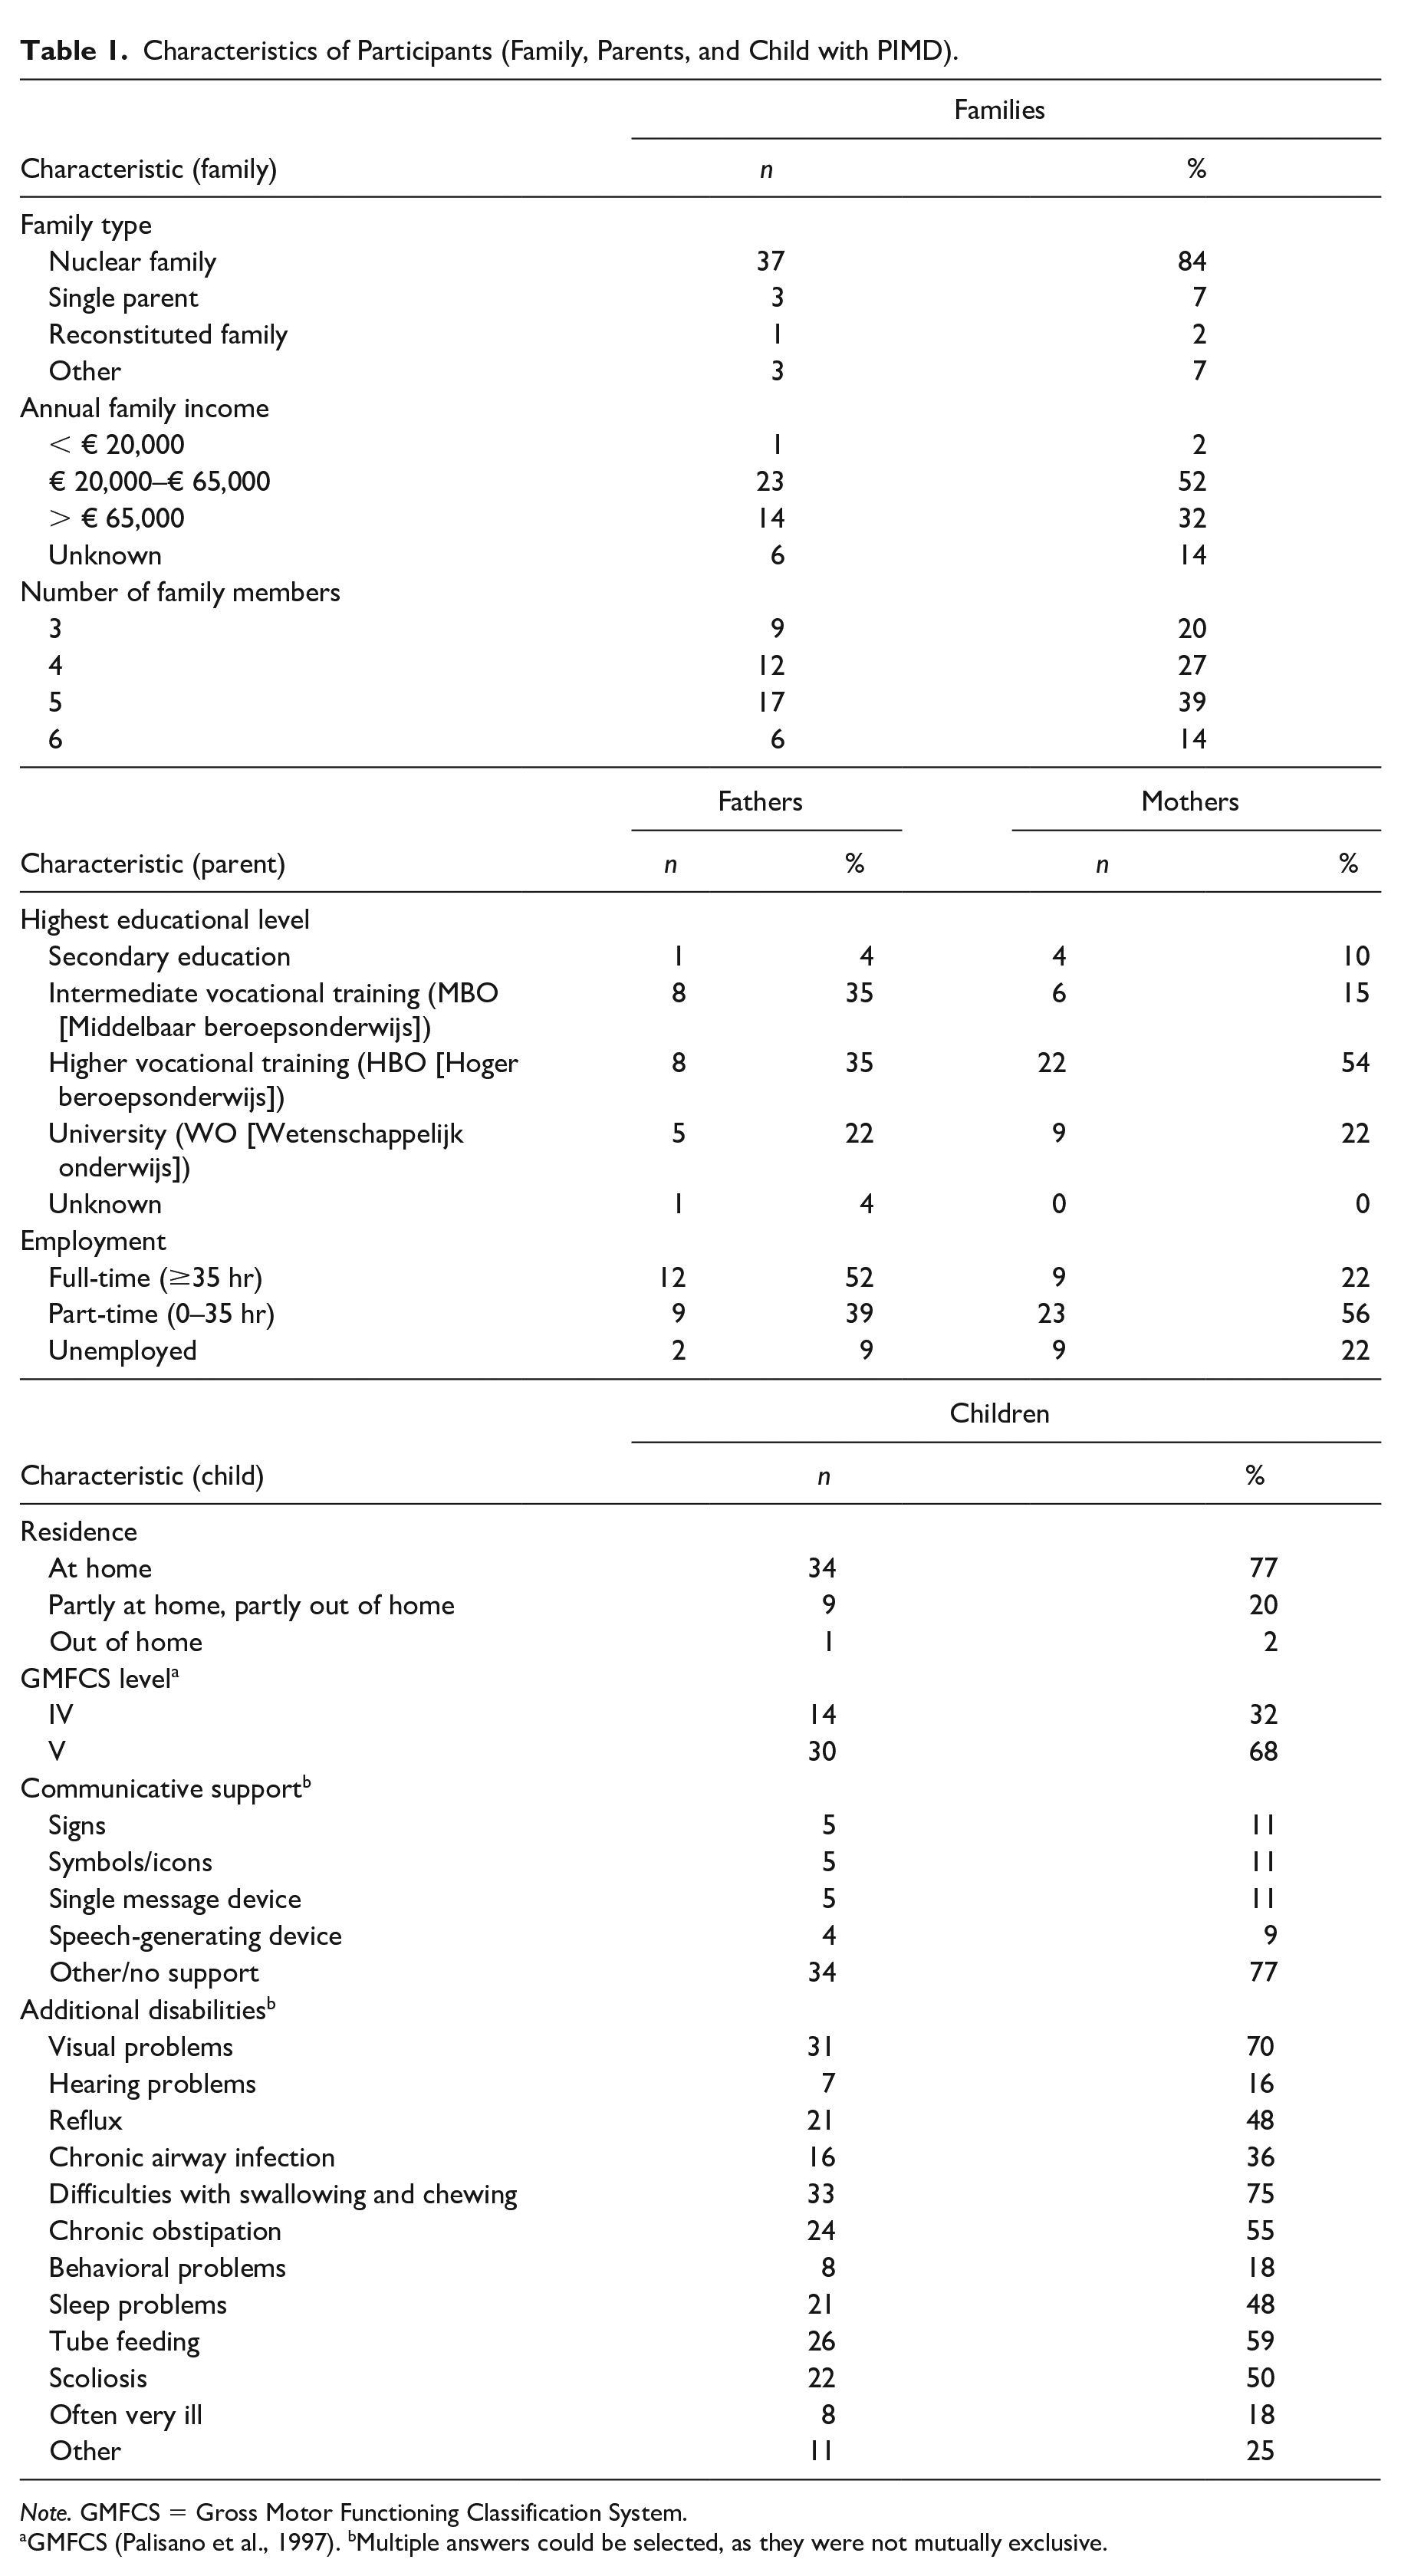
Note. GMFCS = Gross Motor Functioning Classification System.
GMFCS (Palisano et al., 1997). bMultiple answers could be selected, as they were not mutually exclusive.
Ethics
Ethical permission for this study was granted by the ethical committee of the Department of Pedagogical and Educational Sciences (Ethische Commissie PEDON) after independent review. Written informed consent was gathered from all participants aged > 12 years, and parents gave consent for their children without PIMD aged 12 to 16 years. Participants received no financial compensation, but were informed of the study outcomes.
Procedure
Families who signed up and met the criteria of having a child with PIMD aged 0 to 30 years received detailed information about the study and were asked for consent. After consent was received, they were asked to provide background characteristics of their family, including age and gender of family members. Based on this, further consent forms and invitations to the online questionnaires were sent out to all family members aged > 12 years. We used the same cut-off age as Vanderkerken et al. (2018) and a similar justification, namely, that secondary education in the Netherlands starts at the age of 12 years, and children of that age are therefore expected to have comprehensive writing and reading skills and understand more complex subjects. Participants were asked to complete the questionnaire by themselves without consultation from other family members (so as to measure their individual satisfaction), but could ask the researchers questions for clarification. (Bi-)weekly reminders (to a maximum of four) were sent out to remind participants about completing the questionnaires. Out of 61 families who signed up and met the inclusion criteria (and were therefore invited for this study), 44 families ultimately participated in that at least one family member completed a questionnaire. Of these families, 114 family members were invited in total, 82 of which completed a questionnaire (a response rate of 71.9%). No particular differences were noted between responders and non-responders (e.g., age, gender, family income). More mothers than fathers completed the questionnaire, but no particular patterns were noted between mothers and fathers, other than that for most families, it was the mother who signed the family up for the study.
Materials
FQOL was measured by the Beach Center FQOL Scale (Hoffman et al., 2006). This scale consists of 25 questions, divided over five subscales measuring different aspects of FQOL: Family Interaction, Parenting, Emotional Well-Being, Material Well-Being, and Disability-Related Support. Participants indicated their satisfaction regarding different aspects of their family life on a 5-point Likert-type scale (1 = very dissatisfied, 5 = very satisfied). The Beach Center FQOL Scale was selected because of its clarity and brevity, its good psychometrics properties (overall Cronbach’s α = .88, strong construct validity; Hoffman et al., 2006; Van Beurden, 2011), and its widespread international use. The Dutch/Flemish version of the scale (Vanderkerken et al., 2018) was used with some minor modifications, changing typical Flemish expressions into ones more common in the Netherlands (i.e., “noden” into “behoeften,” and “kan om met” into “kan omgaan met”). For this study sample, the overall Cronbach’s α of the questionnaire was .88. The Cronbach’s α was also calculated for each subscale: Parenting (.79), Family Interaction (.83), Emotional Well-Being (.74), Material Well-Being (.83), and Disability-Related Support (.67).
Data Analysis
Because of the nestedness of the data (i.e., family members within families), multilevel analyses were used to answer the research questions. In multilevel analysis, the coefficient (or effect) of a variable divided by its standard error produces a t value, which can be used to determine whether a variable has a significant impact (Snijders & Bosker, 2011). For a high number of participants, a standard normal distribution can be assumed. In a standard normal distribution, a z value of ± 2 indicates significance of at least p = .05 for a two-tailed test. Thus, we considered all effects that were at least twice as large as their standard error to be significant. Multilevel analyses were carried out in MLwiN 3.05 (Charlton et al., 2020).
Research Question 1
An empty (i.e., without any variables) two-level model (Level 1: individual family members, Level 2: families) with and without predictors was built initially for the total FQOL score, subscale scores, to study the variances within and between families, and to study the scores per question. Minimum and maximum scores were calculated using IBM SPSS Statistics (Version 25).
Research Question 2
Family role (parent or sibling) was added as a variable to the empty model to determine if scores differed between parents and siblings.
Research Question 3
To determine the impact of the various familial and individual characteristics, separate models were created for each variable, by adding the variable to the empty model.
Informed by previous studies, the following variables were included to determine how each affected FQOL. Age of the child with PIMD (in years; e.g., Boehm & Carter, 2019; Giné et al., 2015; Luitwieler et al., 2021; Schertz et al., 2016), age of the respondent (in years; e.g., Davis & Gavidia-Payne, 2009; Luitwieler et al., 2021; Vanderkerken et al., 2018), gender of the participant (male or female; e.g., Khoury, 2010; Vanderkerken et al., 2018; Wang et al., 2006), employment status of the parent(s) (in weekly hours; e.g., Giné et al., 2015; Mas et al., 2016; Vanderkerken et al., 2018), residence of the child with PIMD (at home or partly at home/out of home; McFelea & Raver, 2012), and annual family income (less than € 65,000 per year or more than € 65,000 per year; e.g., Boehm & Carter, 2019; Luitwieler et al., 2021; Wang et al., 2004). A high income can be defined as the median income doubled (Pew Research Center, 2021). We used the known average annual income per person in the Netherlands in 2019, € 33,400 (CBS, 2021), for a cut-off of € 65,000 per year.
Results
All data were confirmed to be normally distributed through visual inspection of boxplots and scatterplots. All questionnaires were fully completed, and there was no missing data. Data in this study were gathered before and during the COVID-19 pandemic, but no significant differences in FQOL scores were found (based on a multilevel analysis with time of completion [pre- and during pandemic] as a variable).
FQOL Scores
For a multilevel analysis of FQOL scores, a so-called null or empty model was built (see Table 2). Differences between families accounted for 13.3% of the variability for the total FQOL score. The subscale of Emotional Well-Being had the lowest intercept (i.e., average score), Material Well-Being the highest. Table 3 shows the minimum and maximum FQOL and subscale scores. Figure 1 shows a visual representation of how the FQOL scores are distributed over families and their members.
Null Model (No Explanatory Variables) of FQOL and Subscale Scores (N = 82).
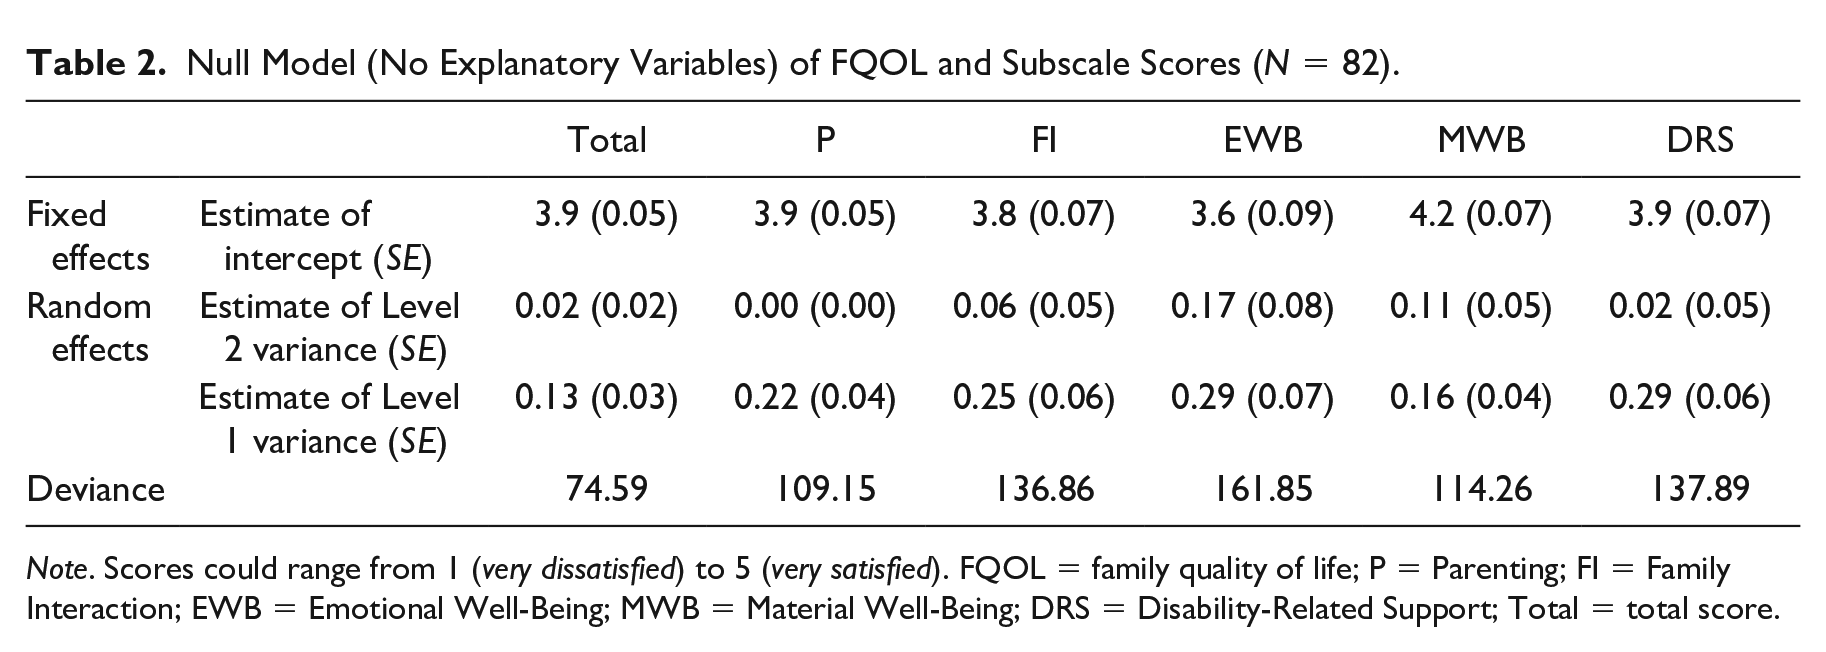
Note. Scores could range from 1 (very dissatisfied) to 5 (very satisfied). FQOL = family quality of life; P = Parenting; FI = Family Interaction; EWB = Emotional Well-Being; MWB = Material Well-Being; DRS = Disability-Related Support; Total = total score.
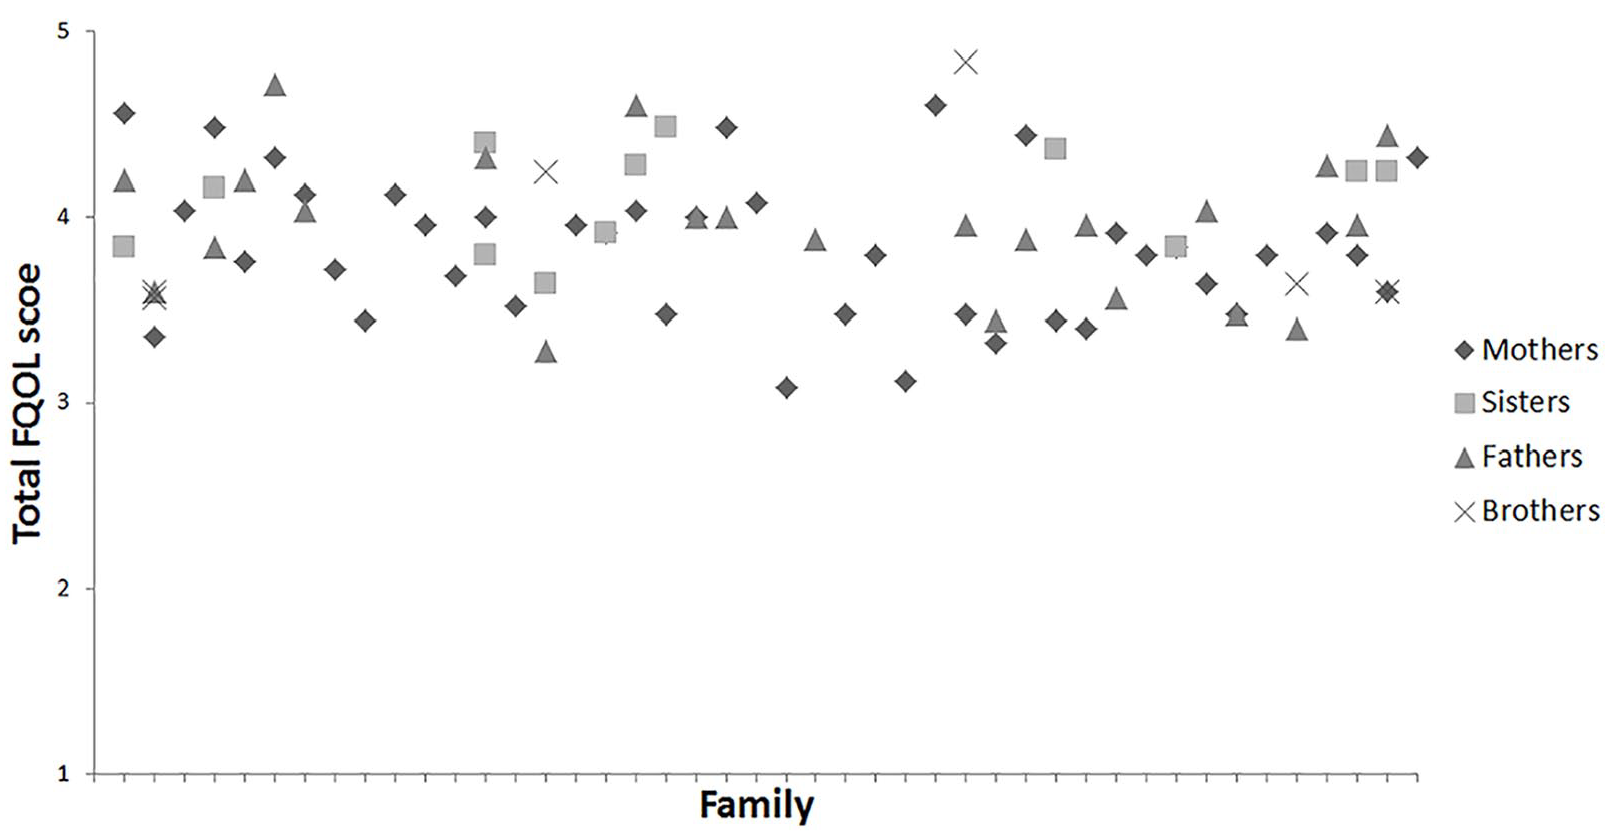
Distribution of Total FQOL Scores for Each Participant Grouped by Family
Minimum and Maximum Values of FQOL and Subscale Scores (N = 82).
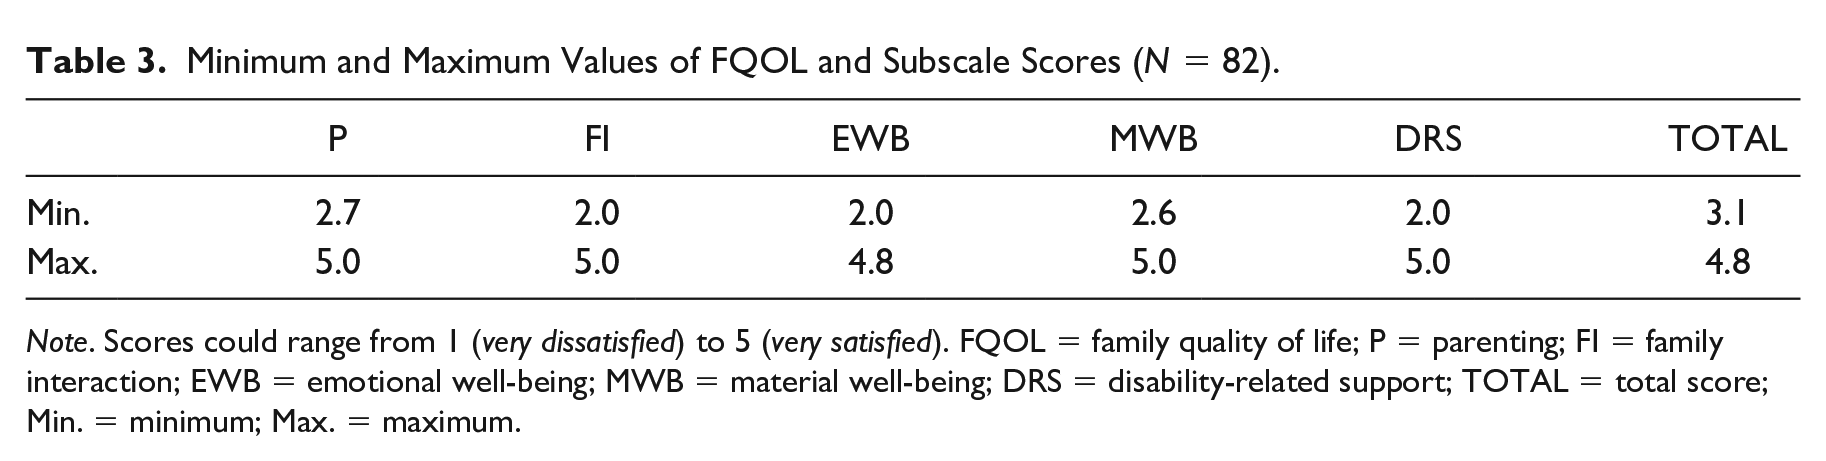
Note. Scores could range from 1 (very dissatisfied) to 5 (very satisfied). FQOL = family quality of life; P = parenting; FI = family interaction; EWB = emotional well-being; MWB = material well-being; DRS = disability-related support; TOTAL = total score; Min. = minimum; Max. = maximum.
Scores were also calculated per question (Table 4). Lowest score (i.e., satisfaction) was for the support for the person with PIMD to make friends, followed by the support to relieve stress. Highest score was for dental care received by the family, followed by transportation facilities of the family.
Average Score per Question of FQOL Questionnaire Sorted per Subscale (N = 82).
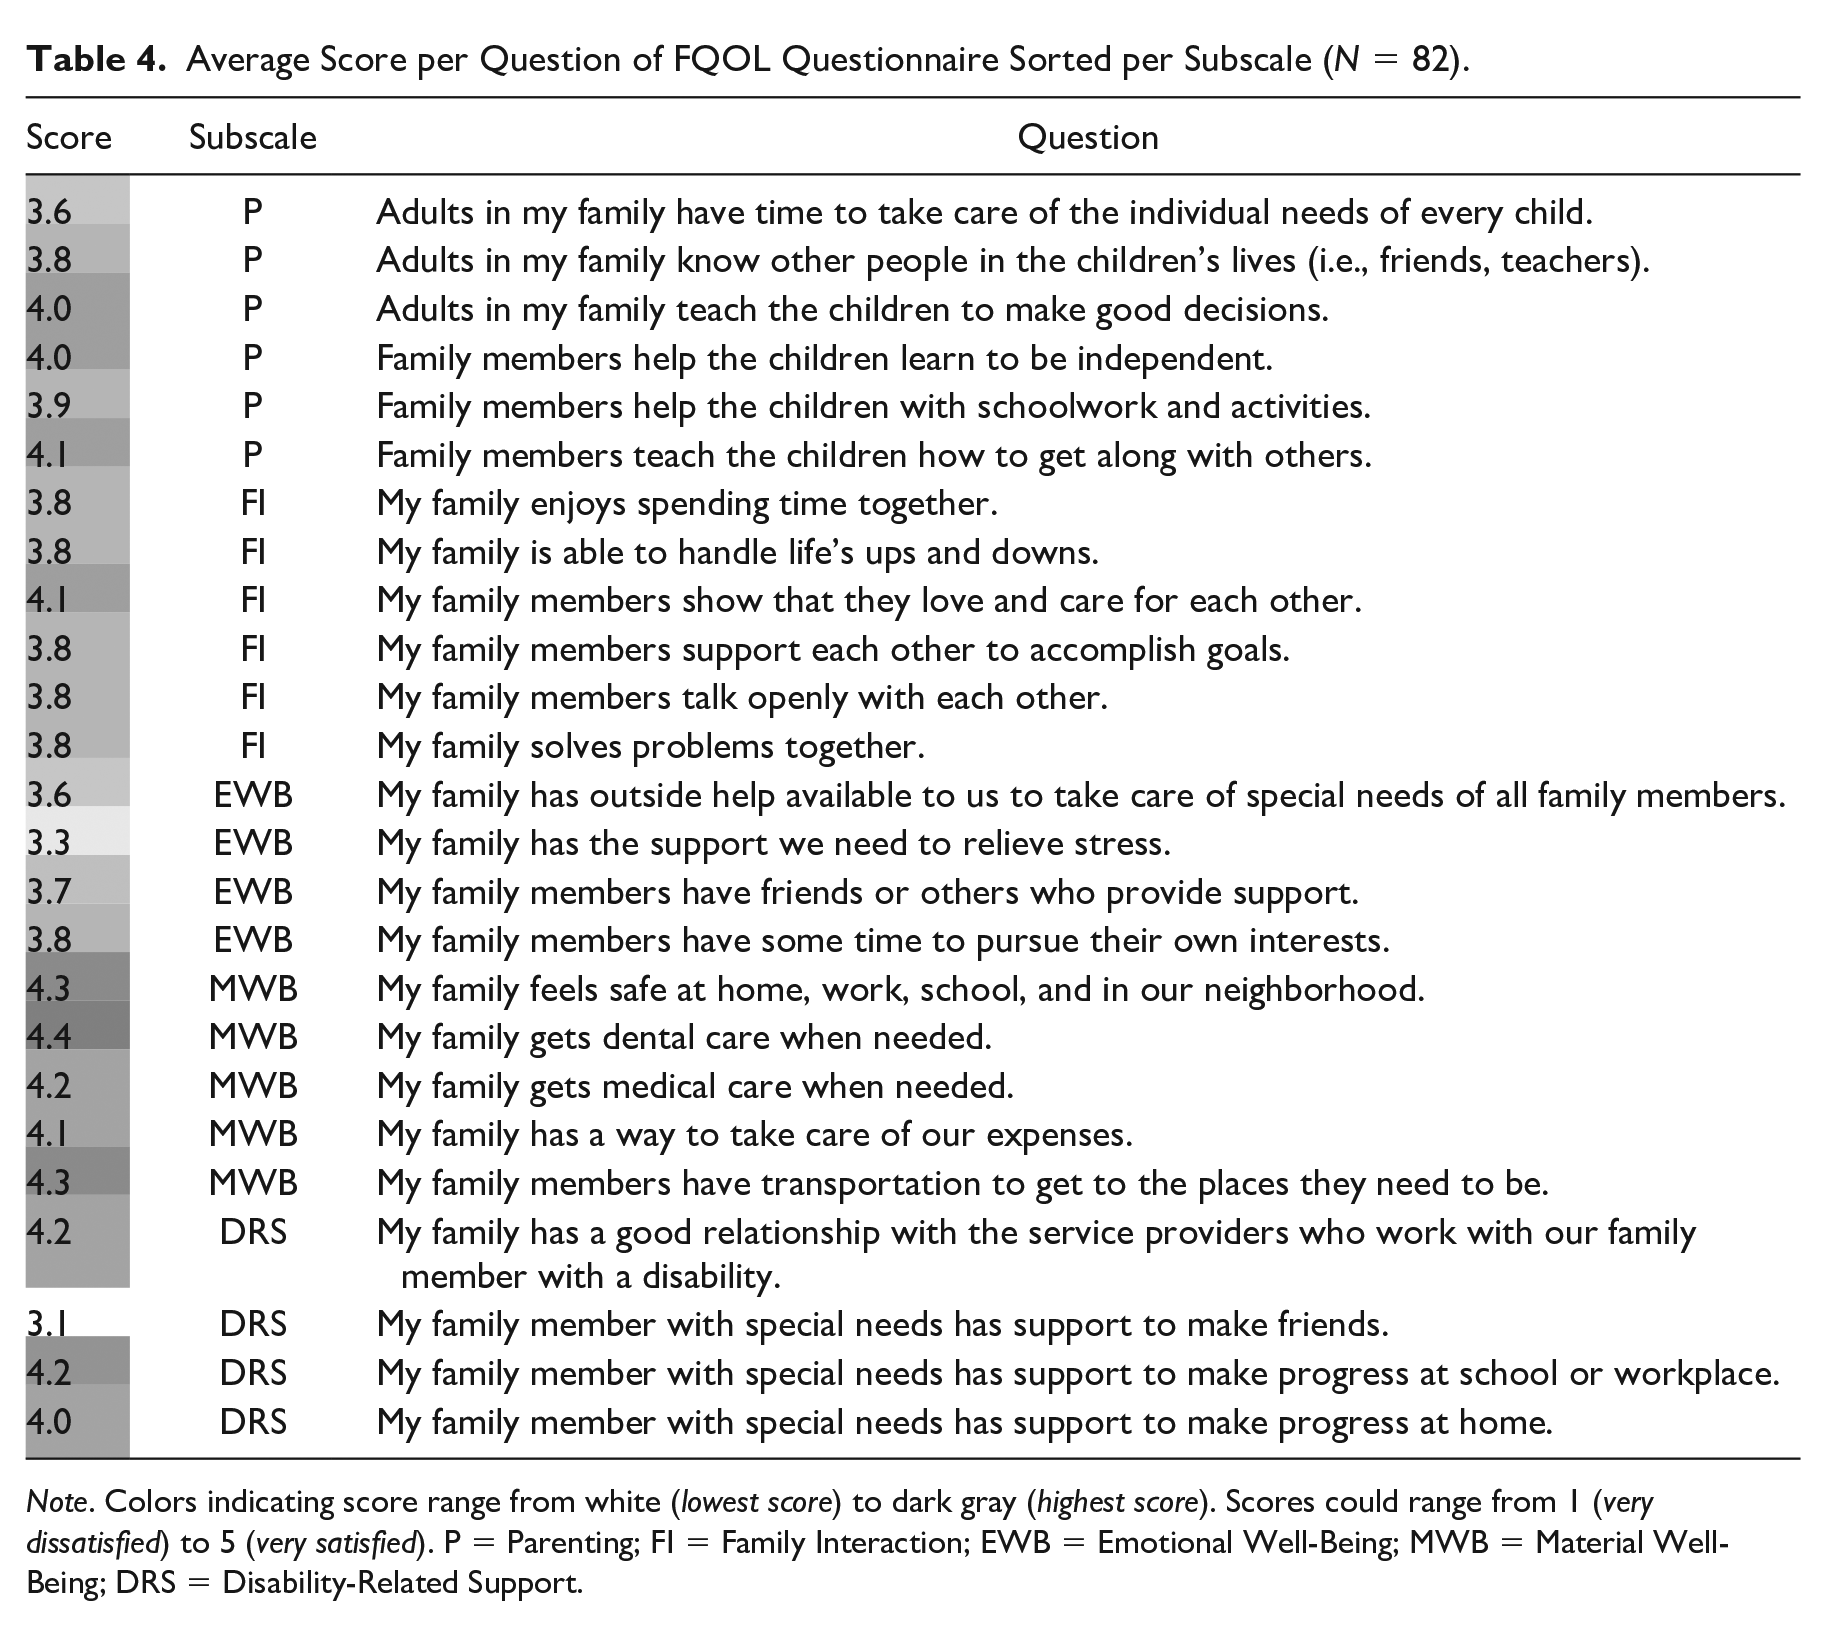
Note. Colors indicating score range from white (lowest score) to dark gray (highest score). Scores could range from 1 (very dissatisfied) to 5 (very satisfied). P = Parenting; FI = Family Interaction; EWB = Emotional Well-Being; MWB = Material Well-Being; DRS = Disability-Related Support.
Differences Between Parents and Siblings
Siblings scored significantly higher than parents on the subscales of Emotional Well-Being, Material Well-Being, and Disability-Related Support. For example, on the subscale of Emotional Well-Being, siblings scored about half a point higher than parents on average (Level 1 variable effect of .49). There was no significant difference between family members on total FQOL score. See Table 5 for additional statistics.
Model of FQOL and Subscales Scores with Level 1 Variable (Family Role) Added (N = 82).
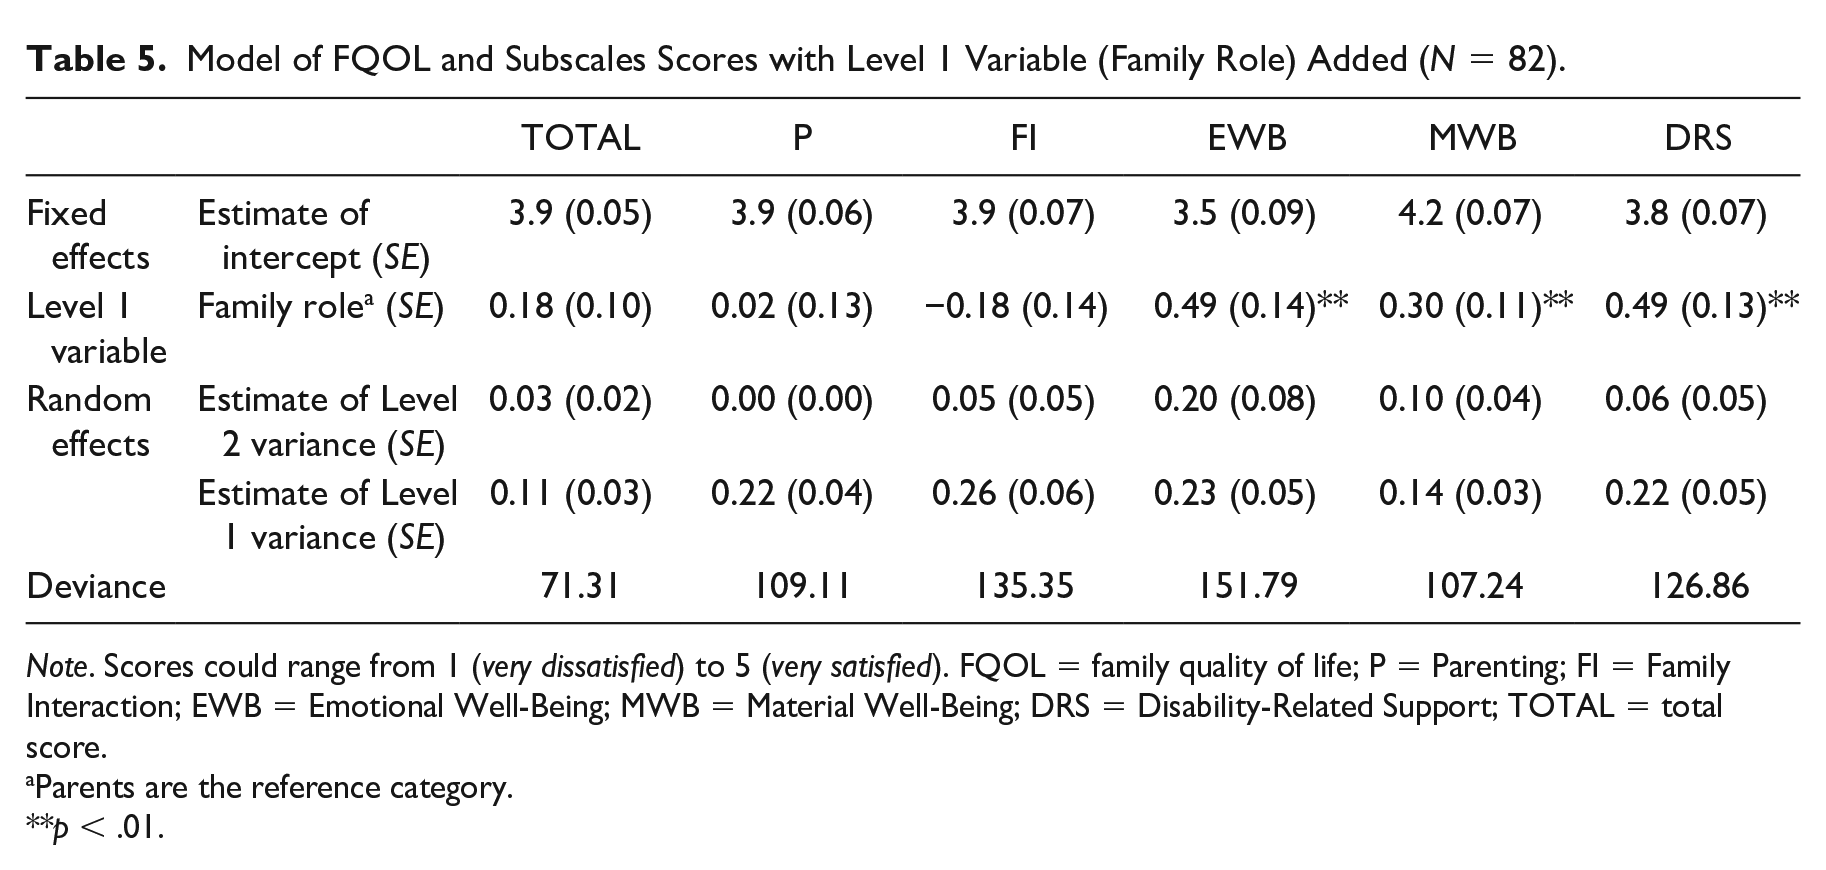
Note. Scores could range from 1 (very dissatisfied) to 5 (very satisfied). FQOL = family quality of life; P = Parenting; FI = Family Interaction; EWB = Emotional Well-Being; MWB = Material Well-Being; DRS = Disability-Related Support; TOTAL = total score.
Parents are the reference category.
p < .01.
Impact of Family and Individual Characteristics
Age of the respondent had a small, but significant effect on the subscales of Emotional Well-Being, Material Well-Being, and Disability-Related Support, in that scores on these subscales decreased with age (Table 6). Gender, parental employment, family income, residence of the child, and age of the child with PIMD (tables not included) did not have a significant effect on both total and subscale FQOL scores.
Model of FQOL and Subscales Scores with Level 1 Variable (Age of the Respondent) Added (N = 82).
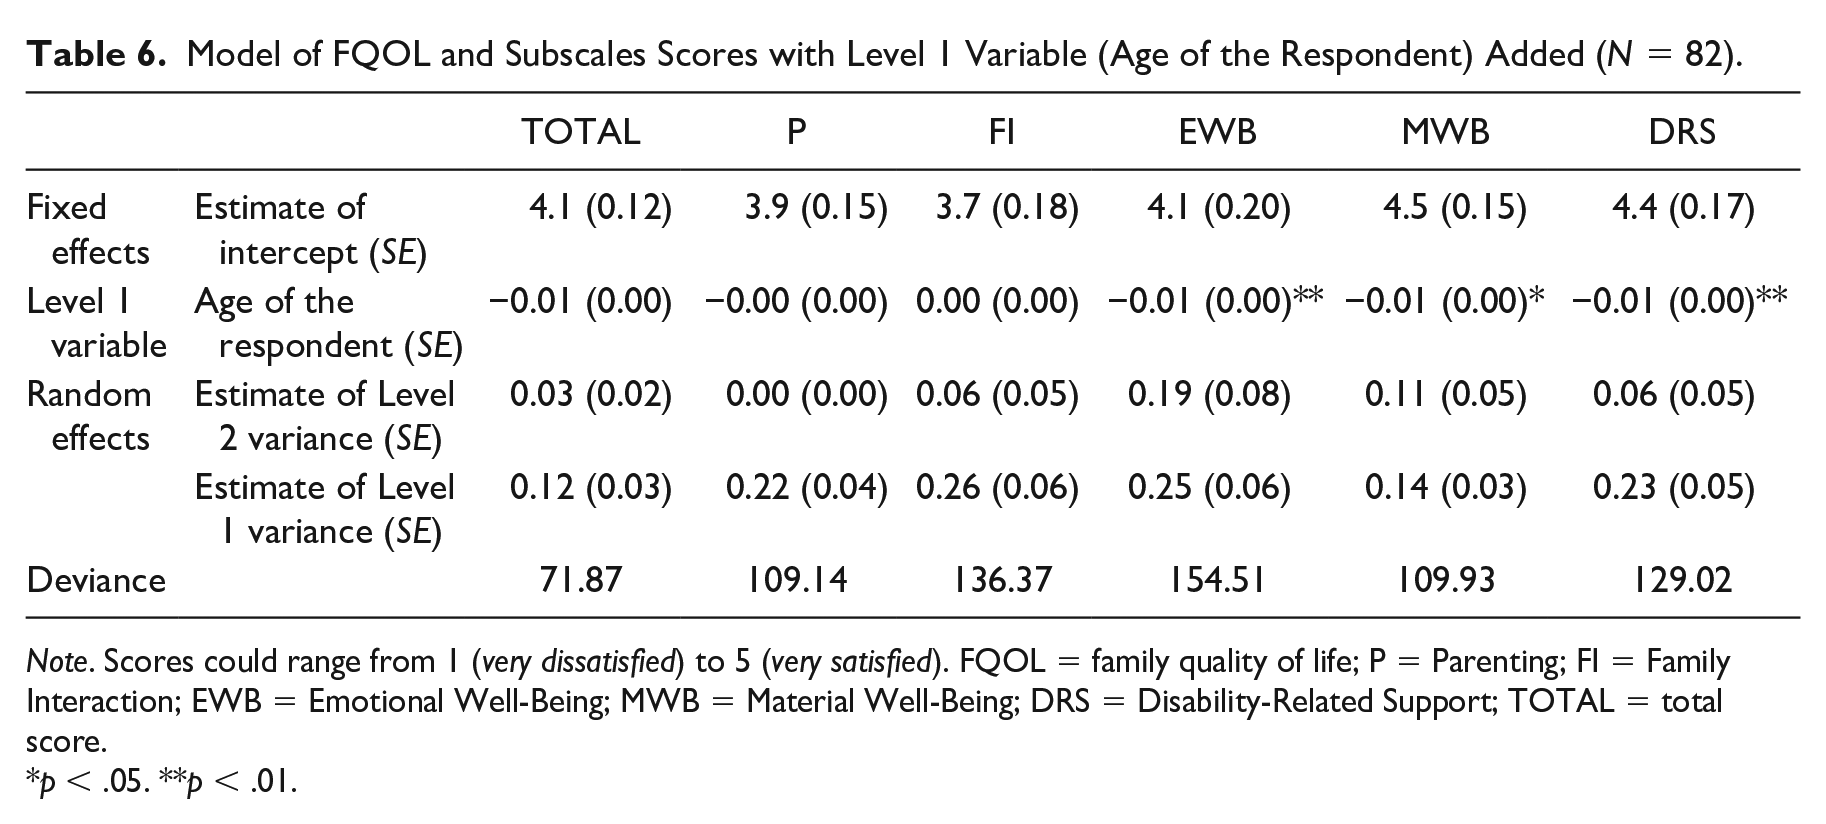
Note. Scores could range from 1 (very dissatisfied) to 5 (very satisfied). FQOL = family quality of life; P = Parenting; FI = Family Interaction; EWB = Emotional Well-Being; MWB = Material Well-Being; DRS = Disability-Related Support; TOTAL = total score.
p < .05. **p < .01.
Discussion
The aim of this study was to investigate the well-being of families with a child with PIMD from the perspectives of as many family members as possible. We explored how FQOL is scored, if there were differences in scores between parents and siblings, and which variables affected the FQOL scores of these families. We found that families are satisfied with their total FQOL as well as its subdomains, least satisfied with emotional well-being, and most with material well-being. Siblings scored significantly higher than parents on the subscales of Emotional Well-Being, Material Well-Being, and Disability-Related Support. Age of the respondent had an effect on FQOL, in that participants scored significantly lower on the subscales of Emotional Well-Being, Material Well-Being, and Disability-Related Support. Other considered variables, namely, gender of the participant, family income, age of the child with PIMD, parental employment, and residence of the child with PIMD, did not affect FQOL.
Participants scored high on total FQOL and subscale scores, with the lowest score for Emotional Well-Being. This is consistent with the results of previous studies (e.g., Boehm & Carter, 2019; Davis & Gavidia-Payne, 2009; Foley et al., 2014; Gardiner & Iarocci, 2015; Khoury, 2010; Vanderkerken et al., 2018). Moreover, we know that parents of children with PIMD have less leisure time and time for social contacts (Luijkx et al., 2017), which is consistent with the subscale of Emotional Well-Being scoring the lowest. That is, this domain considers if family members have time for themselves, if they can relieve stress, and if they have outside support. Families with a child with PIMD may therefore need more support for these aspects of their family life.
However, while the support needs of individuals with PIMD are pervasive, and the degree of support needs is known to negatively affect FQOL (Mas et al., 2016; Wang et al., 2004), the scores in this study are in the higher range, and similar to other FQOL studies (which looked at families with children with less severe disabilities). One way to understand this outcome is that the sample may be biased, in that only families who experienced a good to high well-being (and were therefore satisfied with their FQOL) participated in this study. However, a more plausible explanation is that QOL (and similarly, FQOL) is under “homeostatic control,” in that it is kept within a small and positive range by people (Cummins, 2015). On any QOL survey, people consistently score on average about 75% of the maximum score. Homeostatic resources (such as coping skills, habituation, and resilience) help to maintain this set-point, and only when resources are inadequate or depleted, a deviation from this set-point occurs. Thus, managing the pervasive support needs of an individual with PIMD does not negatively affect FQOL, as families have sufficient homeostatic resources to maintain a high FQOL. Furthermore, these results show that a child with a disability does not negatively affect their family necessarily (Hastings, 2016), even when that child has pervasive support needs, such as a child with PIMD. It also shows that siblings have a positive experience of FQOL as well, in line with the study of Correia and Seabra-Santos (2021), which showed that siblings of a person with an intellectual disability in general have a positive experience of FQOL. However, these results do not imply that families should not receive support or have no need for it. Moreover, future studies may want to specifically look at families who score high on FQOL to understand what homeostatic resources they employ, and what life events positively or negatively affect FQOL over time, so as to better support families who score low on FQOL.
Contrary to Vanderkerken et al. (2018), we found significant differences between parents and siblings on the domains of emotional well-being, material well-being, and disability-related support, in that siblings scored higher than parents on these domains. This may be attributed to a lack of power in that study: It had a lower number of siblings participating, who also made up a smaller proportion of the study sample. As for the results in the current study, the higher scores of siblings could be explained in that siblings may have a different experience of the issues at hand in the domains of emotional well-being, material well-being, and disability-related support than parents. While siblings are directly involved in, and likely experience, the domains of parenting and family interaction similar to their parents (both positively and negatively), they are presumably less aware of financial problems, parental stress, or lack of support for their sibling with PIMD. Moreover, siblings’ perspective on QOL also differs somewhat from FQOL (Moyson & Roeyers, 2012), which means siblings differ from their parents in which aspects they find important for a good FQOL, and how satisfied they are with these aspects. Interviews with siblings of a person with an intellectual disability indeed show that siblings have a unique perspective on which aspects contribute to FQOL (Correia & Seabra-Santos, 2021). For age of the respondent, the same effects were found for the domains of emotional well-being, material well-being, and disability-related support, in that scores for these domains significantly decreased with age. However, as all parents in this study were older than all siblings participating without overlap, considering the small effect of age of the respondent, and considering that the variance within families is higher than between families, we believe that the effect of age of the respondent found in this study is in fact the difference in scores between parents and siblings. If possible, future research should aim to include older siblings and younger parents, so as to better discriminate between these variables.
Other variables that were considered did not significantly affect FQOL. Gender not affecting FQOL scores is consistent with previous studies using the Beach Center FQOL Scale (e.g., Khoury, 2010; Vanderkerken et al., 2018; Wang et al., 2006). Residence of the person with PIMD not affecting FQOL scores is inconsistent with McFelea and Raver (2012), who found that families whose child does not live at home experience a higher FQOL. However, the number of families with a child not living at home was limited in this study, and the impact of residence of the child may therefore not have been accurately determined. Similarly, there were a limited number of families with a low income participating, thus the impact of income may not have been accurately determined either. Previous studies (e.g., Giné et al., 2015; Luitwieler et al., 2021; Vanderkerken et al., 2018) showed mixed findings for the impact of age of the child and parental employment, and are therefore difficult to compare, though no impact of these factors was found in this study.
The question on the support of the person with a disability to make friends received the lowest score on average. Participants were offered to give feedback at the end of the questionnaire, and some specifically remarked that their child or sibling was unable to make friends. If this is true, the Beach Center FQOL Scale may not be appropriate for this population, although it could also highlight a specific challenge for these families. However, it may also indicate that the perspective on people with PIMD and their capabilities is limited: Although challenging, they could still be able to make friends, as long as they receive the proper support (Nijs & Maes, 2014). Second to lowest score was for the support to relieve stress. This is of note, as chronic stress can have serious adverse cognitive and physical health effects (Mariotti, 2015), and may leave parents unable to take care of their family in general and their child with PIMD in particular. Family support may therefore focus on helping families cope with stress, and/or finding possibilities for stress relief, such as respite care.
This study also marks the first time the Beach Center FQOL Scale is used in the Netherlands, providing additional insights into the experiences of Dutch families with a child with a disability of their FQOL. While this was the first study to measure FQOL in the Netherlands, the outcomes of this study may be compared with studies performed in Flanders, which is culturally similar to the Netherlands, and Belgium is also a conservative welfare state (Nugroho, 2018). These studies also show that families are on average satisfied with their FQOL (Steel et al., 2011), and score lowest on emotional well-being (Vanderkerken et al., 2018).
A strength of this study is the high number of siblings included, and is only the second study to have siblings complete the Beach Center FQOL Scale (Vanderkerken et al., 2018). As significant differences between parents and siblings were found, this study contributes to the theorization and conceptualization of FQOL. In addition, the current study used multilevel models to analyze FQOL scores. As the data of this study have a multilevel structure (individuals within families), this type of analysis is more appropriate to use than, for example, a t-test when more than one member from a family unit is included. Future studies should consider using multilevel models to properly analyze FQOL if multiple members from the same family participate.
Limitations
The results of this study should be understood within the following limitations. The Beach Center FQOL Scale, although a valid and widely used instrument to measure FQOL, may not capture the full nuances of the well-being of these families. All questions have equal weight, even though objectively and subjectively, the subject of some questions may weigh more heavily on FQOL than others. However, this does create an objective measurement for all families. Furthermore, the questionnaire does not provide insights as to why respondents were satisfied or not. In-depth interviews with family members can help to better understand the nuances of the (quality of the) lives of these families, what they find important for their well-being, and what their care and support needs are.
As mentioned earlier, it is possible that the study sample is biased and that families who were not satisfied with their FQOL because of various reasons (e.g., lack of spare time, family problems) may not have participated for those exact reasons. While a special effort was made to recruit as many families as possible, the sample size for this type of study was relatively small (possibly due to the COVID-19 pandemic), yet consistent with regard to the prevalence of PIMD. A cut-off age of 30 years (for the person with PIMD) was used in this study for practical reasons (although not supported by the literature); thus, the FQOL of families with a child with PIMD above the age of 30 years could not be determined. Previous studies show that having more than one child with a disability either has no effect on FQOL (Schertz et al., 2016) or leads to a higher FQOL (Patterson et al., 2018), although families in this study were not asked if there were other family members with a disability next to the person with PIMD. The impact of this factor (for these families) could therefore not be determined in this study. The number of siblings was not considered as a variable, and although the additional support for other children may be considered to have an impact on FQOL, previous studies show mixed findings as to if and how the number of children affects FQOL (Luitwieler et al., 2021). More mothers than fathers completed the questionnaire, which is a common problem in studies of this nature (Davys et al., 2017). For most families in this study, it was the mother who signed her family up for the study. While fathers were invited, they may not have felt the same commitment as the mother who signed up for the study. Future studies may look for ways to encourage all family members to complete the questionnaire. Finally, this study took place in the Netherlands, a conservative welfare state with social support for families and affordable health insurance (Nugroho, 2018), which may positively affect FQOL.
Implications
Practice
This study has highlighted the family life aspects that families with a child with PIMD are least satisfied with, and may thus require additional support for. Although further research is needed to understand the specific support needs of these families (e.g., through in-depth interviews), there are already two support aspects that stand out in this study. First, supporting the person with PIMD to make friends should be given additional attention. As some may consider that making friends is hard for people with PIMD, it is possible that this support aspect would not be invested in. However, people with PIMD are able to make friends (Nijs & Maes, 2014), and these friendships may not only raise their QOL, but may also reduce the support needs their family members have to manage. That is, as the informal social network of people with PIMD is small (Kamstra et al., 2015), and they are often reliant on family members, friendships could extend their social network and make them less reliant on family members. Second, more attention should be given to supporting family members to relieve stress. This could happen through health care professionals monitoring how well families are able to relieve stress, and helping them find or create moments of stress relief. Families may also, if needed, be informed and receive support on how they can relieve stress, and how to find balance between work, household tasks, other responsibilities, and leisure time. In addition, families could receive additional financial, material, and social support to relieve stress, such as respite care.
Research
Although it is known that the siblings have a unique perspective on FQOL (Correia & Seabra-Santos, 2021; Moyson & Roeyers, 2012), this study is the first to confirm that siblings also score differently on FQOL. For future studies on FQOL, we therefore recommend to include as many members of a family unit as possible, considering the significant differences that were found. Further insight is needed to understand how and why siblings perceive the FQOL differently, and if this has any impact on family life and the relationship between family members, through questionnaires and/or in-depth (group) interviews. In addition, as no significant effects of several factors (e.g., family income, parental employment) were found in this study, we recommend including more and different factors for future studies. Such factors could include personality traits, personal and/or family beliefs and values, experienced stigmas, and family resilience. Family resilience is especially recommended, as it can help understand from a family systems perspective the differences in how families deal with challenges, such as managing pervasive support needs. Systemic and support factors should be considered as well, as more insight into how these factors affect FQOL is needed (Chiu, 2013; Luitwieler et al., 2021). Interviews with family members may also help to better understand how these families function and why, and what their support needs are. In addition, longitudinal studies may also provide more insight into what factors affect FQOL positively and negatively over time. Finally, this study was the first to measure the FQOL of Dutch families and found they are satisfied with their FQOL, with various variables not affecting FQOL scores. Considering the pervasive support needs of a person with PIMD, and considering the concept of homeostatic control (Cummins, 2015), we expect Dutch families with a child with a different disability to have similarly high FQOL scores. However, additional research is needed to confirm this, and to gain more insights into the impact of various (familial and individual) factors on FQOL in the Netherlands.
Footnotes
Acknowledgements
The authors thank all participants for completing the questionnaires, Nicole van den Dries-Luitwieler for her help in recruiting participants, and Wendy Post for her help with the statistical analyses.
Declaration of Conflicting Interests
The author(s) declared no potential conflicts of interest with respect to the research, authorship, and/or publication of this article.
Funding
The author(s) disclosed receipt of the following financial support for the research, authorship, and/or publication of this article: This study is part of the project “Sterker Samen” (Stronger Together), which is funded by ZonMw (The Netherlands Organisation for Health Research and Development).
Ethical Approval
Ethical permission for this study was granted by the ethical committee of the Department of Pedagogical & Educational Sciences (Ethische Commissie PEDON) after independent review.
Editor-in-Charge: Fred Spooner