
Abstract
Background:
Associations between atmospheric pressure and abdominal aortic aneurysm (AAA) rupture risk have been reported, but empirical evidence is inconclusive and largely derived from studies that did not account for possible nonlinearity, seasonality, and confounding by temperature.
Methods:
Associations between atmospheric pressure and AAA rupture risk were investigated using local meteorological data and a case series of 358 patients admitted to hospital for ruptured AAA during the study period, January 2002 to December 2012. Two analyses were performed—a time series analysis and a case-crossover study.
Results:
Results from the 2 analyses were similar; neither the time series analysis nor the case-crossover study showed a significant association between atmospheric pressure (P = .627 and P = .625, respectively, for mean daily atmospheric pressure) or atmospheric pressure variation (P = .464 and P = .816, respectively, for 24-hour change in mean daily atmospheric pressure) and AAA rupture risk.
Conclusion:
This study failed to support claims that atmospheric pressure causally affects AAA rupture risk. In interpreting our results, one should be aware that the range of atmospheric pressure observed in this study is not representative of the atmospheric pressure to which patients with AAA may be exposed, for example, during air travel or travel to high altitudes in the mountains. Making firm claims regarding these conditions in relation to AAA rupture risk is difficult at best. Furthermore, despite the fact that we used one of the largest case series to date to investigate the effect of atmospheric pressure on AAA rupture risk, it is possible that this study is simply too small to demonstrate a causal link.
Background
Because of the high mortality of ruptured abdominal aortic aneurysm (AAA), both subject-specific and environment-related risk factors have been investigated extensively. Numerous investigators have hypothesized and studied low atmospheric pressure as a risk factor for AAA rupture. 1 This hypothesis is generally predicated on an application of Laplace law, 2 which implies that under equilibrium conditions arterial wall tension is proportional to the product of the radius and the pressure difference between the inside and the outside of the vessel. By itself, this does not immediately implicate a role for aberrant atmospheric pressure in the etiology of AAA rupture, since other factors most likely also affect the difference in pressure or confer protection against the development of critical wall tension. Several investigators have noted the association between atmospheric pressure and arterial blood gas concentrations and postulated changes in the latter as an intermediary in the development of AAA rupture. 2,3 The mechanism by which changes in arterial blood gas concentrations lead to AAA rupture could involve normal physiological responses, possibly modifying arterial wall composition. However, the precise mechanism by which atmospheric pressure affects AAA rupture risk remains to be elucidated.
Empirical evidence is also still inconclusive; some studies have found an association between low atmospheric pressure and the risk of AAA rupture, 2,4 –6 whereas others have not. 1,7 Also, some studies suggest that while absolute atmospheric pressure itself may not serve as a risk factor, AAA rupture may in part be explained by day-to-day variation in air pressure. 1,3 We investigated these associations using approaches that, contrary to previous studies, account for nonlinearity, seasonality, and confounding by temperature.
Methods
Case Series and Meteorological Data
We combined data of daily meteorological readings from the Royal Dutch Meteorological Institute (Koninklijk Nederlands Meteorologisch Instituut) 8 with clinical data from a case series of 358 consecutive patients with a ruptured AAA from the department of vascular surgery of the Medisch Spectrum Twente (MST) from the period January 2002 to December 2012. The MST is a clinical center offering secondary and limited tertiary care and is located in Enschede, in the eastern parts of the Netherlands, at 40 m above sea level. Local climate is warm temperate (C), fully humid (f), and is characterized by warm summers (b); Köppen-Geiger classification Cfb. 9 As exposure variables, we considered (1) mean daily atmospheric pressure, adjusted to sea level; (2) mean atmospheric pressure of the previous day (ie, 1-day lagged); (3) the difference in mean daily atmospheric pressure between 2 consecutive days; (4) the standard deviation (SD) of the mean pressures over the previous 4 days; and (5) the SD over the previous 7 days. The latter 3 are measures of variation in mean daily atmospheric pressure.
Statistical Analysis
We applied 2 approaches—a time series analysis and a case-crossover study. Time series analysis is a method that can be used to study the relation between environmental factors and health outcomes on a population level. 10 In this analysis, data were analyzed per day using a Poisson model with a robust variance estimator. To control for seasonality and confounding by temperature, time (day of year) and mean daily temperature were added to the linear predictor of the analysis model.
In the case-crossover study, for each event occurrence, we compared the exposure on the event day with exposures of nearby referent days. By design, results from this analysis are not biased by differences between subjects nor by confounders that are constant or slowly varying (eg, season-related variables). 11 As recommended by Janes et al, 12,13 we used a time-stratified referent selection scheme, in which the study period is partitioned into fixed strata and referent days are selected from the stratum that contains the event day. We deemed strata defined by month of study to be sufficiently small to control for seasonal variation and selected referent days from the same days of the week as that of the event occurrence to control for possible day-of-week effects, autocorrelation, and carry-over effects between adjacent days. Data were analyzed using conditional logistic regression to account for the fact that the case and control observation come from the same subject. To control for confounding by temperature, daily temperature was added to the linear predictor of the analysis model. Time was not included since the case-crossover design controls for confounding by seasonality by comparing cases with referents from the same season. A concern with case-crossover studies regards time trends in the exposure series. 11 In the presence of systematic exposure changes, selecting referents only before the event day may introduce bias. On the other hand, bidirectional sampling is valid only when cases are at risk of sustaining an event both before and after the actual event. With the event being defined as (hospital admission for) ruptured AAA, this assumption is evidently violated. However, with rare events, the bias from selecting referents outside of the at-risk period is typically small and outweighed by the bias inherent to unidirectional referent schemes. 13,14
To accommodate potential violations of linearity, we used restricted cubic splines, piecewise polynomial functions subject to continuity constraints, to characterize the relations between AAA rupture risk on the one hand and atmospheric pressure and other variables included in the analysis model on the other hand. 15 –17 For each independent variable, we used 4 knots (ie, join points of the polynomial pieces), so that per variable 2 additional variables were added to the model. 18 Knot locations were equally spaced (on the quantile scale) between the 5th and 95th percentiles of the independent variable distribution used in the analysis. We assessed the robustness of our results against changes in quantity and locations of knots.
Relative risks and pointwise 95% confidence intervals (CIs), relative to mean exposure levels, were derived from model estimates, and overall and nonlinear trends were assessed using likelihood ratio tests at a 5% significance level. All statistical analyses were performed using R 19 version 3.1.1.
Results
An overview of local atmospheric conditions over the study period is shown in Table 1 and Figure 1. Daily atmospheric pressure ranged from 97.4 to 104.6 kPa over the study period and was subject to greater variability in winters as compared with summers. On average, atmospheric pressures remained approximately constant across seasons.
Summary of Local Atmospheric Conditions Over the Study Period January 2002 to December 2012.
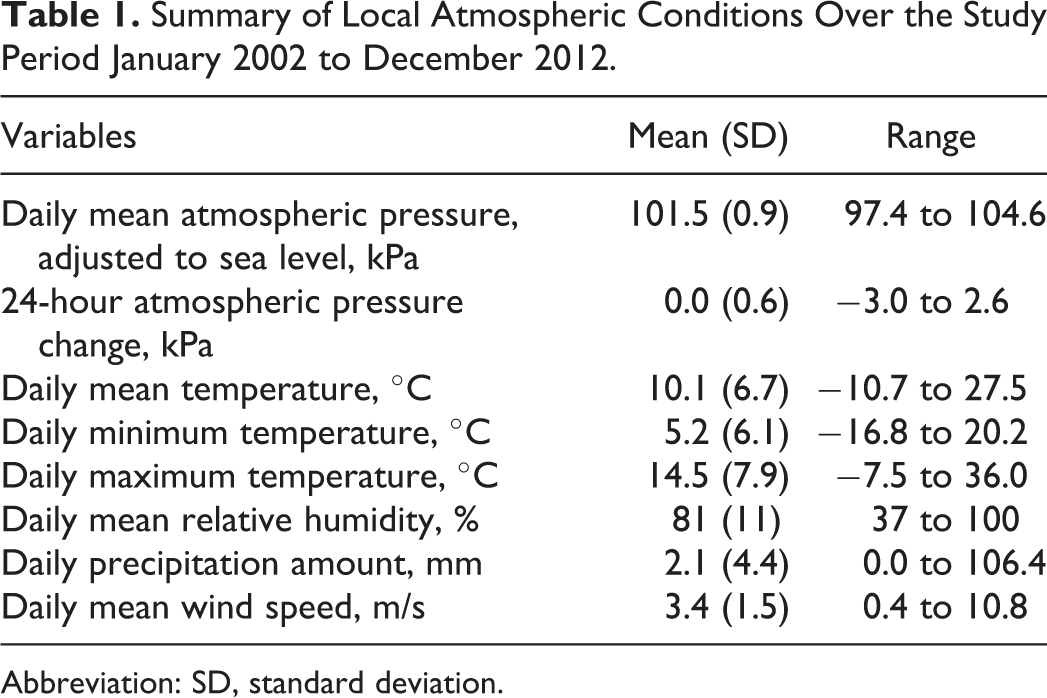
Abbreviation: SD, standard deviation.
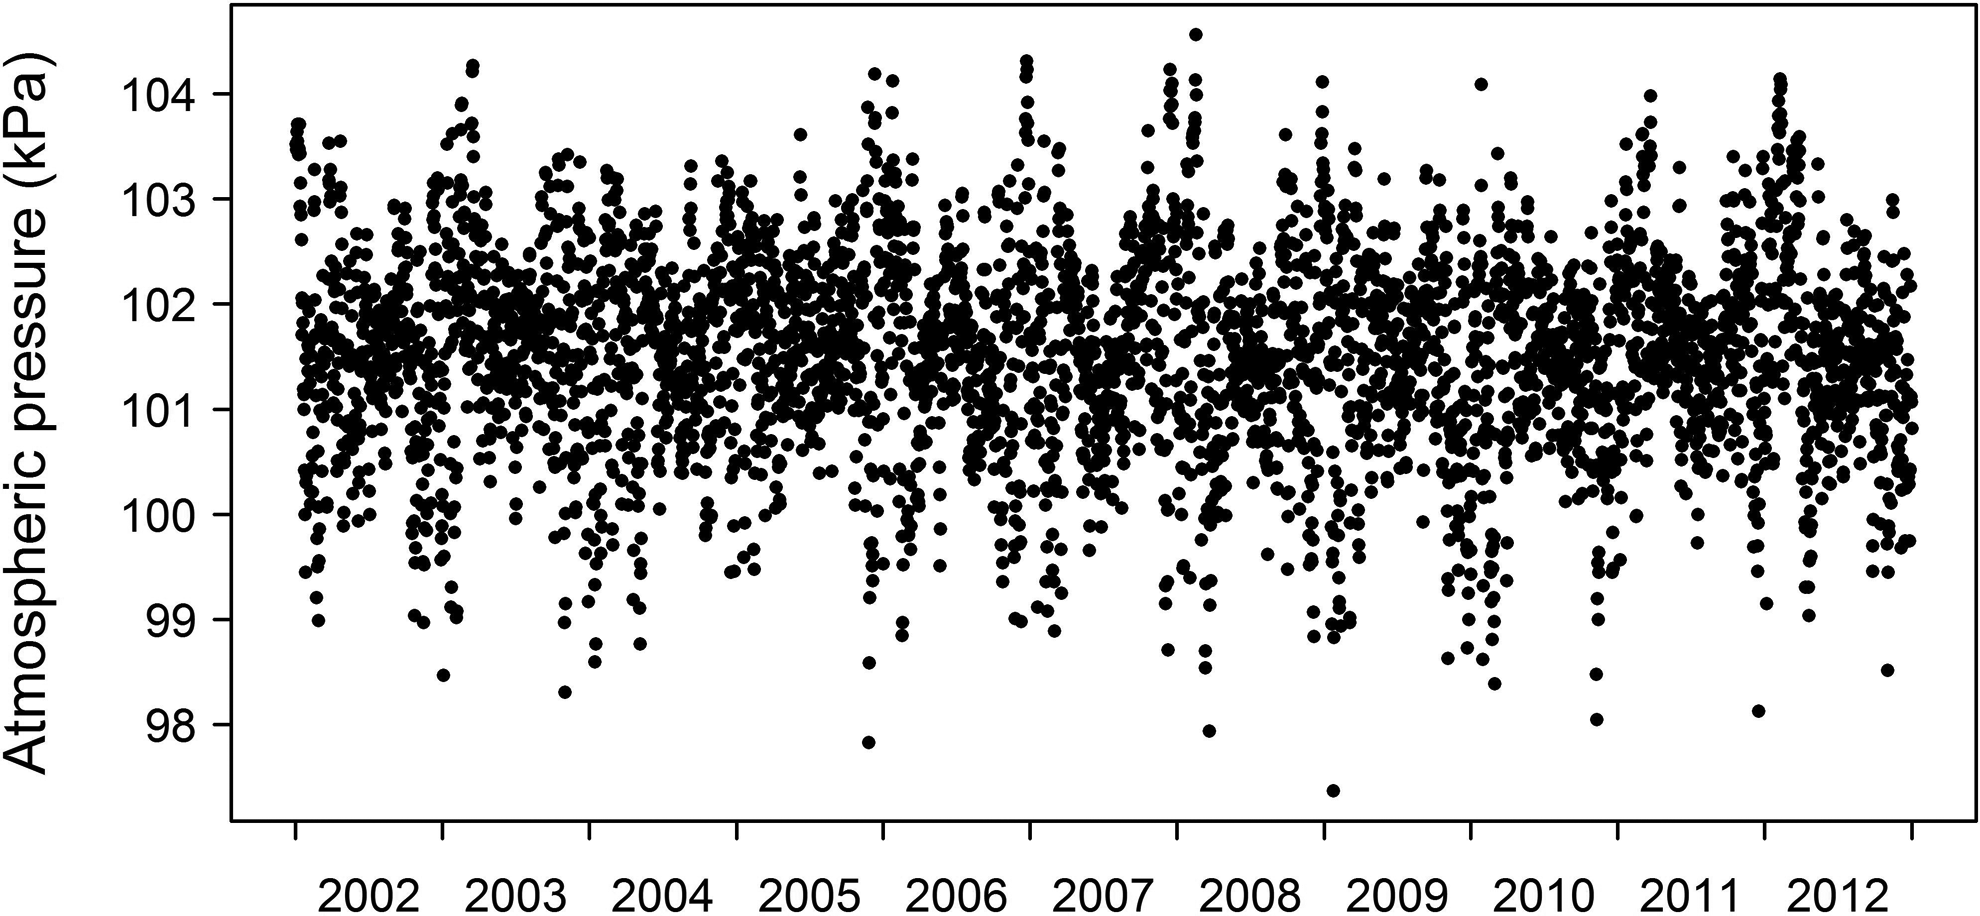
Local daily mean atmospheric pressure readings for all days in the study period January 2002 to December 2012.
The case series consisted of 358 hospital admissions for ruptured AAA. A summary of patient characteristics according to our database is shown in Table 2. On day 1, 3 patients were admitted to the hospital, on day 12, 2 ruptures occurred, and on any other day during the study period, at most 1 patient was admitted. The incidence of ruptured AAA showed seasonal variation, with higher incidences observed in winter (97) and autumn (105) than in spring (77) and summer (79). There were 288 (80.4%) male and 70 (19.6%) female patients. Mean age was 71.4 (SD, 9.6). As per preoperative computed tomography, 217 patients (93.9% among those 231 patients with available data; 60.6% among all patients) had an aneurysm diameter of at least 55 mm.
Summary of Patient Characteristics.
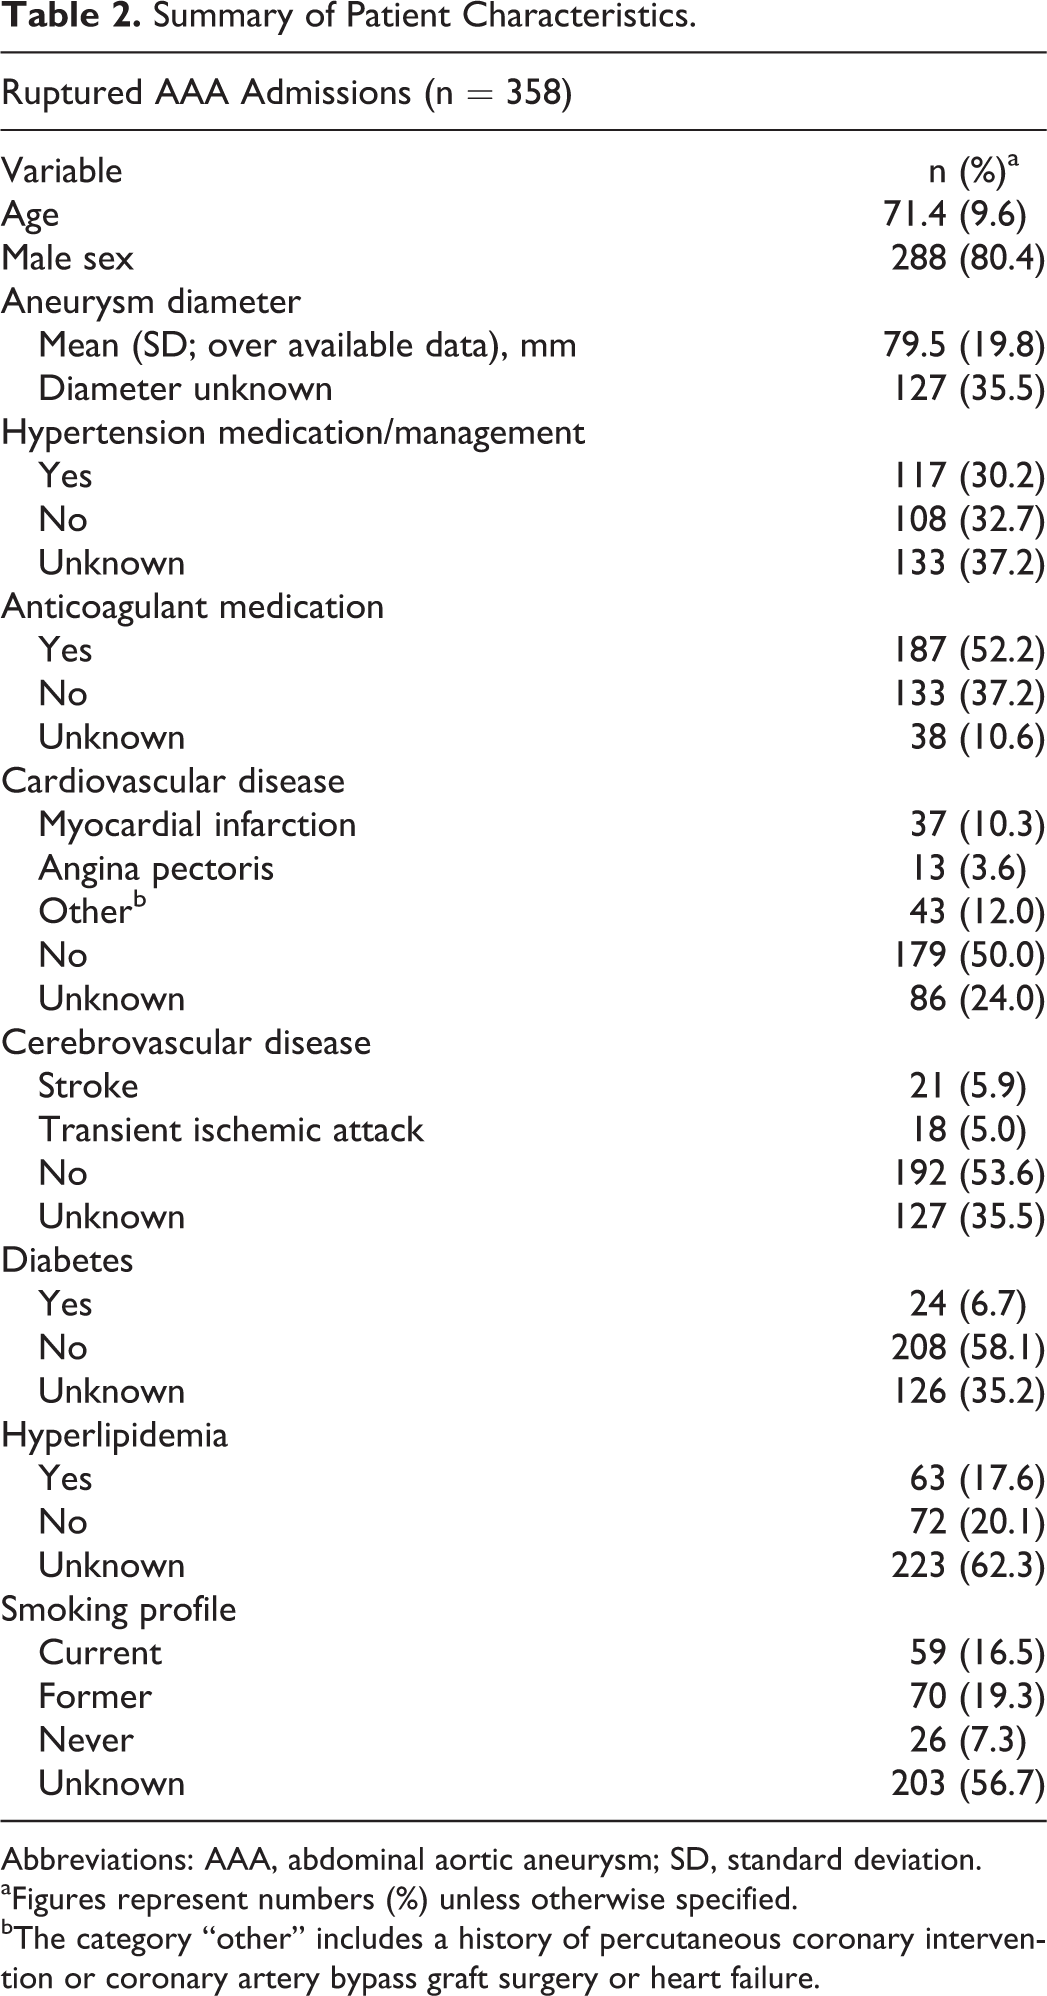
Abbreviations: AAA, abdominal aortic aneurysm; SD, standard deviation.
aFigures represent numbers (%) unless otherwise specified.
bThe category “other” includes a history of percutaneous coronary intervention or coronary artery bypass graft surgery or heart failure.
Results from the time series analysis and case-crossover study (Figures 2 and 3) do not show an association between atmospheric pressure or variation in air pressure and AAA rupture risk. Overall and nonlinear trends were all nonsignificant and 95% CIs large, covering relative risks on both sides of the null.
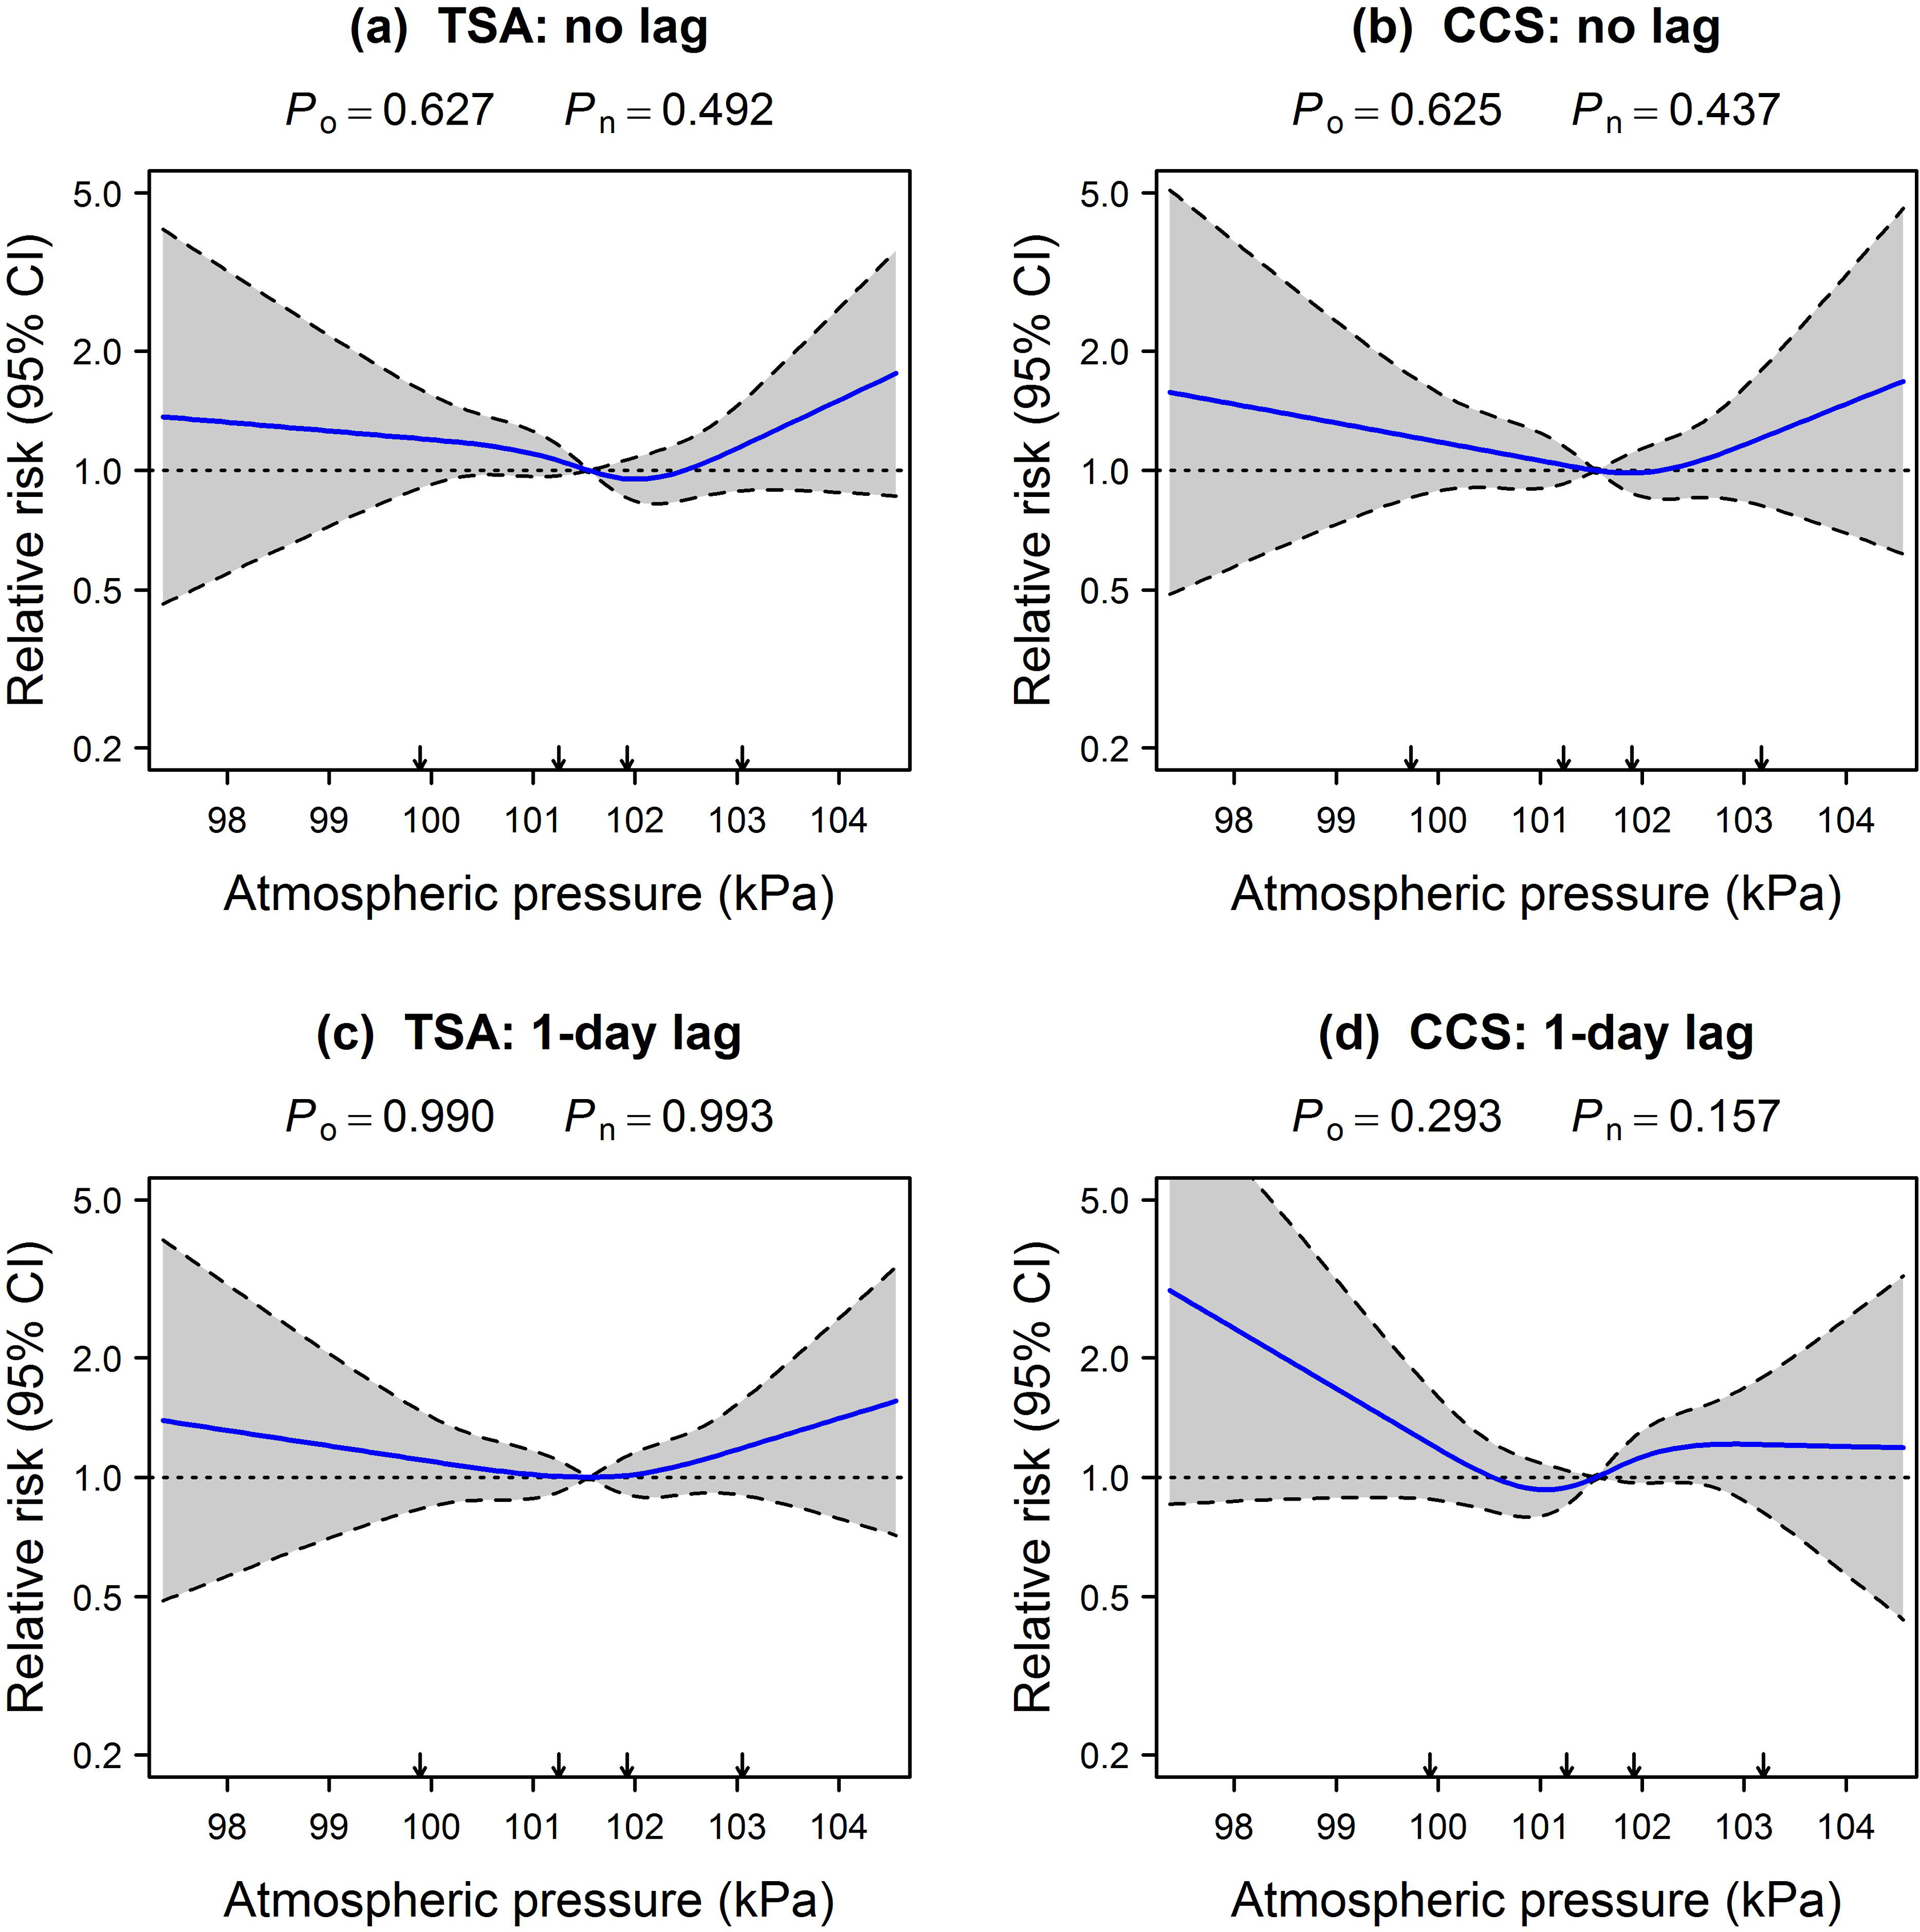
Associations between atmospheric pressure and ruptured AAA according to the time series analysis (left column) and case-crossover study (right column). Solid lines indicate estimated relative risks. Relative risks and 95% CIs are indicated by solid lines and shaded bands (boundaries, dashed lines), respectively. Relative risks (displayed on log scale) are relative to study period mean exposure level. Arrows indicate splines knot placements. AAA, abdominal aortic aneurysm; CCS, case-crossover study; CI, confidence interval; P n, likelihood ratio test P value for nonlinear part; P o, likelihood ratio test P value for overall association; TSA, time series analysis.
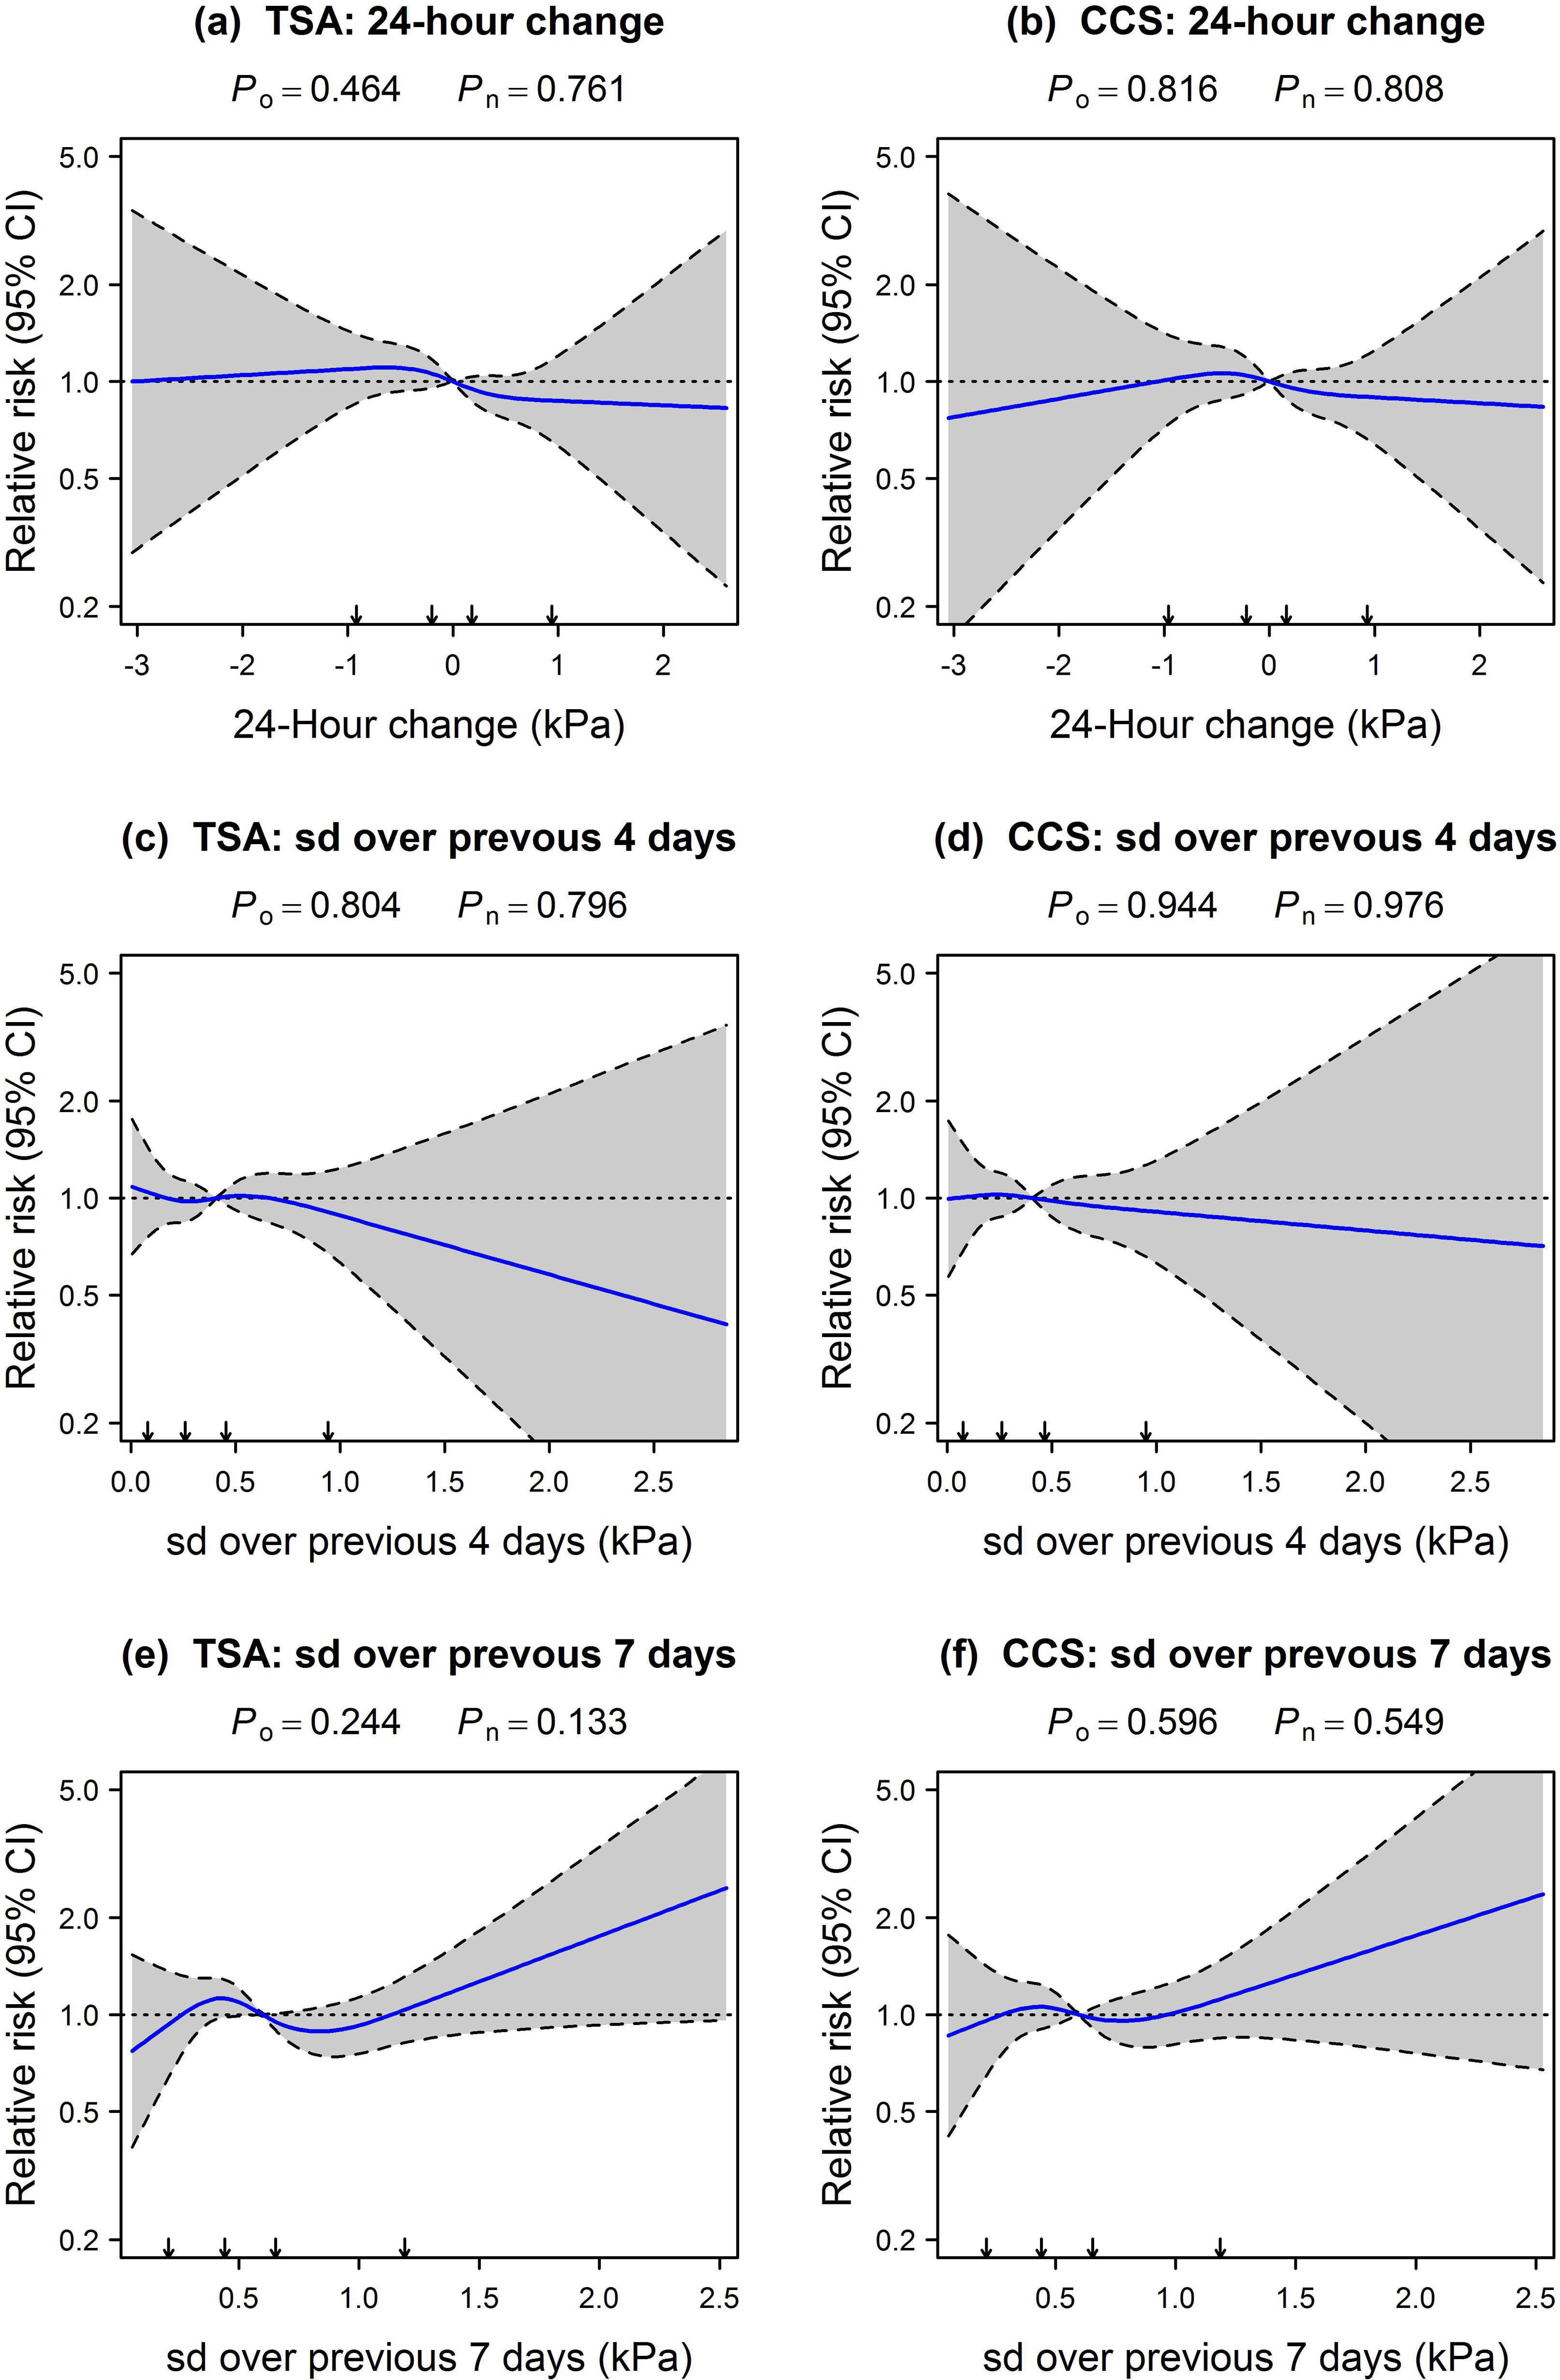
Associations between atmospheric pressure variation and ruptured AAA according to the time series analysis (left column) and case-crossover study (right column). Solid lines indicate estimated relative risks. Relative risks and 95% CIs are indicated by solid lines and shaded bands (boundaries, dashed lines), respectively. Relative risks (displayed on log scale) are relative to study period mean exposure level. Arrows indicate splines knot placements. AAA, abdominal aortic aneurysm; CCS, case-crossover study; CI, confidence interval; P n, likelihood ratio test P value for nonlinear part; P o, likelihood ratio test P value for overall association; SD, standard deviation; TSA, time-series analysis.
A U-shaped association is apparent between (1-day lagged) atmospheric pressure and AAA rupture risk—compared to mean atmospheric pressure (101.5 kPa), the risk was increased, albeit not significantly, at other levels (Figure 2A and B; 2C and D for 1-day lagged atmospheric pressure). However, upon increasing the number of knots, this U-shaped association disappeared (data not shown), suggesting this pattern to be an artefact of the data. The same holds for the reverse U-shaped relation between 24-hour change in atmospheric pressure and AAA rupture risk (Figure 3A and B). A weak inverse relation between AAA rupture risk and the SD in atmospheric pressure over the previous 4 days is apparent as shown in Figure 3C and D. Conversely, variability over the previous 7 days tended to increase AAA rupture risk. However, neither trend was statistically significant.
As sensitivity analyses, besides assessing the impact of different knot numbers and locations, we also varied the number of days over which to calculate the variation (eg, SD) of atmospheric pressure and evaluated the impact of greater lag times by shifting the number of measurements of air pressure by a number of days. None of these largely impacted our results.
Discussion
Evidence on the extent to which atmospheric pressure affects AAA rupture risk is inconclusive. Studies on this topic are constructed differently, making it difficult to draw firm conclusions. Most studies, however, did not account for possible nonlinearity, seasonality, and confounding by temperature. In the present study, we sought to investigate the relation between atmospheric pressure and the risk of AAA rupture using a relatively large cases series and approaches that address these issues. Neither of these approaches showed a clear relation.
In the present study, the incidence of ruptured AAA showed seasonal variation, with higher incidences during winter and autumn. Such seasonal variation is well documented 1 –6 and needs to be accounted for when making causal inferences about the association between atmospheric pressure and AAA rupture risk. Observing that both exposure and the incidence of AAA rupture are dominated by seasonal patterns is not sufficient to establish causality. Many variables (eg, life style factors such as vigorous exercise) possibly share similar patterns, inducing correlations that potentially confound the observed relation between atmospheric pressure and the risk of AAA rupture. It is therefore necessary to correct for such seasonality, for example, explicitly by including time variables in the Poisson model of a time series analysis or by selecting control days relatively close to the day of the rupture in the design of a case-crossover study.
Results from our study appear robust, given that different study designs and several sensitivity analyses yielded similar relative risk estimates. A potential limitation, however, is that we only adjusted for unlagged daily temperature readings and seasonality in the analyses and unmeasured confounding (eg, by other meteorological variables) cannot be excluded.
In interpreting our results, one should be aware that the range of atmospheric pressure (variation) observed in this study is not representative of the (variation in) atmospheric pressure to which patients with AAA may be exposed, for example, during air travel or travel to high altitudes in the mountains. For comparison, the equivalent effective aircraft cabin altitude typically varies between ground level (sea level atmospheric pressure) and a maximum of 8000 ft, amounting to 75 kPa. 20,21 Extrapolating our results to these high-altitude conditions is problematic. Therefore, making firm claims regarding the safety of commercial airline flights or travelling to high altitudes difficult at best. Furthermore, despite the fact that we used one of the largest case series to date to investigate the effect of atmospheric pressure on AAA rupture risk, it is possible that this study is simply too small to demonstrate a causal link.
In summary, associations between atmospheric pressure (variation) and AAA rupture risk have been reported, but empirical evidence is inconclusive and largely derived from studies that did not account for possible nonlinearity, seasonality, and confounding by temperature. The present study sought to address these issues, and its results do not substantiate a causal association.
Footnotes
Declaration of Conflicting Interests
The author(s) declared no potential conflicts of interest with respect to the research, authorship, and/or publication of this article.
Funding
The author(s) disclosed receipt of the following financial support for the research, authorship, and/or publication of this article: RHHG was funded by the Netherlands Organization for Scientific Research (NWO-Vidi project 917.16.430). The views expressed in this paper are those of the authors and not necessarily any funding body.