



Abstract
In empirical work, researchers frequently test hypotheses of parallel form in several regressions, which raises concerns about multiple testing. One way to address the multiple-testing issue is to jointly test the hypotheses (for example, Pei, Pischke, and Schwandt [2019, Journal of Business & Economic Statistics 37: 205–216] and Lee and Lemieux [2010, Journal of Economic Literature 48: 281–355]). While the existing commands
1 Introduction
In empirical work, researchers often test hypotheses of parallel form in several regressions. Examples are regression-based balancing tests for multiple independent variables (for example, following Lee and Lemieux [2010] and Pei, Pischke, and Schwandt [2019]) as well as studies that examine the relationships between multiple dependent variables and the same set of independent variables. Numerous researchers, including Lee and Lemieux and Pei, Pischke, and Schwandt, point out the need for joint testing across regression equations in such settings; otherwise, statistical inference may be invalid due to the multiple-comparisons problem. However, independently testing numerous parallel hypotheses without taking multiple-testing issues into account seems to still be common in applied research; see, for instance, the discussions in Anderson (2008) and List, Shaikh, and Xu (2019).
The Stata command
In this article, we introduce
In essence,
Section 2 sketches the underlying econometric idea. Section 3 explains
2 Stacked regression analysis
Consider a set of G regressions, where the dependent variables y
1
i,…, yGi
are regressed on the same set of independent variables

This description accommodates a wide range of applications. Examples include balancing tests of covariates in experiments (with
One alternative way to adjust statistical inference is to jointly estimate the regression equations in (1). Stacking the G regressions is a conceptually simple approach to estimate the regressions jointly (described in, for example, Wooldridge [2010, 166–173]). Using this approach, the statistical inference can account for possible crossequation correlations of the errors εg
without imposing additional structure. Defining

the stacked regression reads

The stacked regression (2) mechanically gives regression coefficients that are identical to those from the separate regressions in (1). By clustering standard errors and adjusting the degrees of freedom (explained in more detail in section 3.4), the stacked regression additionally yields identical standard errors for the regression coefficients and still allows for joint testing of hypotheses across equations. The next section describes how
3 Implementation in Stata
The core of the stacked regression procedure is temporarily reshaping the estimation sample from wide format to long format using
3.1 Panel data and fixed-effects estimation
3.2 Higher-level and multiway clustering
Cluster–robust variance–covariance matrix estimation is a key feature of
3.3 Constrained estimation
3.4 Degrees-of-freedom adjustment
Things get more involved if the estimation samples are heterogeneous across the dependent variables
5
or if restrictions are imposed on the coefficients; see section 3.3. In these cases, different adjustment factors must be applied to the different equations. For this reason, the initially estimated variance–covariance matrix is not adjusted by a single scalar factor but is adjusted element by element. The element-specific adjustment factors are
3.5 Comparison to existing Stata commands
Finally, combining Stata’s data management tool
4 The stackreg and xtstackreg commands
4.1 Syntax
The syntax for
depvars specifies the list of outcome variables, and indepvars specifies the list of explanatory variables. Factor variables are allowed in both indepvars and depvars; see [U]
4.2 Options
For
The different estimation commands that are alternatively called by
display_options:
4.3 Stored results

4.4 stackreg postestimation
Using postestimation commands after
5 Applications
In this section, we present two applications of
5.1 The persistent effects of Peru’s mining Mita
To illustrate the application of

Using a spatial regression discontinuity approach, Dell (2010) examines the long-run effects of a forced mining system in Peru and Bolivia, called Mita, that was in place in a clearly defined geographical area between 1573 and 1812. We focus on the regressions for which results are reported in table V, panel A, columns 6–8 (Dell 2010, 1886). Before carrying out the empirical analysis, some data preparation steps are necessary irrespective of

As a regression-based balancing check, Dell (2010) examines whether the population composition differed between Mita regions and control regions before Mita came into force. Specifically, Dell regresses the population shares of men, boys, and females (

We next use


Finally, after running
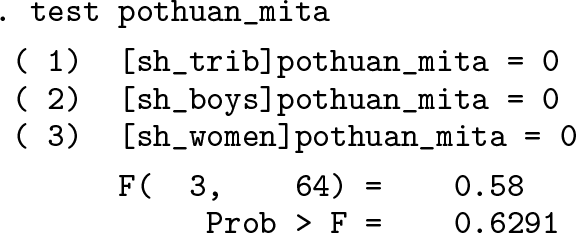
The output from
5.2 One Mandarin benefits the whole clan
We next illustrate additional features of
Do, Nguyen, and Tran (2017b) examine how the promotion of Vietnamese officials affects their hometowns. In their table 3 (Do, Nguyen, and Tran 2017b, 18), which we will focus on, the authors present results for six different dependent variables, three of which measure infrastructure investments (
Together with data-preparation steps, we run the original regressions quietly in

Then we use


We can now perform a joint test of whether power capital is related to any of the outcome variables by using

Though tests on individual significance suggest that officials’ hometowns benefited in terms of higher investment in productive (
In this setting, multiway clustering may be an attractive alternative, say, because error terms are not only related within communes across years but also in each year across communes.
22
To use multiway clustering, we list the varlist of clustering variables as arguments in

After rerunning

6 Conclusions
In this article, we introduced the
8 Programs and supplemental materials
Supplemental Material, sj-zip-1-stj-10.1177_1536867X211025801 - Stacked linear regression analysis to facilitate testing of hypotheses across OLS regressions
Supplemental Material, sj-zip-1-stj-10.1177_1536867X211025801 for Stacked linear regression analysis to facilitate testing of hypotheses across OLS regressions by Michael Oberfichtner and Harald Tauchmann in The Stata Journal
Footnotes
7 Acknowledgments
We would like to thank Julia Lang, Johannes Ludsteck, Sabrina Schubert, and an anonymous reviewer for many valuable comments and suggestions. Excellent research assistance from Irina Simankova is gratefully acknowledged.
8 Programs and supplemental materials
To install a snapshot of the corresponding software files as they existed at the time of publication of this article, type
Notes
References
Supplementary Material
Please find the following supplemental material available below.
For Open Access articles published under a Creative Commons License, all supplemental material carries the same license as the article it is associated with.
For non-Open Access articles published, all supplemental material carries a non-exclusive license, and permission requests for re-use of supplemental material or any part of supplemental material shall be sent directly to the copyright owner as specified in the copyright notice associated with the article.
