
Abstract
Whether a variable is in fact constant—so that it takes on exactly the same value in different observations—is of common concern in statistical work. The question may arise for all the observations in a dataset or for different subsets of the dataset. It may arise because constancy is desirable or because constancy is undesirable, but either way we often need to check simply and quickly. In this column, I discuss several methods for checking. I do not claim to offer a complete analysis of why you might or should care but will give examples arising from experience.
Keywords
1 Introduction
Stata’s main data model consists of observations (rows, cases, or records in other terminology) and variables (columns, features, or fields). Despite their name, reflecting lengthy statistical theory and practice, variables in Stata sometimes are, or at least should be, constant in value, either in an entire dataset or in subsets of observations. In this column, I discuss how to check for constancy, or its converse, variability.
The problem of checking for constancy overlaps with that of finding duplicate observations, as tackled by the
to find the latest update at the time of reading. Note that some people say “unique” rather than “distinct”.
2 Constant across the entire dataset?
Let us start with wanting to check whether a variable is constant across the entire dataset.
The larger context often runs that variables that are constant are not useful. Sometimes, they are just uninformative, period, as when data imported from a spreadsheet include variables that are entirely missing, because the corresponding columns were empty. Sometimes, they have meaning, but, given that they are constant, they cannot be used in modeling, either as outcome or response variables, or as predictor or explanatory variables. If you want to use gender as a predictor, but all your data are for one gender, that will not work. So, for some purposes, such variables should certainly be identified and perhaps even
That isn’t always true. In some projects, there are multiple data files, and it can be essential to have an identifier defining each file before they are combined (which here usually means
To make this all concrete, I provide here a sample sandbox dataset with two numeric variables and two string variables.

Numeric variable
2.1 Numeric variables first: The role of summarize and assert
First, consider the case of numeric variables.
After any introduction to Stata, users are likely to suggest this idea for any numeric variable:
Let’s run through the details. Assume that numeric variable
Evidently, the difference between the maximum and minimum, namely, the range, should be zero if the variable is constant.
Aside: r-class results, such as
The
Calculating the range is an easy task. So is spotting by eye after
With
Note the double equals sign,
You can test the converse of any hypothesis too. Usually, the way to think is: What should be true, so that we need to know about exceptions?
If the concern is to identify variables that are genuinely variable, then a convenient formulation uses
Here the idea is that the maximum should differ from the minimum, so it is departure from the state of inequality that will produce a flag.
2.2 What about missing values? And string variables?
We need now to face up to some complications that can bite. First,
Here the analysis branches naturally. If you do not care about missing values, then you will not care that
Many graphical, data management, and statistical commands automatically ignore missing values in any case, so in that sense they need not be an immediate problem.
Alternatively, if you do care about missing values, then explicit checks may be a good idea.
Second, a further complication that can bite is the existence of string variables. Many datasets include at least one string variable, commonly for holding information about identifiers. Some datasets hold many more string variables.
Ideally, data management methods work uniformly, or at least similarly, for numeric and string variables alike. Will the
A further fact, whether a limitation or an irrelevance: strings that are one or more spaces are not equal to empty strings. leading or trailing spaces are used in comparisons of equality or inequality, so the character yielded by
The remedy for problems 1 and 2 is to clean up string variables using the
That said, what

Although
The logic is that it is legal to refer to r-class results that do not exist: Stata just declares that those results are missing. As neither
Note the result, the display of a single period representing system missing, Stata’s default numeric missing value. Stata’s attitude is that it does not know any value for
The bridge between what exists (ontology) and what is known (epistemology) is long, fragile, and dangerous. Here Stata is playing epistemologist, or more plainly saying: I don’t know.
Stata jumps the other way if you name a variable that does not exist (which usually means that you get a variable name wrong, but either description can be correct). Stata is always confident about what variables are in memory in the current dataset, so the result is not an empty result but an error message.
So we need some caution about using
There is more juice to be squeezed out of the ideas so far. Consider this code for some puzzling variable:
The assertion is that all values of
A merit of that last line of code is that it applies to string variables as well as numeric variables. But once again the question arises: What about missing values? The code will certainly catch any variable that is missing in the same way for all observations. Missing in the same way only ever means empty strings for string variables. But missing in the same way means all values being either system missing,
To keep matters concrete, let us add another observation to the sandbox with missing values.

In our particular example, increasing the number of observations implies directly that values in the new observations are born as missing, but the code above spells out what the missing values are (what they are already, which is why there are reports of 0 real changes made).
Here is a way forward when that is not quite what you want. Focus first on the case of
then any missing values are sorted to the end of the dataset. That applies both to system missing values, represented by a period,
allows two possibilities, being equal to the first value or being missing. The function
If there are, contrary to expectation, rogue values such as 999 lurking in the data, the hypothesis will be false. The test will fail for
By the way, if you wanted to write code precisely tailored to the expectation, such as
that would be clear and to the point. It just would not be so general in application.
Focus now on the case of string variables. We can use almost the same idea, but empty strings always sort to the beginning of the dataset. So,
is the kind of variation needed. Again, what it checks is that all nonmissing values present are equal to each other, including the boundary case in which there are no nonmissing values; and further, that values may be missing. Otherwise put,
2.3 Tabulations
By focusing (fixating?) on the use of
It is clear enough from the results of
This is all fine for a small dataset, meaning now one with just a few variables. For a larger dataset, you do not want to be committed to looking through many tables, which is likely to prove tedious, time consuming, and error prone. Rescue from this dilemma comes from the saved result
2.4 Several variables
Let us now extend the problem to checking a bundle of variables for constancy while keeping an eye open for the possible occurrence of missing values.
An implication of the last subsection is that it may be prudent to segregate numeric and string variables and treat them separately. If missing values were not an issue, this loop would work either way:
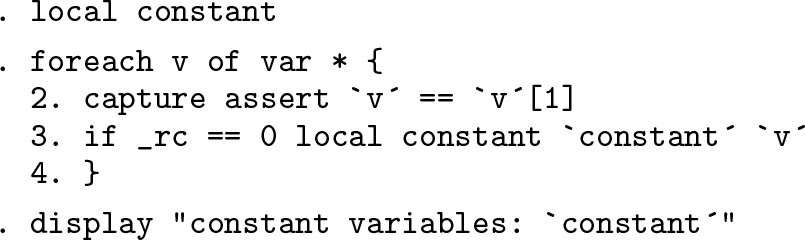
The steps here are
clear any local macro called loop over all variables. The loop here uses test that all values of each variable are equal to the first value, so equal to each other. Each test will return true or false. A true result is followed by silence (no output), but a false result would produce an error message and would stop the loop. Putting exit the loop, and
This loop would also work to detect constants if missing values were not an issue:

Note the prefix
You may be familiar with
This loop is also available as part of the functionality of
For the latest implementation of the command,
For a loop for numeric variables, which allows numeric missing values as well as constant numeric nonmissing values, we could use

If you have been following carefully, you should now be able to write code to find string variables, allowing string missing values as well as constant string nonmissing values. You are allowed to check the syntax of
If you are energetic enough to want an exercise, you might consider adapting the loop over
3 Constant within subsets of the dataset?
We have saved for last one of the most common variants of the question, which is about subsets of the data. This variant arises particularly with panel or longitudinal data, in which again constancy on some variable may be desirable or undesirable, interesting or not, useful or not.
A common variant is that data come in groups of observations, one group for each family or household. Typically, a variable is specified for only one person, but it makes sense to spread that nonmissing value to other people in the same family or household. So the cautious check needed is that there is no variation in the nonmissing value in each group.
An immediate general answer is to reach for the prefix command
This is easy but not nearly so useful as seen earlier, because the command will not give panel-by-panel results. A loop over panels is in practice not especially helpful either. People with many, many panels in particular usually want more than a long list of panels that satisfy some criterion.
The most useful technique is to calculate an indicator or dummy variable. For a recent overview of technique with such variables, see Cox and Schechter (2019). An indicator allows us to keep all the information in the data on constancy or difference. One line does most of the required work, such as
or (according to taste or convenience)
In the first, all the observations in each panel are 1 if all the values of
If missing values contaminate the data, there are various ways forward, including application of the ideas in section 2.3. But perhaps cleanest of all is to segregate missing values as a separate issue. There are many small variations on this method, but this code should give the flavor.

An indicator variable has several advantages and makes data management, graphics, and modeling easier. For example, suppose only panels with variation and only nonmissing values are of use. Then,
selects observations accordingly. For examples and more discussion, see Cox (2001).
4 Conclusion
Focusing on which variables are constant in the data has as its complement, focusing on which variables are genuinely variable. The emphasis in this column has been to underline
the need to care about numeric and string variables—which may or may not require separate treatment. the need to worry, at least initially, about what any missing values present imply for your purpose. the scope for applying existing commands in a simple way, with at most a few extra constructs such as loops or use of prefix commands, which are all key Stata techniques in any case.