
Abstract
In this article, I introduce the
Keywords
1 Introduction
Although most patients leave the doctor’s office with a medication prescription, many fail to take their medication as prescribed. According to the World Health Organization, medication adherence (also referred to as compliance) rates in developed countries average only about 50% (Sabaté 2003), and even patients in closely monitored clinical trials have been reported to maintain adherence rates of only 43% to 78% (Osterberg and Blaschke 2005). Given its association with increased morbidity, mortality, health services use, and cost (Psaty et al. 1990; Rasmussen, Chong, and Alter 2007; Kulkarni et al. 2008; Linden and Adler-Milstein 2008; Sokol et al. 2005; Dragomir et al. 2010; Roebuck et al. 2011), medication nonadherence is a major concern to practitioners, payers, and policy makers alike. Accordingly, measuring adherence is an essential component of any strategy to improve clinical outcomes using pharmacotherapy.
Over the past two decades, administrative pharmacy claims have increasingly been used as a data source for measuring medication adherence under the assumption that filling (and refilling) a prescription is consistent with taking the medication as directed. Adherence measures derived from administrative data are appealing because they are convenient, objective, noninvasive, and cost effective for use in large populations (Steiner and Prochazka 1997; Osterberg and Blaschke 2005; Hess et al. 2006). Two of the most widely used adherence measures reported in the literature are the medication possession ratio (MPR) and the proportion of days covered (PDC) (see below for descriptions) (Andrade et al. 2006; Cramer et al. 2008; McMahon et al. 2011; Sattler, Lee, and Perri 2013; Lam and Fresco 2015). The Centers for Medicare & Medicaid Services currently reports PDC rates for diabetes, hypertension, and cholesterol drugs as part of the annual star rating system that measures the quality of care received by beneficiaries enrolled in Medicare Advantage Plans (managed care) and Prescription Drug Plans (Centers for Medicare & Medicaid Services 2018).
In this article, I introduce the new
2 Methods
The computation of any pharmacy claims–based adherence measure requires patientlevel records captured over a particular time interval. Patient-level information includes the dates on which the prescriptions were filled and the number of days of supply for the medication (for example, 60 pills to be consumed twice per day for 30 days). These variables are used to calculate the amount of medication patients have on hand over the course of a given study period. The two most common methods investigators use to set the study period are a fixed date range (for example, January 1, 2017 to December 31, 2017) or a variable study period, in which each patient’s follow-up period is allowed to vary within a set time interval (for example, 180 days from each patient’s first prescription fill). As described in the following sections, MPR and PDC use these date elements somewhat differently for computing adherence rates.
2.1 Medication Possession Ratio
The MPR is generally defined as a ratio of the total days of available supply (of a medication) to the number of days in a specified study period (Steiner and Prochazka 1997). As an example, table 1 presents pharmacy data for a patient who filled her prescription seven times between December 30, 2012 and June 27, 2013. To illustrate the computation of MPR for a fixed study period, let us assume the study seeks to compute her MPR between January 1, 2013 and June 29, 2013 (180 days, inclusive).
Example pharmacy fill data for a single patient
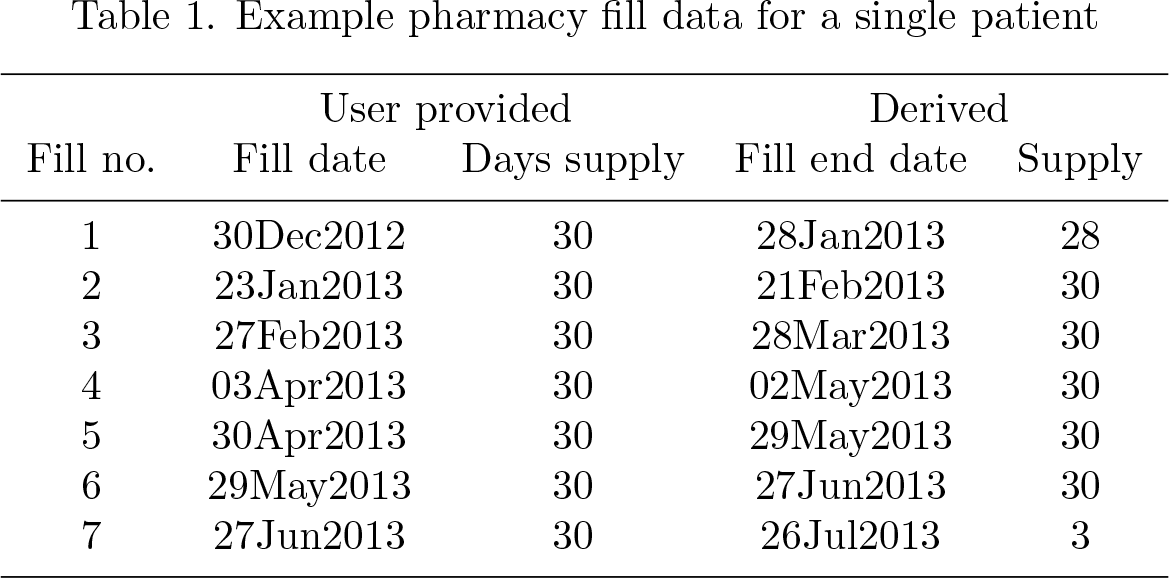
As shown, only 28 days of supply (out of 30) are counted from the first fill because 2 days of supply are from before the study start date (January 1, 2013). Similarly, only 3 days of supply are counted in the seventh fill because the remaining days of supply are beyond the study end date (June 29, 2013). Thus, the MPR is computed as the sum of supply (181) divided by the number of days in the study period (180), which in this case equals 1.01. However, note that there is more medication on hand than days in the study period (181 versus 180) because both the second and fifth refills were obtained earlier than when the supply of the previous refill was exhausted. This issue highlights a limitation of the MPR: it can overestimate adherence if patients regularly refill their prescriptions early or if they switch medications before consuming all the prior supply. Some investigators handle this problem by capping the adherence rate at 1.00 (Hess et al. 2006).
2.2 Proportion of days covered
The PDC is generally defined as the number of days in which the patient has the medication available divided by the number of days in a specified study period (Benner et al. 2002). In contrast with MPR, which sums the total supply of medication available, PDC sums the number of days in which the medication is available. More specifically, each day is categorized as either 1 or 0 representing whether the patient had medication available on that day or not, respectively.
Table 2 illustrates how the daily supply is quantified for the PDC calculation when there are either overlapping days of supply or no supply available. The first seven observations highlight the overlapping days of medication supply from January 23rd to January 29th for the patient data presented in table 1. Here the supply equals 1, even though the patient actually had more medication on hand for those days because they refilled the prescription early. The next six observations (February 22nd to February 26th) highlight days in which no supply was available and therefore are coded as 0. On February 27th, the patient refilled her prescription, and therefore a value of 1 is assigned to that day’s supply.
Quantifying daily supply for the PDC calculation using the patient data in table 1

Using the same study period as in the MPR example above (January 1, 2013 through June 29, 2013), the sum of the number of days in which the medication is available is 170. As such, the PDC is 0.94 (170/180), which is more conservative than the 1.01 derived using the MPR.
A modification to the PDC can be implemented that involves shifting refill dates forward to the day after the supply of medication is exhausted. This procedure essentially credits the patient for having additional supply on hand (due to early refilling). Table 3 illustrates how the original fill dates and fill end dates (from table 1) are modified to separate overlapping days of supply. For example, whereas the second medication fill originally occurred on January 23rd (five days before the existing supply was exhausted), the modified refill date has been shifted forward to the day after that refill was exhausted (January 29th). Because of this shift, the supply for this second refill is now exhausted on February 27th rather than on the original date (February 21st). All other subsequent overlapping refill periods are shifted forward accordingly. Note that shifting is only correct when all data are known and does not credit dispensed medication before the study period or when it is unavailable.
Modifying the original fill dates (from table 1) to credit the patient for additional supply

Using this modification while retaining the same study period as the previous examples (January 1, 2013 through June 29, 2013), the sum of the number of days in which the medication is available is 176. Thus, the PDC is now 0.98 (176/180), which lies somewhere between the values derived for the MPR and the basic PDC (1.01 and 0.94, respectively).
3 The medadhere command
This section describes the syntax of the
3.1 Syntax
fill_date is the date when the prescription was filled, and days_supply is the number of days that the medication was intended to last (for example, if one has 60 tablets and should take a tablet twice per day for 30 days, days_supply is
3.2 Options
3.3 Data generated by medadhere
Variables that replace the data in memory when

The
4 Examples
The
4.1 A single patient on a single medication
In this example, we assume there is only one patient in the dataset. First, we load
If the data are for a single patient on a single medication, we do not need to specify
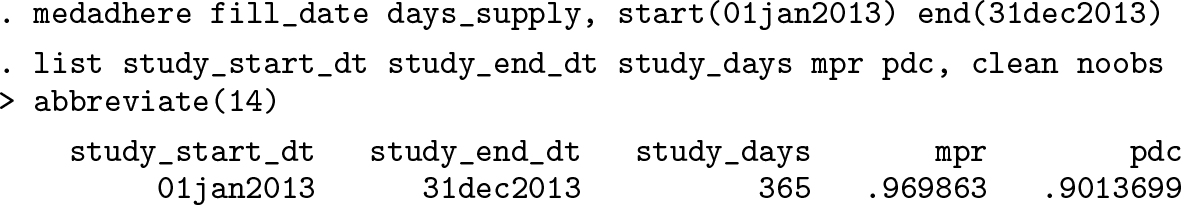
For this patient, the results indicate that the PDC is more conservative than the MPR (0.90 versus 0.97). As a reminder, a value of 1.0 indicates perfect adherence.
4.2 A single patient on multiple medications
In this example, we again assume there is only a single patient in the dataset, but this patient is refilling prescriptions for multiple medications.
First, we load
If the data are for a single patient on multiple medications, we specify

4.3 Multiple patients on a single medication
In this example, we have multiple patients in the dataset, but we assume they are all taking a single medication. We reload
If the data are for multiple individuals on a single medication, we specify

As shown, each patient’s
4.4 Multiple patients on multiple medications
In this example, we use all the data—for all patients and all medications.
If the data are for multiple patients and multiple medications, we specify
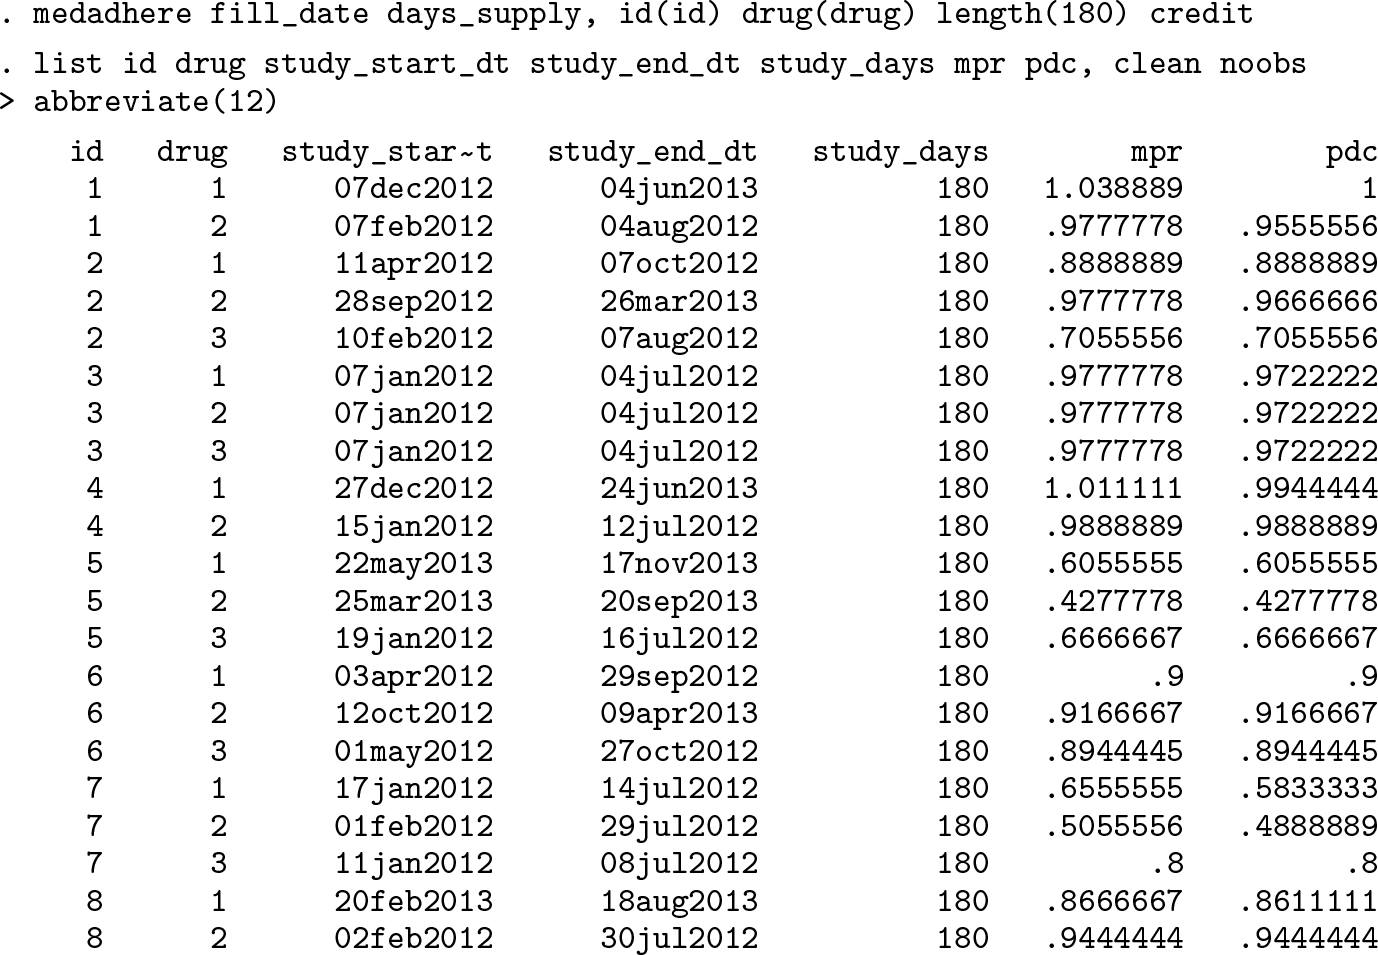
As shown, each patient’s
4.5 Dichotomizing the MPR and the PDC as measures of adherence
While both the MPR and the PDC are fractional measures of adherence ranging from 0 to 1 (except in cases where MPR overcounts the supply on hand, resulting in a value greater than 1.0), it is very common to find them dichotomized at a cutpoint of 0.80 in which patients above the cutpoint are considered adherent and those below the cutpoint are considered nonadherent (Cramer et al. 2008; Sikka, Xia, and Aubert 2005; Centers for Medicare & Medicaid Services 2018).
In this example, we use the PDC output from the previous implementation of the

From the table, we see that adherence in this sample of patients was 75%, 75%, and 60% for drugs 1, 2, and 3, respectively.
5 Discussion
Measuring medication adherence is an essential component of any strategy to improve patient outcomes and increase the quality of care. Because big data have become more readily available (via administrative claims, electronic health records, and patientgenerated data through various applications and portals), capable software programs are needed to process these measures efficiently.
In this article, I introduced the
7 Programs and supplemental materials
Supplemental Material, st0578 - Assessing medication adherence using Stata
Supplemental Material, st0578 for Assessing medication adherence using Stata by Ariel Linden in The Stata Journal
Footnotes
6 Acknowledgment
I thank the anonymous reviewer and chief editor for their thoughtful reviews and recommendations for improving both the article and the
7 Programs and supplemental materials
To install a snapshot of the corresponding software files as they existed at the time of publication of this article, type
Notes
References
Supplementary Material
Please find the following supplemental material available below.
For Open Access articles published under a Creative Commons License, all supplemental material carries the same license as the article it is associated with.
For non-Open Access articles published, all supplemental material carries a non-exclusive license, and permission requests for re-use of supplemental material or any part of supplemental material shall be sent directly to the copyright owner as specified in the copyright notice associated with the article.