Royston et al.’s (2011, Trials 12: 81) multiarm, multistage (MAMS) framework for the design of randomized clinical trials uses intermediate outcomes to drop research arms early for lack of benefit at interim stages, increasing efficiency in multiarm designs. However, additionally permitting interim evaluation of efficacy on the primary outcome measure could increase adoption of the design and result in practical benefits, such as savings in patient numbers and cost, should any efficacious arm be identified early. The nstage command, which aids the design of MAMS trial designs, has been updated to support this methodological extension. Operating characteristics can now be calculated for a design with binding or nonbinding stopping rules for lack of benefit and with efficacy stopping boundaries. An additional option searches for a design that strongly controls the familywise error rate at the desired level. We illustrate how the new features can be used to design a trial with the drop-down menu, using the original comparisons from the MAMS trial STAMPEDE as an example. The new functionality of the command will serve a broader range of trial objectives and increase efficiency of the design and thus increase uptake of the MAMS design in practice.
Multiarm, multistage (MAMS) clinical trial designs for time-to-event outcomes result in increased efficiencies in time and resources over traditional two-arm designs (Royston et al. 2011) and have been successfully implemented in trials investigating therapies in many disease areas, including oncology (Sydes et al. 2009, 2012; Parmar et al. 2017). Barthel, Royston, and Parmar (2009) developed the nstage command to assist those designing such a trial. nstage calculates the required sample size and operating characteristics with an intuitive menu-driven approach. The command was updated in 2015 to increase functionality; the update included new features such as estimation of the familywise error rate (FWER) and improved estimation of the correlation between the test statistics of treatment effects (Bratton, Choodari-Oskooei, and Royston 2015).
The MAMS design compares multiple research arms with one common control arm, using a staged approach to conduct interim analyses assessing whether each arm is demonstrating sufficient benefit over the control arm to continue recruitment to subsequent stages. The design allows for early decision making by using an intermediate outcome that occurs earlier than the definitive outcome measure so that ineffective experimental arms can be dropped efficiently. The nature of the design results in an increased probability of a single clinical trial protocol identifying an effective regimen, saves considerable time and resources, and requires fewer patients compared with multiple independent two-arm trials (Parmar, Carpenter, and Sydes 2014). Some examples of internationally known trials designed under the MAMS framework are STAMPEDE,1 which is the largest ever trial conducted in prostate cancer (Sydes et al. 2012), and RAMPART.2
It is often of interest to measure and sometimes control the probability of at least one incorrect conclusion of efficacy at the end of a MAMS trial, denoted as a type I error. The two primary measures reported in trials are the pairwise error rate (PWER), which is the probability of a type I error on each pairwise comparison of research to control arm, and the FWER, which is the probability of a type I error on a pairwise comparison of any of the research arms with the control arm. Regulatory guidelines suggest that controlling the FWER is sometimes a requirement to restrict the probability an ineffective treatment or regimen is recommended at the end of a trial, particularly in confirmatory trials (Committee for Proprietary Medicinal Products 2002).
The nstage command accommodates the specification of boundaries for assessing lack of benefit at multiple interim analyses on an intermediate outcome measure prior to the final analysis on the definitive outcome. The existing methodology, however, has not explored how the interim analysis stages could also formally test for evidence of efficacy on the definitive (primary) outcome measure. This may be desirable for both investigators and sponsors because being able to identify effective regimens earlier increases the efficiency of the design further by reducing resources allocated to these arms. It may also result in stopping the trial early to progress efficacious arms to the subsequent phase of the testing process or to seek regulatory approval and thus expedite uptake of the treatment by patients. Popular stopping boundaries implemented in alternative designs are the Haybittle–Peto rule (Haybittle 1971) and the O’Brien– Fleming rule (O’Brien and Fleming 1979). Permitting early assessment of efficacy in the MAMS design requires an approach to choosing the stopping boundary and evaluation of the impact on the operating characteristics of the trial to ensure adherence to trial regulations.
In this article, we have incorporated the methods and programming for this feature to the nstage command, which allows for the specification of efficacy stopping boundaries and evaluates the operating characteristics of a trial with early rejection of the null hypothesis permitted under both binding and nonbinding boundaries. Three different measures of power are now calculated for multiarm designs, depending on the aim of the trial. The user can also indicate whether the trial will continue to the planned end should an arm cross an efficacy boundary early. Additionally, we present a new option in nstage that searches for a design that controls the FWER at the desired level.
2 The MAMS design with efficacy stopping bounds
2.1 Design specification
For a MAMS trial with time-to-event outcomes that has K research arms and J stages, the primary definitive outcome is denoted by D. If an appropriate intermediate (I) outcome is available (see Royston et al. [2011] for guidelines), the trial benefits from increased efficiencies because interim analyses can occur earlier by basing sample sizes on a more quickly observable outcome measure. For example, progression-free survival may be used as an intermediate outcome for overall survival. Because it is also possible to use the same outcome measure for all analyses, we denote such trials by I = D, and correspondingly denotes designs where the intermediate and definitive outcomes differ.
The null and alternative hypotheses for each pairwise comparison on the definitive outcome for stages 1,…, J are defined by
where ΔD is the log hazard-ratio for assessing efficacy. Subsidiary hypotheses are also defined for each pairwise comparison on the intermediate outcome for the interim stages 1,…, J − 1:
ΔI is the log hazard-ratio for assessing which arms demonstrate sufficient promise at each interim analysis to continue recruitment to subsequent stages. A log hazard-ratio less than 0 is targeted where the trial is seeking to reduce the hazard compared with the control arm. In practice, MAMS designs usually target a predefined alternative hazard ratio for sample-size purposes; see Royston et al. (2011) on how to define target effect sizes for the I and D outcomes. The global null hypothesis HG is that all K research arms are ineffective on the definitive outcome.
The original MAMS design defined only one stopping boundary for lack of benefit at each interim stage of the trial, L = (l1,…, lJ−1), corresponding to the one-sided significance levels α1,…, αJ−1. When I 6= D, the boundaries are on the intermediate outcome measure. However, when I = D, the boundaries are on the same outcome measure as the final test. For survival outcomes, where the treatment effect is measured by a hazard ratio, L forms an upper bound because a reduction in hazard compared with the control arm indicates a beneficial treatment effect.
When stopping boundaries for efficacy are introduced at the interim stage, they can be applied only to the definitive outcome measure because it is the primary outcome of the design. No decision on efficacy can be made on the intermediate outcome measure. Let B = (b1, b2,…, bJ) be the stopping boundary on the definitive outcome at each stage, corresponding to the one-sided significance levels defined for overwhelming evidence of efficacy. The two stopping boundaries meet at stage J to ensure a conclusion can be made at the end of the trial.
At each interim stage, is the z test statistic comparing research arm k = 1,…, K with the control arm for the intermediate outcome, and is the corresponding test statistic for the definitive outcome at stage j = 1,…, J. These follow a normal distribution with mean treatment effect Δjk and variance σ2 and under the null hypothesis . The joint distribution of the z test statistics is multivariate normal (MVN),
where Δjk is a vector of mean treatment effects of the Zjk and Σ denotes the correlation between the J ×K test statistics. For designs where . Where stopping boundaries for efficacy are specified and , the joint distribution of the z statistics for the definitive outcome are also multivariate normally distributed.
At each interim analysis j = 1,…, J − 1, the test statistics for each research arm are compared with the stopping boundaries, where one of three outcomes can occur (assuming stopping rules are binding):
If , research arm k continues to the next stage.
If , research arm k is dropped for lack of benefit.
If can be rejected early, and recruitment to research arm k is terminated because of evidence of overwhelming efficacy.
Note that when I = D, the first inequality becomes .
For research arms that pass all interim analyses, at the final stage J, the test statistic for the definitive outcome measure is compared with the threshold for the final stage bJ to assess efficacy, where one of two outcomes can occur:
If , the test is unable to reject at level αJ.
If , reject at level αJ and conclude efficacy for research arm k.
2.2 Stopping early for efficacy
Allowing for early assessment on the definitive outcome measure requires an efficacy boundary to be defined based on how conservative investigators wish to be with respect to rejecting the null hypothesis early. The boundary B = (b1,…, bJ) may be chosen according to the objective of the trial. One approach is to implement an established predefined stopping rule (for example, Haybittle [1971]). Alternatively, one may use a function that determines the boundaries based on the accumulated data, such as an alpha-spending approach that distributes the overall type I error across the interim analyses (O’Brien and Fleming 1979; Gordon Lan and DeMets 1983). The p-value required to declare efficacy early can potentially affect the probability of a type I error, so a method for choosing boundaries may be desirable.
There are two approaches that may be adopted should a research arm demonstrate early evidence of efficacy during the course of the trial. A separate stopping rule (Urach and Posch 2016) denotes that the trial continues recruitment to the remaining research arms until the planned end of the trial. This may be of interest in trials testing arms with combination therapies, for example, in STAMPEDE. Alternatively, adopting a simultaneous stopping rule indicates the trial should terminate as soon as an efficacious arm is found.
In the next section, we present the updated nstage syntax.
3 Updates to nstage
3.1 Syntax
The updated syntax is described below. The last four options are the additions to the latest update.
esb(string,[ stop ]) specifies that each interim stage be assessed against efficacy bounds. The efficacy stopping rules available are as follows:
esb(hp) specifies the Haybittle–Peto rule and applies a constant one-sided p-value (p = 0.0005) at each interim stage for assessing efficacy (Haybittle 1971). esb(hp=#) specifies an alternative one-sided p-value for the Haybittle–Peto rule.
esb(obf=#) defines a one-sided p-value available to spend across the interim analyses per research arm. The program uses an alpha-spending function to approximate the O’Brien–Fleming boundaries (O’Brien and Fleming 1979) for each interim stage, proposed by Gordon Lan and DeMets (1983).
esb(custom=#…#) specifies a custom efficacy stopping rule, which allows greater flexibility when selecting the efficacy boundary for each interim stage. The input must provide a one-sided p-value for stages 1 to J − 1, separated by spaces that must be strictly decreasing. The p-values could also be generated by some function of information time, such as Whitehead and Stratton’s (1983) triangular boundaries, and then input manually for each stage using the custom option.
stop specifies a suboption after the chosen stopping rule, in which the user chooses the planned course of action should at least one arm cross the efficacy boundary at any stage from 1 to J − 1. The default option is to follow a separate stopping approach. Alternatively, if the trial should be terminated as soon as the first null hypothesis is rejected in favor of efficacy, this option should be specified to adopt a simultaneous stopping approach.
nonbinding specifies that nstage should assume nonbinding stopping boundaries for lack of benefit when estimating the operating characteristics of the design. By default, nstage assumes the stopping boundaries are binding when I = D. When , futility boundaries for I are assumed to be nonbinding by default (see Bratton, Choodari-Oskooei, and Royston [2015]).
fwercontrol(#) instructs nstage to perform an iterative search to identify the value of alpha at stage J, which will control the FWER at the user-specified value #. nstage then calculates the sample size and operating characteristics of the design that controls the FWER.
fwerreps(#) indicates the number of replicates carried out by the simulation procedure to calculate the FWER. The default is fwerreps(250000) for designs stopping early only for lack of benefit and fwerreps(1000000) for designs that also stop early for efficacy. Reducing the number of replicates will result in a faster procedure but at the cost of precision.
3.3 New stored results
We have updated the stored results to include additional useful information based on the new options and additional calculations that are carried out. We describe two alternative measures of power now estimated by nstage in section 3.5. While these measures of power are not presented in the main output, they are stored and can be obtained by the user if required. The stagewise p-values for efficacy are also stored in addition to the expected number of events accrued on the definitive outcome at each stage because the main output shows sample sizes based on the intermediate outcome when . This may be helpful if deciding whether efficacy boundaries are reasonable and feasible based on the amount of data collected on the primary outcome at interim analyses. The PWER under binding boundaries has been removed from the main output when because the operating characteristics assume nonbinding boundaries (see section 3.5) but are still obtainable from the stored results when the design stops only for lack of benefit. The following defines the new stored results.
Scalars
3.4 Dialog box
The dialog box approach to using the nstage command can be activated by nstagemenu on in the command line and has been updated with the new options (see figure 1).
Screenshots of the updated tabs of the nstage dialog box showing the new options
For a design with more than one stage, the Primary outcome tab in the dialog box displays an Assess primary outcome for efficacy at interim stage analyses option to assess the primary outcome D for efficacy at stages 1 to J − 1. After selecting this option, the user is presented with a drop-down menu for the efficacy stopping rule. The Haybittle–Peto rule has a default one-sided p-value of 0.0005 for all interim looks, which can be modified in the menu to a custom value if desired. The O’Brien–Fleming-type rule generates the p-values at each stage, with the user specifying the overall alpha to be spent across the stages for each pairwise comparison. Custom rules can also be specified, with the user defining J − 1 p-values separated by spaces. A Stop trial once any arm is dropped for efficacy option, located below the stopping rule, can be selected to indicate that a simultaneous stopping rule should be assumed. Otherwise, a separate stopping rule is implemented by default.
The Design parameters tab has been updated to include a Control the FWER at level: option to control the FWER at the level defined by the user using the value entry box. Another option, Assume non-binding stopping boundaries for lack-of-benefit, designates that the calculation of the error rates of the design should be carried out under nonbinding futility boundaries.
3.5 Operating characteristics
In this section, we first define the operating characteristics evaluated by nstage and then briefly describe how the command computes these quantities. For details of the simulation procedure and the statistical theory, see the appendix. The operating characteristics of a trial may be calculated under both a separate or simultaneous stopping rule when implementing an efficacy stopping boundary. They may also be calculated assuming both binding and nonbinding boundaries for lack of benefit. Nonbinding rules are sometimes favored at the design stage because they are more flexible, result in more conservative error rates (Chen, DeMets, and Gordon Lan 2010), and are sometimes a requirement by regulatory agencies. However, in designs with limited resources, for example, designs implementing treatment selection to meet budget constraints, binding stopping boundaries for lack of benefit might be more feasible (Crouch, Dodd, and Proschan 2017). Hence, this option covers a range of designs.
Type I error rate
In general, a type I error occurs when a research arm is declared as efficacious under the null hypothesis of no treatment effect. The PWER of a MAMS trial measures the probability of a type I error for a particular research arm. On the other hand, the FWER is the probability that a type I error is made on at least one research arm. The FWER is strongly controlled if the maximum value it can take is restricted to a predefined limit under any possible combination of treatment effects. Both measures are calculated empirically by nstage using simulation, but analytical approaches are described in the appendix.
Guaranteeing strong control of the FWER, while not always required, is likely to be of interest to those designing MAMS trials. If strong control of the type I error rate is desired, any design that controls the maximum FWER (assuming nonbinding boundaries) will control the FWER under any combination of treatment effects of the K arms. Control of the FWER will typically require an increase in sample size and thus trial duration (Blenkinsop, Parmar, and Choodari-Oskooei 2019). The new fwercontrol() option of nstage uses a combination of linear interpolation and incremental adjustment to search for a value of αJ that strongly controls the maximum FWER at the specified level.
Intermediate and definitive outcome are the same (I=D)
The PWER is calculated from the simulation procedure as the average proportion of trials that reject H0 for the definitive outcome at any stage for a research arm under the global null, HG. The FWER is calculated by counting the proportion of simulated trials with at least one rejection of H0 across any of the pairwise comparisons on the D outcome.
Intermediate and definitive outcome differ
In this case, nonbinding boundaries are assumed for lack of benefit such that the maximum possible type I error rates (maximum PWER and FWER) on the D outcome are calculated (see Bratton, Choodari- Oskooei, and Royston [2015]). This approach reflects the probability that under the null hypothesis, every treatment regimen is sufficiently effective on I such that each research arm passes all interim stages and at least one type I error is made at the final analyses or at one of the interim analyses when early rejection of H0 on the D outcome is permitted. This is evaluated by simulation in nstage when efficacy boundaries are specified.
The maximum PWER is evaluated as the average proportion of trials that reject H0 for a pairwise comparison of a research arm on the D outcome at any stage of the trial under the global null, HG. For the maximum FWER, nstage counts the proportion of simulated trials with at least one rejection of H0 for any pairwise comparison on the definitive outcome.
Type II error rate
The power of a trial is a measure of the probability the null hypothesis is rejected for a research arm under the target effect size. nstage currently estimates the power of a design as the probability of identifying a particular research arm as effective, analogous to the PWER. However, in a multiarm design, it may be of interest to estimate the power that reflects the objective of the trial. For example, dose-selection trials need to identify only one of the research arms as effective, but trials testing several independent treatments may be concerned with identifying all effective research arms. As defined by Ramsey (1978), all-pairs power is the probability of rejecting the null hypothesis for all research arms that have the target effect size, and any-pair power is the probability of rejection for at least one of several research arms with the target effect size (analogous to the FWER). nstage evaluates the three measures by counting the proportion of trials rejecting H0 for one, any, or all research arms under the global alternative hypothesis HA, depending on the measure being considered (see appendix for more details).
The pairwise power is presented in the main output. The other two measures are stored by the program; their standard errors can be calculated easily using the formula , where Ω is the calculated power and N is the number of simulations. Binding stopping rules are assumed for designs in which I = D unless the nonbinding option is specified. Again, nonbinding rules are assumed for designs in which .
Correlation structure
There are three sources of correlation in the MAMS design. The first source is through the repeated analyses of the same pairwise comparisons between each research arm and the control arm at multiple stages, with the events accruing cumulatively. The second source is through the shared control arm for each of the research arms. For the third source, where an intermediate outcome is used, correlation is induced between the outcome measures at different stages. The theoretical calculation or estimation of these three sources of correlation has been derived by others and is provided in the appendix (Royston et al. 2011; Bratton, Choodari-Oskooei, and Royston 2015).
When efficacy boundaries are implemented in trials using an intermediate (I) outcome, the calculation of the maximum FWER quantifies the probability of rejecting the null hypothesis for arms on the definitive (D) outcome for early evidence of efficacy at interim stages and at the end of the trial. The simulation procedure generates arm-level trial data and counts the trials that would drop arms for efficacy based on the D outcome when lack of benefit is assessed on the I outcome. To obtain these quantities under the correct correlation structure, nstage estimates the between-stage correlation for the treatment effects on the D outcome when efficacy boundaries are specified. The simulation routine extracts the number of D events observed when the interim stage is triggered by the required number of I events. The average number of events across the simulation repetitions for two stages i and j is then fed into the correlation matrix using the formula for element Rij given in Royston et al. (2011). The empirical calculation of the type I error is then dependent only on the correlation between the treatment effects on the D outcome.
4 Example
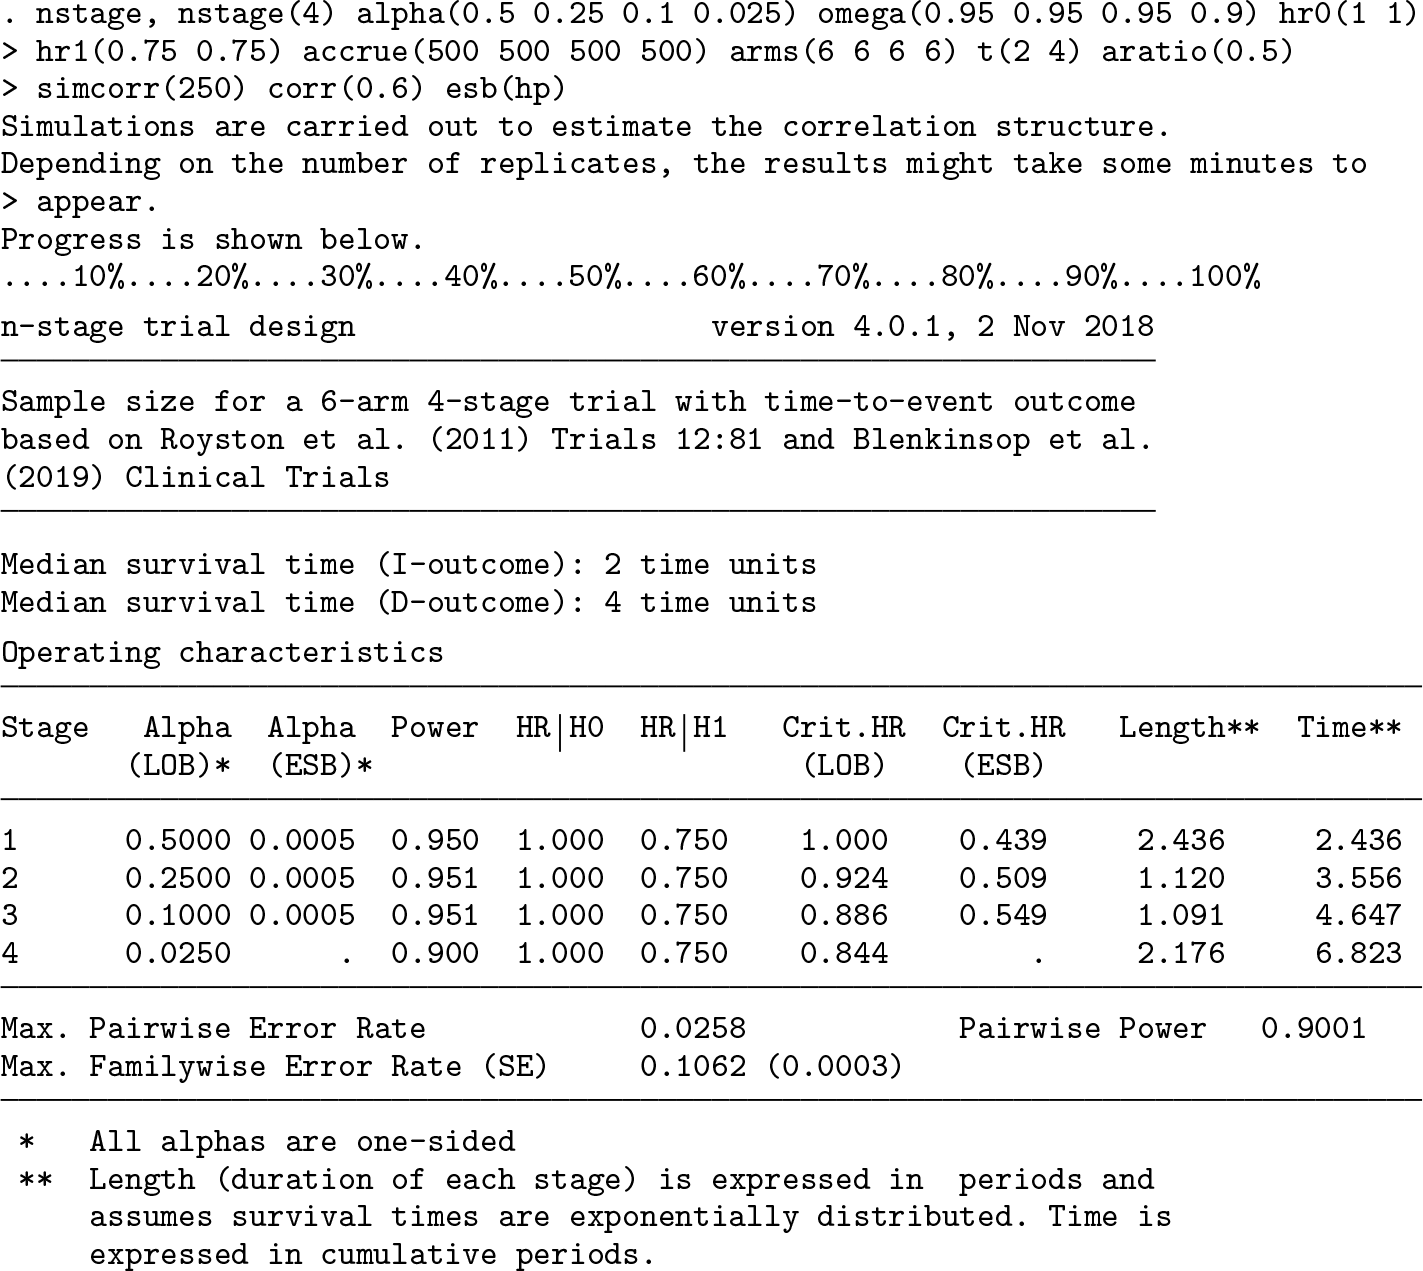
To illustrate the updates and demonstrate how the new output from nstage can be interpreted, we present an example below that uses the design specification for the original comparisons in the STAMPEDE trial, which started as a six-arm four-stage MAMS design with (Sydes et al. 2012; Parmar et al. 2008). The stopping boundaries for lack of benefit are defined by alpha(numlist), and the target power for the sample-size calculation of each stage is defined by omega(numlist). The treatment effects under the null and alternative hypotheses are given by hr0(# #) and hr1(# #), where the first value denotes the hazard ratio on the intermediate outcome and progression-free survival and the second value indicates the hazard ratio on the definitive outcome and overall survival. accrue(numlist) specifies the expected recruitment rates over the course of the trial, arms(numlist) is the number of arms recruiting per stage, and aratio(#) is the randomization ratio between control and research arms. t(# #) is the time corresponding to the survival probability of an intermediate and definitive outcome measure event, respectively. simcorr(#) and corr(#) are used to simulate the correlation structure between the survival times of the intermediate and definitive outcomes with the specified number of replicates. It is assumed that all six arms can progress to the end of the trial conditional on passing assessments for lack of benefit.
In the first command, an efficacy stopping boundary is hypothetically implemented in retrospect using the option esb(hp). The second column of the operating characteristics table in the output reports the p-values required for stopping for efficacy at each stage. In this example, under the Haybittle–Peto rule, each stage requires p ≤ 0.0005 to declare efficacy early, shown under the column Alpha (ESB). The efficacy boundary for the final stage equals the final stage boundary for lack of benefit, denoted in the column Alpha (LOB), to ensure a conclusion to the trial. Because the STAMPEDE trial uses an intermediate outcome for assessing lack of benefit at interim, the output presents the maximum FWER, as defined in section 3.5, as the type I error measure of interest. This is calculated to be 10.6%. The design has an overall pairwise power of 90.0%. The all-pairs and any-pair power are 66.7% and 99.8%, respectively, obtained with the return list command (output not shown). We note that the pairwise power differs from the 83% presented in the previous publication (Bratton, Choodari-Oskooei, and Royston 2015) because the latest software update considers nonbinding stopping boundaries (see section 3.5). However, it can still be obtained using the return list command.
Although the focus of the STAMPEDE trial was on strong control of the PWER, we demonstrate how the FWER could be controlled for this design. The following command specifies that interim analyses should assess for efficacy on the definitive outcome and the program should search for a design that controls the FWER at a maximum of 2.5%. The design parameters and options remain the same.
The option for controlling the FWER identified the final stage α required to ensure a maximum FWER of 2.5% as 0.0043. The output has been reduced to show only the sample sizes required for the final stage of the design, which has changed to achieve control of the FWER. The number of control-arm events required for the stage 4 analysis should be increased from 403 to 582 to ensure control of the FWER at the desired level. This 44% increase in the number of events required would require substantially greater resources; for this reason, investigators should carefully consider at the design stage whether control of the FWER or the PWER is the focus of the design. See Blenkinsop, Parmar, and Choodari-Oskooei (2019) for further examples of how other stopping boundaries might affect the FWER.
5 Implementing the new features
A simulation study into the impact of implementing efficacy stopping boundaries in a MAMS design has indicated that increasing the number of stages in the design will inflate the relative FWER when early rejection of the null is allowed, compared with designs dropping arms only for lack of benefit (Blenkinsop, Parmar, and Choodari-Oskooei 2019). Designs with three or more stages are more susceptible to inflation of the FWER, with relative inflation up to 2% for four-stage designs when I = D and 4% when under a Haybittle–Peto stopping rule.
When one chooses an efficacy boundary, the Haybittle–Peto rule with the default one-sided p-value of 0.0005 at each stage can be implemented with minimal penalty on the FWER irrespective of the design parameters (the default rule implemented in nstage). However, because the thresholds are independent of the timing of interim analyses, the rule may be considered too conservative at late-stage interim analyses. In such cases, the user can compare the operating characteristics for more liberal custom stopping rules using nstage to choose the stopping boundaries. Allowing early rejection of the null has been shown to have negligible impact on power.
The FWER is unaffected by whether the trial terminates early, and the PWER decreases only marginally with a simultaneous stopping rule, compared with a separate stopping rule, by up to 0.001 for a four-stage design with four arms.
6 Discussion
At the time of publication, no other software has the capability to perform sample-size calculations and estimate the operating characteristics of a MAMS design that can assess efficacy on a primary outcome while assessing lack of benefit on a more quickly observable intermediate outcome measure for time-to-event data. Some examples of alternatives to the nstage command are the MAMS package in R and the commercial EAST6 software. However, these programs cannot accommodate the use of intermediate outcome measures at interim analyses for trials with time-to-event endpoints, making the design here highly efficient compared with alternative designs by allowing earlier decision making. Additionally, both the MAMS package and EAST6 assume a simultaneous stopping rule. However, nstage can also perform the calculations for the operating characteristics assuming the trial continues to the planned end once an arm stops recruitment after the null is rejected at an interim analysis (a separate stopping rule). Blenkinsop, Parmar, and Choodari-Oskooei (2019) have described different design strategies one might consider, given the nature of treatments and research questions under consideration. Because there are situations where both approaches may be appropriate, we allow a broad application of efficacy stopping boundaries in practice.
Considering estimation, early rejection of the null hypothesis may risk overstating treatment effects (Whitehead and Stratton 1983). It has been shown that following up patients in arms dropped early for lack of benefit reduces bias in point estimates (Choodari-Oskooei et al. 2013). We recommend that any research arms that may terminate recruitment early because of an early signal of efficacy should also be reanalyzed at the planned end of the trial to reduce bias in the estimated treatment effect.
The speed of nstage compares favorably against other freely available software and programs, completing within a reasonable time frame even for complex designs. This allows users to compare the properties of different design specifications easily and quickly. A maximum runtime of 10 minutes was observed for a design based on STAMPEDE that used an intermediate outcome, implemented efficacy stopping boundaries, and strongly controlled the FWER. This is reduced to under three minutes without FWER control. Note that many comparable designs do not have the complexities of STAMPEDE because of either the number of stages or the multiple outcome measures used in the design.
While the approach to controlling the FWER described in this article adjusts the final stage significance level, users of nstage may also adjust the interim efficacy boundaries to be more conservative with the custom option to address any inflation of the FWER. Alternative approaches have been proposed for MAMS designs with I = D to meet the FWER restrictions imposed (for example, Magirr, Jaki, and Whitehead [2012]; Wason and Jaki [2012]; Proschan and Dodd [2014]; Crouch, Dodd, and Proschan [2017]). However, our approach does not adjust the early stopping boundaries to be more conservative, ensuring high power at early stages of the trial, and FWER control holds under nonbinding stopping boundaries for lack of benefit.
Efficacy-stopping rules can easily be implemented for alternative outcome measures in MAMS designs with intermediate outcome measures, such as in the corresponding command nstagebin (Bratton 2014) for designing MAMS trials with binary outcomes using the same principles applied here. This is an area for future work.
7 Conclusion
We have demonstrated in this article how the nstage command allows easy specification and implementation of efficacy stopping boundaries to a MAMS design and gives the investigator the appropriate information required to calculate and control the relevant operating characteristics of the design with minimal computation. The manual input to the command is to consider which error rates are of interest to the trial, whether the FWER should be controlled by modifying the design parameters, and whether the trial should be terminated as soon as a treatment comparison crosses the efficacy bound. The updated nstage command can calculate the FWER or maximum FWER with the implementation of efficacy stopping boundaries, and a new option can be used to design a MAMS trial that strongly controls the FWER at the desired level. We have also provided guidance on which stopping rules should be chosen in practice and which design characteristics can make the trial vulnerable to inflation of the FWER when ef- ficacy boundaries are implemented. Finally, we have illustrated how to implement the command in practice using a real MAMS trial as an example.
9 Programs and supplemental materials
Supplemental Material, st0175_2 - Multiarm, multistage randomized controlled trials with stopping boundaries for efficacy and lack of benefit: An update to nstage
Supplemental Material, st0175_2 for Multiarm, multistage randomized controlled trials with stopping boundaries for efficacy and lack of benefit: An update to nstage by Alexandra Blenkinsop and Babak Choodari-Oskooei in The Stata Journal
Footnotes
8 Acknowledgments
We thank the handling editor and reviewer and also thank Professor Patrick Royston for his helpful comments on an earlier version of this article. We also thank Matthew R. Sydes (ORCID 0000-0002-9323-1371) for his suggestions to improve the output from the nstage command and comments on the article. We acknowledge the MRC grant MC_UU_12023/29 for funding this research.
9 Programs and supplemental materials
To install a snapshot of the corresponding software files as they existed at the time of publication of this article, type
. net sj 19-4
. net install st0175_2 (to install program files, if available)
. net get st0175_2 (to install ancillary files, if available)
Notes
A Appendix
References
1.
BarthelF. M.-S.RoystonP.ParmarM. K. B.2009. A menu-driven facility for sample-size calculation in novel multiarm, multistage randomized controlled trials with a time-to-event outcome. Stata Journal9: 505–523.
2.
BlenkinsopA.ParmarM. K. B.Choodari-OskooeiB.2019. Assessing the impact of efficacy stopping rules on the error rates under the multi-arm multi-stage framework. Clinical Trials16: 132–141.
3.
BrattonD.2014. nstagebin: Stata module to perform sample size calculation for multi-arm multi-stage randomised controlled trials with binary outcomes. Statistical Software Components S457911, Department of Economics, Boston College. https://ideas.repec.org/c/boc/bocode/s457911.html.
4.
BrattonD. J.Choodari-OskooeiB.RoystonP.2015. A menu-driven facility for sample-size calculation in multiarm, multistage randomized controlled trials with time-to-event outcomes: Update. Stata Journal15: 350–368.
5.
ChenY. H. J.DeMetsD. L.Gordon LanK. K.2010. Some drop-the-loser designs for monitoring multiple doses. Statistics in Medicine29: 1793–1807.
6.
Choodari-OskooeiB.ParmarM. K. B.RoystonP.BowdenJ.2013. Impact of lack-of-benefit stopping rules on treatment effect estimates of two-arm multi-stage (TAMS) trials with time to event outcome. Trials14: 23.
7.
Committee for Proprietary Medicinal Products. 2002. Points to consider on multiplicity issues in clinical trials. Technical report, EMEA.
8.
CrouchL. A.DoddL. E.ProschanM. A.2017. Controlling the family-wise error rate in multi-arm, multi-stage trials. Clinical Trials14: 237–245.
GhoshP.LiuL.SenchaudhuriP.GaoP.MehtaC.2017. Design and monitoring of multi-arm multi-stage clinical trials. Biometrics73: 1289–1299.
11.
Gordon LanK. K.DeMetsD. L.1983. Discrete sequential boundaries for clinical trials. Biometrika70: 659–663.
12.
HaybittleJ. L.1971. Repeated assessment of results in clinical trials of cancer treatment. British Journal of Radiology44: 793–797.
13.
MagirrD.JakiT.WhiteheadJ.2012. A generalized Dunnett test for multi-arm multi-stage clinical studies with treatment selection. Biometrika99: 494–501.
14.
O’BrienP. C.FlemingT. R.1979. A multiple testing procedure for clinical trials. Biometrics35: 549–556.
15.
ParmarM. K. B.BarthelF. M.-S.SydesM.LangleyR.KaplanR.EisenhauerE.BradyM.JamesN.BookmanM. A.SwartA.-M.QianW.RoystonP.2008. Speeding up the evaluation of new agents in cancer. Journal of the National Cancer Institute100: 1204–1214.
16.
ParmarM. K. B.CarpenterJ.SydesM. R.2014. More multiarm randomised trials of superiority are needed. Lancet384: 283–284.
17.
ParmarM. K. B.SydesM. R.CaffertyF. H.Choodari-OskooeiB.LangleyR. E.BrownL.PhillipsP. P. J.SpearsM. R.RowleyS.KaplanR.JamesN. D.MaughanT.PatonN.RoystonP. J.2017. Testing many treatments within a single protocol over 10 years at MRC Clinical Trials Unit at UCL: Multi-arm, multistage platform, umbrella and basket protocols. Clinical Trials14: 451–461.
18.
ProschanM. A.DoddL. E.2014. A modest proposal for dropping poor arms in clinical trials. Statistics in Medicine33: 3241–3252.
19.
RamseyP. H.1978. Power differences between pairwise multiple comparisons. Journal of the American Statistical Association73: 479–485.
20.
RoystonP.BarthelF. M.-S.ParmarM. K. B.Choodari-OskooeiB.IshamV.2011. Designs for clinical trials with time-to-event outcomes based on stopping guidelines for lack of benefit. Trials12: 81.
21.
SydesM. R.ParmarM. K. B.JamesN. D.ClarkeN. W.DearnaleyD. P.MasonM. D.MorganR. C.SandersK.RoystonP.2009. Issues in applying multi-arm multi-stage methodology to a clinical trial in prostate cancer: The MRC STAMPEDE trial. Trials10: 39.
22.
SydesM. R.ParmarM. K. B.MasonM. D.ClarkeN. W.AmosC.AndersonJ.de BonoJ.DearnaleyD. P.DwyerJ.GreenC.JovicG.RitchieA. W. S.RussellJ. M.SandersK.ThalmannG.JamesN. D.2012. Flexible trial design in practice—stopping arms for lack-of-benefit and adding research arms mid-trial in STAMPEDE: A multi-arm multi-stage randomized controlled trial. Trials13: 168.
23.
UrachS.PoschM.2016. Multi-arm group sequential designs with a simultaneous stopping rule. Statistics in Medicine35: 5536–5550.
24.
WasonJ. M. S.JakiT.2012. Optimal design of multi-arm multi-stage trials. Statistics in Medicine31: 4269–4279.
25.
WhiteheadJ.StrattonI.1983. Group sequential clinical trials with triangular continuation regions. Biometrics39: 227–236.
Supplementary Material
Please find the following supplemental material available below.
For Open Access articles published under a Creative Commons License, all supplemental material carries the same license as the article it is associated with.
For non-Open Access articles published, all supplemental material carries a non-exclusive license, and permission requests for re-use of supplemental material or any part of supplemental material shall be sent directly to the copyright owner as specified in the copyright notice associated with the article.