
Abstract
Jessie Himmelstern and Elizabeth Wrigley-Field on a misleading benchmark.
None of us has objective foundations for understanding the scale of most risks, or—certainly—for how that scale should translate into action. And so we benchmark: we calibrate our sense of risk by comparing novel threats to other risks, for which our behavioral repertoires are already established. We learn how to handle new situations by considering, and perhaps adjusting, what we did in old situations.
In debates about COVID-19 mitigation strategies, it was common both to make and to resist comparisons that equated the pandemic to influenza.
This makes sense. Making complex and nuanced risk assessments is cognitively challenging, and it often relies on interpreting population-level statistics whose implications are highly abstract from the perspective of one individual life. Heuristics—like comparing novel risks to familiar ones—let us gauge risks whose magnitudes are difficult to conceptualize directly. But such heuristics do not arise neatly from the intrinsic features of a health risk; they also reflect the sociopolitical processes that frame a particular disease as more or less risky and more or less important to mitigate.
Few situations that a whole society must grapple with are as novel as a once-a-century global pandemic, and how to benchmark it was (and remains) as controversial as other aspects of pandemic response. In particular, in debates about COVID-19 mitigation strategies, it was common both to make and to resist comparisons that equated the pandemic to influenza.
When the comparison to flu was used in the context of a larger argument against COVID-19 mitigation, it reflected the U.S. context, in which flu is socially conceptualized as a minor risk despite causing tens of thousands of deaths in the United States annually. This conceptualization is underscored by linguistic practice: “flu” is informally used as a designator for a wide variety of minor ailments (including unrelated “stomach flus” and the widespread, but highly heterogeneous, category “colds and flus”). In a country where 20-25% of workers lack paid sick leave and others, who have it, are expected not to use it, minimizing the potential severity of respiratory illness may have a particular cultural logic.
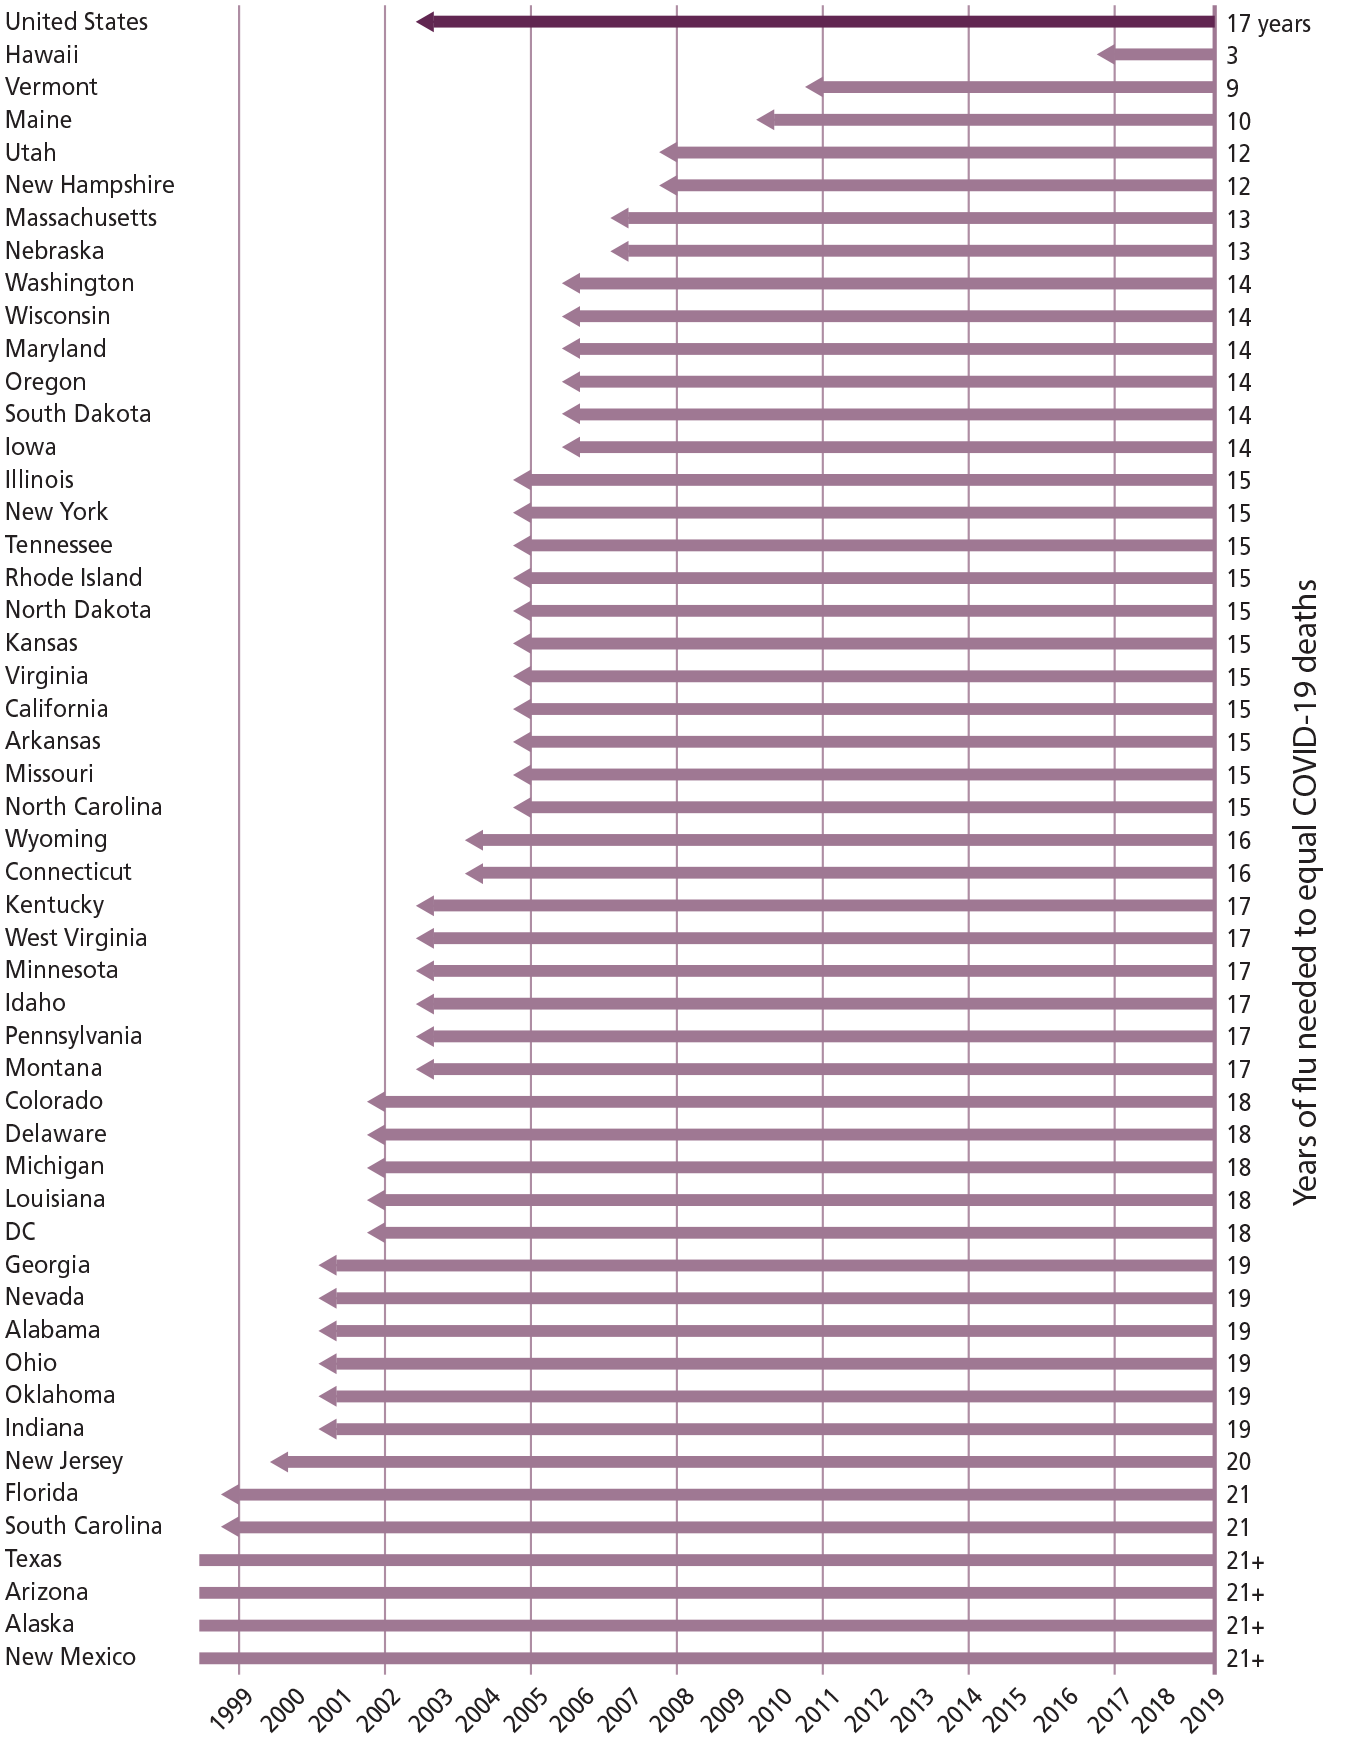
For the United States as a whole, the COVID-19 pandemic through February 2023 was the equivalent of 17 years of flu and pneumonia mortality.
iStockPhoto.com // peterschreiber.media

Underlying COVID-19 Deaths
Source: National Center for Health Statistics
Years required for death rates to influenza and pneumonia (beginning in 2019 and counting backwards) to match the cumulative death rate to COVID-19 over a three-year period (March 2020-February 2023), for the United States as a whole (top line) and by state. The COVID-19 deaths included are those in which COVID-19 is listed as the underlying cause of death, and likewise for influenza and pneumonia.
We take the comparison between COVID-19 and flu seriously by asking how many years of influenza and pneumonia deaths are needed for cumulative deaths to those two causes to equal the cumulative toll of the COVID-19 pandemic between March 2020 and February 2023—that is, three years of pandemic deaths. We group influenza and pneumonia together because it is common for pneumonia to be the ultimate cause of death following influenza infection. As context, we note that flu and pneumonia deaths just before the pandemic, in 2019, were the ninth major category of causes of death in the United States—just below nephritis (kidney disease) and just above suicide—and accounted for 1.7% of all U.S. deaths, whereas heart disease, the top cause, accounted for 23%.
We use data from the National Center for Health Statistics and include as “COVID-19 deaths” only those where COVID-19 is assigned as the underlying—not merely a contributing—cause of death. Similarly, influenza and pneumonia deaths are those in which either was listed as the underlying cause of death. Because deaths are reported on a lag—the COVID-19 deaths analyzed here were downloaded on June 1, 2023, and death reporting is typically mostly complete within a few months after deaths occur—the COVID-19 cumulative death rates, and hence the time needed for influenza and pneumonia death rates to match them, will be slightly underreported.
In calculating the influenza and pneumonia seasons needed to match deaths from the COVID-19 pandemic, we begin at the end of 2019 (just before the start of the COVID-19 pandemic in the United States) and move backward in time, in units of one year, until cumulative mortality rates to influenza and pneumonia equal cumulative COVID-19 mortality rates. We avoid incorporating flu and pneumonia deaths during the COVID-19 pandemic because the pandemic substantially altered flu mortality: the 2020-2021 flu season was minimal because the social distancing that people and organizations used to avoid COVID-19 turned out to be highly effective in preventing the flu. There has also been persistent, and still unresolved, debate about how many deaths attributed to influenza or pneumonia—but not COVID-19—were actually due to COVID-19, and we sidestep those questions by beginning our backwards-running clock just before the COVID-19 pandemic. Finally, we calculate the time needed to equalize cumulative COVID-19 death rates—not cumulative COVID-19 deaths—so that the comparison is not distorted by population growth during the period we study.
Hawaii death rates to flu and pneumonia (1999-2019) and COVID-19 (2020-2022)
Source: National Center for Health Statistics
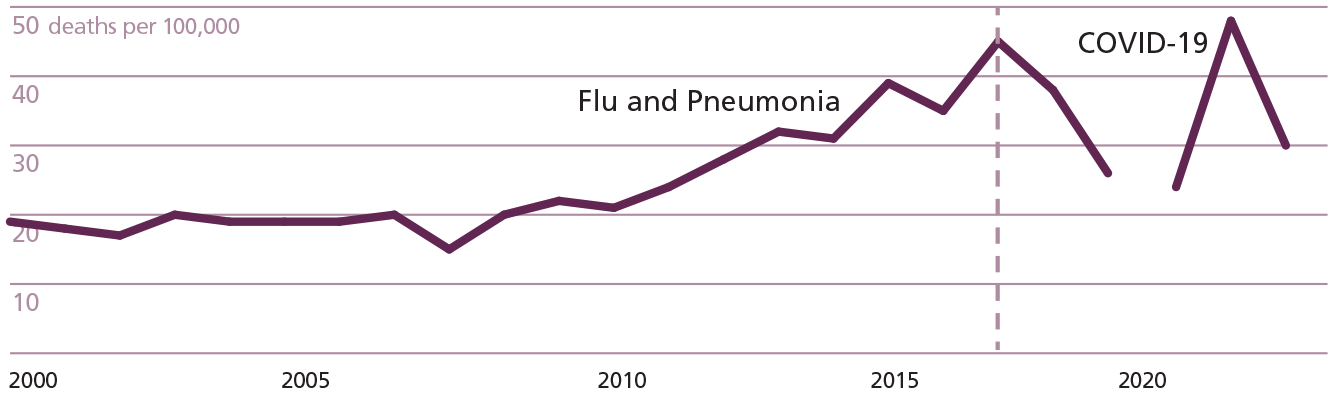
Death rates for influenza and pneumonia (1999-2019) and COVID-19 (2020-2023) in Hawaii. The COVID-19 deaths included are those in which COVID-19 is listed as the underlying cause of death, and likewise for influenza and pneumonia. The magenta line at 2017 indicates the start of the period for which subsequent influenza and pneumonia deaths (through 2019) generate a cumulative death rate equal to that of the first three years of the COVID-19 pandemic.
The figure on page 51 shows the results of this comparison. For the United States as a whole, the COVID-19 pandemic through February 2023 was the equivalent of 17 years of flu and pneumonia mortality. There is substantial variation in this outcome across states. Hawaii needs only 3 years: its flu and pneumonia death rates from 2017-2019 exceed its COVID-19 death rates from March 2020 to February 2023 (also a three-year span). Hawaii excepted, states range from 9 to more than 21 years (the maximum time period covered in the available data), with a median of 16 years. The results in general show substantial variation across states which is not associated in any obvious way with geographic region, state politics, or state demographics, perhaps reflecting in part that some risk factors that drive heavy COVID-19 mortality have also driven flu and pneumonia mortality for a long time. Variation notwithstanding, the minimum length of time to match COVID-19 mortality, with the exception of Hawaii, is three times longer than the COVID-19 pandemic period analyzed here, and usually much longer.
When people say that COVID-19 was “just the flu,” they are wrong in their facts—COVID was far worse—but also wrong in their premise: flu kills more than most of us think it does.
Hawaii’s exceptional outcome is instructive. In Hawaii, alone, the COVID-19 pandemic is “like the flu.” This reflects a relatively unusual flu history in Hawaii, as shown in the figure above. In Hawaii, influenza and pneumonia deaths have, in general, risen steadily since 2008, and 2017 was an exceptionally harsh flu year (with 11 of 2017’s 12 months having either the highest or second-highest rate of flu and pneumonia deaths in Hawaii for that month in any year from 2009-2019). Thus, counting backwards, we find that Hawaii needs go only back to 2017 to match COVID’s cumulative death rate.
Hawaii excepted, this analysis supports the perspective that the COVID-19 pandemic has had consequences quite unlike influenza and pneumonia. It takes 17 years for the United States to accrue as much cumulative mortality to these causes as were accumulated to COVID-19 in three years. For four states, this comparison outstrips the available data: one would have to amass deaths from 2019 to even earlier than 1999 to match COVID-19 death rates. On the other hand, even as it highlights the drastic difference between flu and COVID-19, the figure on the previous page can also be read to underscore the lethality of flu. COVID-19 is a once-a-century pandemic that has led to historic drops in life expectancy all over the world, including in the United States for consecutive years. The 17 years of flu and pneumonia required to match this cumulative rate of death is more than five times longer than COVID-19 took to enact the same toll—but flu is not a once-a-century phenomenon. From that perspective, the first figure underscores the vast toll of respiratory viruses for health and survival in the United States. In that sense, these results not only provide an easy-to-understand calibration of influenza as a heuristic for the scale of COVID-19 mortality; they also provide calibration for the converse heuristic as well. When people say that COVID-19 was “just the flu,” they are wrong in their facts—COVID was far worse—but also wrong in their premise: flu kills more than most of us think it does.
Footnotes
Correction (May 2024):
This article has been updated to reflect missing funder information.
This research was supported by the Eunice Kennedy Shriver National Institute for Child Health and Human Development via the Minnesota Population Center (awards T32HD095134 and P2CHD041023).