
Abstract
Reginald A. Byron on reports of poor service.
“I walked into a discount store where I saw a[n] [Asian American] woman conversing with another person; when she got in line at a register to purchase her food, she was stopped, and the person working the register called her slurs, then a virus, and then refused to check her out.” This quote from the 2022 STOPAA-PIHATE report “Two Years and Thousands of Voices: What Community Generated Data Tell Us About Anti- AAPI Hate” dovetails with contemporary inequality that I’ve found in my own research. For instance, one case in my recent Sociology of Race & Ethnicity article included the following allegation lobbed at Jasmine Ward, a Black woman, who was falsely accused of dining and dashing by a restaurant manager: “How are you paying, by cash or credit card? Because you were here last week and ran up a tab without paying.”
Racial discrimination like this will not be surprising to many customers of stores and restaurants in the United States. Yet this everyday inequality remains noteworthy because perceptions of such mistreatment in public accommodations have been associated with declines in racial minority victims’ mental and physical health (see, for instance, Patricia Coogan and her coauthors’ 2020 piece, “Experiences of Racism and Subjective Cognitive Function in African American Women”). To my knowledge, there are no current multivariate analyses that have systematically investigated perceptions of public accommodations inequality using data from before and during the COVID-19 pandemic, a time of pronounced racialized bias against African Americans and Asian Americans related to wearing masks and social distancing in public accommodations (here, Kimberly Barsamian Kahn and Emma E.L. Money’s 2021 “(Un)Masking Threat” is instructive).
I use data from the General Social Survey (GSS) to help fill this empirical gap. The GSS is an invaluable nationally representative cross-sectional assessment of a variety of American attitudes and behaviors. For the first time since its initiation in 1972, in both 2018 and 2021, the GSS asked respondents a question that is traditionally a part of scales attempting to capture composite measures of everyday discrimination. That question, which serves as my dependent variable in this study, is represented by the GSS variable poorserv and asks, “In your day-to-day life, how often have any of the following things happened to you? You receive poorer service than other people at restaurants or stores.” I use a variable named racecen1 as my primary independent variable to capture racial/ethnic status because it allows for a disaggregation of racial minorities into distinct groups and is available across both time periods. Racecen1 has 16 racial/ethnic categories which I merged into six groupings (i.e., Asian American, Black or African American, Hispanic/Latino, Native American, Other Racial Minorities, and White/European American).
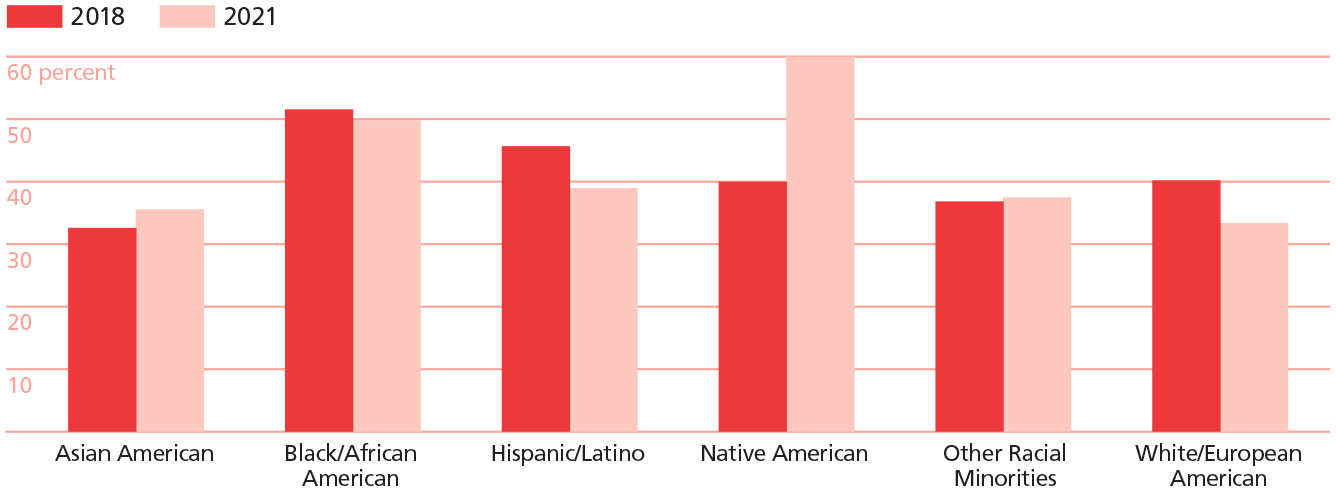
The figure below shows the raw, unweighted percentages of Americans who report that they have received poorer services than others at restaurants and stores at least a few times a year or more. Greater percentages of Black (51.56% in 2018 and 49.83% in 2021) and Hispanic (45.68% in 2018 and 38.96% in 2021) Americans perceive poorer service at least a few times a year or more in restaurants and stores than White Americans (40.21% in 2018 and 33.39% in 2021). Further, by 2021, all racial minority groups perceived poorer service than White Americans at least a few times a year, although caution should be used in interpreting the results for Native Americans and the Other racial minorities group because of small sample sizes (n<50).
Moving beyond these simple percentages, the figure on the next page shows how these different racial minority groups view service in public accommodations after accounting for potential confounding variables like a person’s sex, marital status, employment status, income, age, education, immigration status, political views, and geographic region of residence in the United States. It is notable that I reverse-coded the dependent variable poorserv and recoded others for ease of visual interpretation. I also added relevant post-stratification weighting (a statistical technique used to help the sample more accurately represent the general American population) while running the ordinal logistic regression models.
A rather simple way to interpret the second figure is to look for two things. First, if the circle data point and line (-•-) for any given variable does not cross the vertical line drawn from the x-axis value of 1, we know that that variable is a statistically significant predictor of perceptions of poor service. This is the case with Asian Americans in 2021 and Black/African Americans in both 2018 and 2021.
Perception of poorer service in restaurants and stores-at least a few times a year or more
Source: General Social Surveys, 2018-2021 Cross-Sections; 2 Datafiles and 2 Codebooks; Data accessed from the GSS Data Explorer website at gssdataexplorer.norc.org.
Ordinal logistic regression predicting perceptions of poorer service than others in restaurants and stores
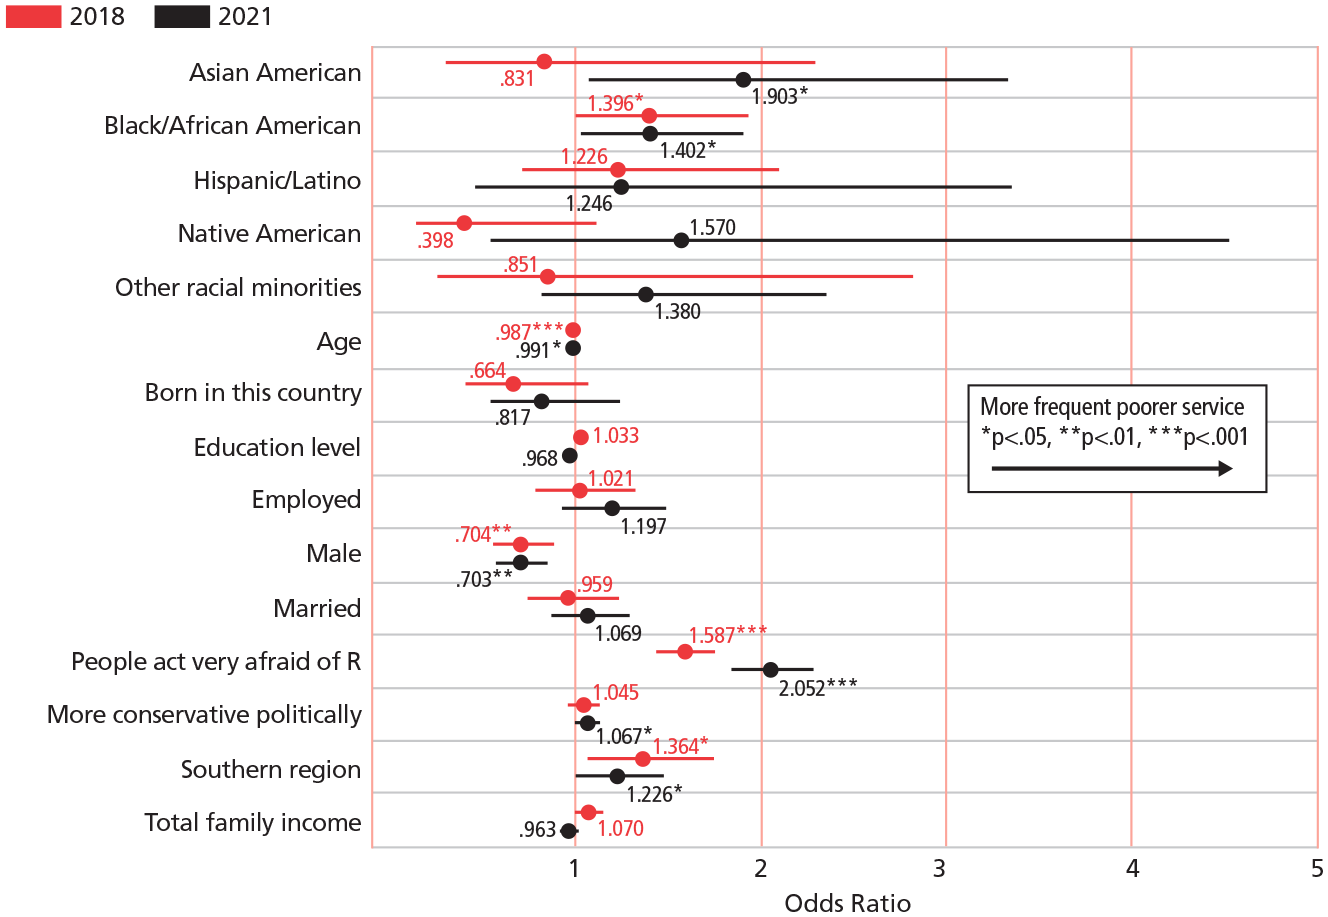
Second, these statistically significant values will also have stars next to them, denoting the probability that the relationship between the variable in question and the dependent variable (poorserv) is due to chance (*=p<.05; **=p<.01, and ***=p<.001). The more stars there are, the less likely the relationship between the variables is due to simple chance. Note how some significant variables appear to cross the vertical line drawn from the x-axis value of 1 (e.g., age). However, in truth, they are simply extremely close to it (e.g., .987 and .991).
What can we learn from this figure? One key finding is that, after controlling for a host of potentially confounding variables, Black/African Americans are statistically more likely to report frequent poorer service than White/European Americans in restaurants or stores across both time frames and Asian Americans became statistically more likely to report frequent poorer service than White/European Americans in restaurants or stores during the pandemic (but not before it). More specifically, Black/African Americans had between 39.6% and 40.2% higher odds of reporting frequent poorer service than White/European Americans in restaurants or stores (across both time periods) and Asian Americans had 90.3% higher odds of reporting frequent poorer service than White/European Americans in restaurants or stores in 2021.
Given the available research on the enduring significance of anti-Black racism in public accommodations (related to worker perceptions of who is likely to steal from stores and established biases against Black restaurant patrons commonly surrounding worker perceptions of tipping behavior) and the calculable COVID-19-related rise in (often overt) anti-Asian racism in U.S. public accommodations (centering on stereotypes about the spread of COVID-19, mask wearing, and social distancing), such results align with what we might expect about the durable and adaptive manifestations of racism and yet are still revelatory.
Other variables are also significant predictors of Americans’ perceptions of poorer service in restaurants and stores. Across both time periods, and after accounting for potentially confounding variables, older people and men are statistically less likely to report frequent poorer service in public accommodations when compared to younger people and women. Furthermore, people who live in the Southern United States and people who report that others are very afraid of them express more frequent perceptions of poorer service in public accommodations. Lastly, conservative respondents in 2021 were significantly more likely to report more frequent, poorer service in stores and restaurants than liberal respondents. This may very well have to do with emergent contests over mandatory mask wearing in stores and restaurants during the pandemic, as explored by Eric Klinenberg and Melina Sherman in their 2021 Public Culture article, “Face Mask Face-Offs: Culture and Conflict in the COVID-19 Pandemic.”
The current visualizations provide a unique snapshot of the various groups who were likely to perceive poorer service than others in public accommodations, both before and during the COVID-19 pandemic. While bivariate analyses reveal part of the story, multivariate regression analyses more robustly highlight both consistencies in statistically significant perceptions of differential treatment in public accommodations, among Black/African Americans and emerging patterns of statistically significant perceptions of differential treatment among Asian Americans. Such results provide systematic, quantitative support to the many individual-level examples of discrimination in public accommodations such as those that open this article, those documented in qualitative empirical studies, and those that go viral on social media because of video evidence (often garnering the hashtags #LivingWhileBlack or #StopAAPIHate). They also add multivariate evidence to our understanding of contemporary U.S. race relations and underscore how even routine trips to stores and restaurants may be laden with perceptions of inequality among some racial minority groups.