Abstract
Using data from the General Social Survey, sociologist Thomas J. Linneman shows that conservatives and liberals increasingly differ regarding government action to reduce income inequality. Rich liberals support government action nearly as much as poor liberals, while among rich conservatives there is very little support for government action.
Keywords
As part of a weekly contest, The Week magazine recently challenged its readers to come up with a dumb bumper sticker that would be met with outrage and ridicule. The winner? “I am the 1 Percent!” As a result of Occupy Wall Street and related movements, the 1 percent and its 99 percent counterpart have achieved an enviable level of recognition in the American psyche. Seldom has a social movement slogan so quickly taken root. Indeed, many believe that Occupy Wall Street’s primary achievement has been raising the American public’s awareness of income inequality, and giving the public a simple way to conceptualize this inequality.
Rich conservatives have consistently been the most opposed to government action in reducing income inequality.
The 99 percent/1 percent dichotomy is, like many social movement slogans, overly simplified in order to achieve an effect. But let’s take this divide seriously for a moment and see if the attitudes of those from the highest income bracket indeed differ significantly from the rest of Americans. Or perhaps there is some common ground upon which to build.
The General Social Survey (GSS) is one of the premier data collection efforts in the social sciences. Since 1972, every year, or every other year, extensive data on the attitudes and behaviors of a randomly sampled cross-section of Americans is collected. Though they choose a new sample every time, the survey administrators are careful to keep the question wording consistent for hundreds of survey items, allowing for analysis of trends in American opinion. One of these repeated items is called EQWLTH: “Some people think that the government in Washington ought to reduce the income differences between the rich and the poor, perhaps by raising the taxes of wealthy families or by giving income assistance to the poor. Others think that the government should not concern itself with reducing this income difference between the rich and the poor. Here is a card with a scale from one to seven. Think of a score of one as meaning that the government ought to reduce the income differences between rich and poor, and a score of seven meaning that the government should not concern itself with reducing income differences. What score between one and seven comes closest to the way you feel?” The GSS has asked this question 20 times since 1978, giving us a 32-year trend. I reordered this variable so that it runs from zero (the government should do nothing, “zero”) to six (the government should reduce income differences).
Regarding income, the categories the GSS uses for the Total Family Income variable do not allow me to identify “the 1 percent.” And if they did, the number of 1-percenters would likely have been too small to analyze. Instead, I compare those in the very top income category to those in the other categories. The top income category comprises anywhere from 2 percent of the respondents (in the 1978 dataset) to 14 percent (in the 1990 dataset), with a yearly average of 8 percent of the respondents in the top income category. Some have argued that the 1 percent should be measured by wealth, not income. Unfortunately, the GSS has asked about wealth only once, in 2006. However, as one might expect, family income and wealth go hand in hand: in the 2006 GSS, of those with incomes less than $22,500, 60 percent have wealth of less than $20,000. Of those with incomes of $75,000 and over, 59 percent have wealth of $250,000 or greater.
The chart on the bottom left illustrates the difference between those in the top income category and everyone else on the EQWLTH variable. There is some difference in attitudes, with the rich wanting less government action, as one might expect. However, there is no clear trend: both groups are roughly constant in their support, with a bit more movement up and down among the rich (this could be because they are comprised of smaller sample sizes, though).
How the Rich and the Rest Feel About Addressing Income Inequality
Source: GSS
How Liberals and Conservatives Feel About Addressing Income Inequality
Source: GSS
There’s a second possible cause of differing opinions: political views (see chart on the bottom right of the previous page). Every year, the GSS asks this question: “We hear a lot of talk these days about liberals and conservatives. I’m going to show you a seven-point scale on which the political views that people might hold are arranged from extremely liberal—point one—to extremely conservative—point seven. Where would you place yourself on this scale?”
I examined only those who identified as extremely liberal or liberal (those at points one and two), and those who identified as conservative or extremely conservative (those at points six and seven). Here, we do see a clear trend: the difference between liberals and conservatives has grown considerably over time. In 1978, there was a mere half point of difference, but by 2010 this difference had grown to over two points.
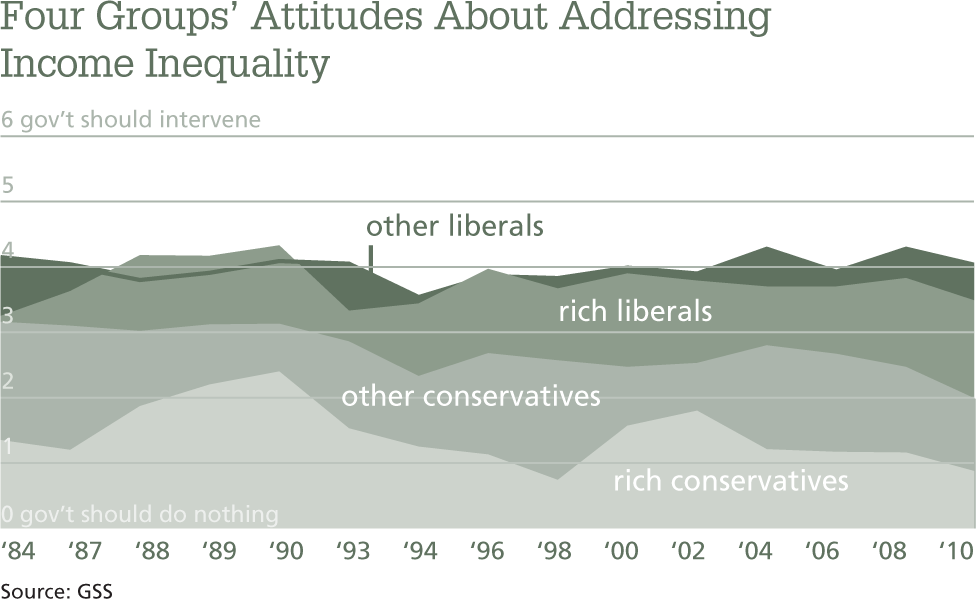
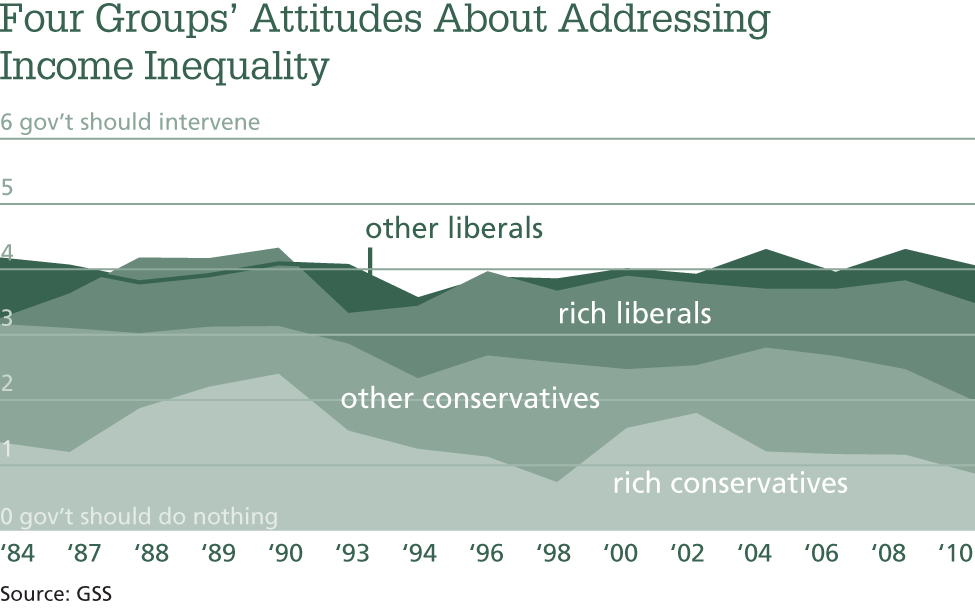
Combining these two effects contributes further insight into this trend. In the chart on the bottom left, I examine four groups: rich (top income category) liberals, other liberals, rich conservatives, and other conservatives. Unfortunately, several years (especially earlier years, when the overall GSS sample was smaller) did not have large enough numbers of each of these groups, so this graph has data from 15 years instead of 20. Several findings jump out from this graph. First, rich liberals and other liberals differ hardly at all. In fact, in four of the years, rich liberals were slightly more in favor of government action than other liberals. Second, rich conservatives have consistently been the most opposed to government action, differing from the other three groups by a wide margin. Third, in recent years, the attitudes of other conservatives have begun to inch toward those of their rich conservative counterparts. This shift, combined with the continuing decline in rich conservatives’ opinions, may account for the growing overall gap between liberals and conservatives.
On the issue of whether government should intervene in the economy, the difference between conservatives and liberals has grown considerably over time.
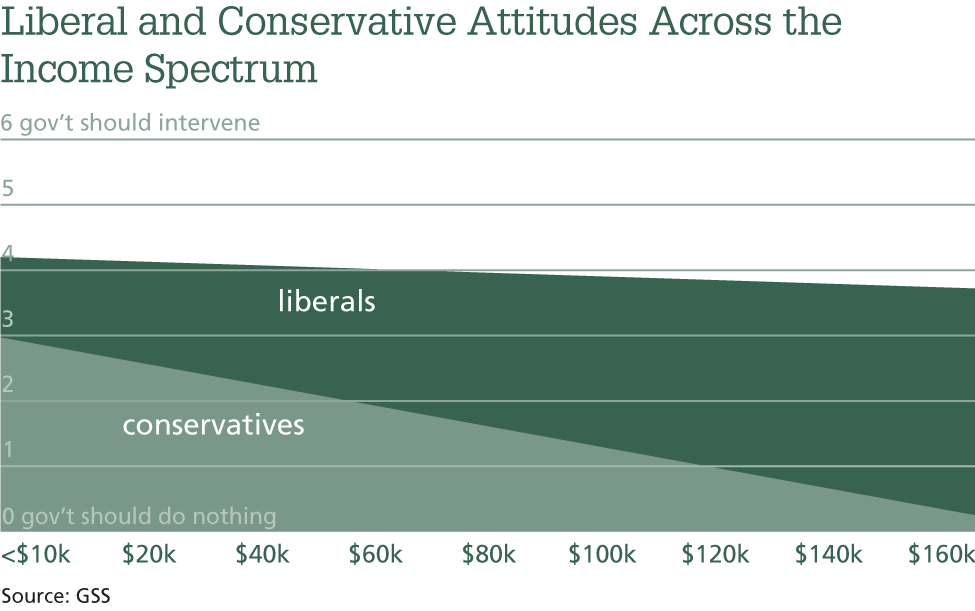
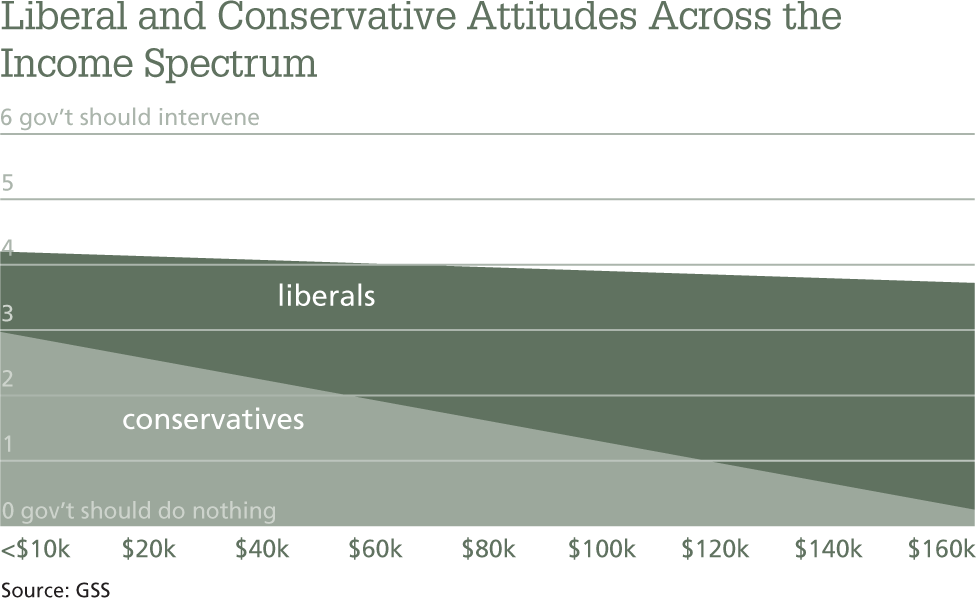
One problem with the 1 percent/99 percent dichotomy concerns the tremendous amount of income variation within that 99 percent. The chart on the bottom right looks at the interaction of income and political views over the entire income range, using data from only the 2010 GSS. Again we see that among liberals, there is hardly any difference in attitudes across the income spectrum. But as income rises among conservatives, support for government action virtually disappears completely. Another way to look at this: among very poor Americans, liberals and conservatives differ by just over a point on the six-point scale, but among very rich Americans, liberals and conservatives differ by well over three points.
These trends have important implications for the continuing concern over income inequality. They certainly reflect the inescapable political chasm in which we are currently mired: conservatives and liberals are moving further apart on this issue. For activists fighting against income inequality, such as those in Occupy Wall Street or related actions, it is important to keep in mind that the “1 percent” is not a conservative monolith. In fact, according to recent GSS data, income and political views are not statistically related at all. If those who want to end income inequality — rich and poor alike — would work together on this issue, the chance for real change may increase. Those from the 1 percent who stand with the 99 percent are a small but potentially important group.
Four Groups’ Attitudes About Addressing Income Inequality
6 gov’t should intervene
Source: GSS
Liberal and Conservative Attitudes Across the Income Spectrum
6 gov’t should intervene
Source: GSS