
Abstract
Social movement scholarship on the emergence of protest has limited engagement with urban scholarship on the spatial production of social relations. Spatial characteristics related to urban form may determine where and how often people gather to protest. This study examines walkability as an urban design feature that may increase protest frequency. Using the 2020 George Floyd protests in the United States, I conduct an empirical between-city case study through a series of negative binomial regressions. I pay particular attention to protests which take place in the public forum, defined as sites which, for symbolic and traditional reasons, are likely to be favored by protestors. Walkability is found to be associated with higher protest frequency both at the citywide and census tract level. Moreover, among cenus tracts, this association holds true in separate analyses of public forum and non-public forum sites. These findings give empirical credence to longstanding theories about the importance of spatial factors in shaping urban social movements and suggest that movement scholars should account for built environment factors when predicting protest. I call attention to several theoretical pathways which, through future research, should be tested as potential causal factors underpinning the relationship observed in this study.
Introduction
Freedom of assembly is a cornerstone for any democratic civil society. An ability to fill public spaces with masses of people is one of the most powerful tools at a social movement’s disposal. Through in-person protests, particularly those which recur over weeks or months, social movements can show that they have a large, united, and sustainable backing that presents a considerable challenge to the status quo. These are among the most important ways a movement can communicate to the public that it is worth taking seriously (Bailey et al. 2023; Tilly 1993, 1999) Protests, therefore, have become an institutionalized feature of the modern American social movement (Tarrow 1994), which can put pressure on governments (Fisher et al. 2019) and influence the views of a wider society (Fazio 2024; Mazumder 2018; Pew Research Center 2023). In recent years, for example, demonstrations about racialized police violence have prompted public discourse about systemic racial inequality and contributed to institutional reform across American cities (Olzak 2021). By introducing a social movement’s claims to a larger audience, protests set the groundwork for a movement’s success (Amenta et al. 2009; McCarthy and McPhail 2006; Tarrow 1994).
Protests have become commonly studied in the sociology of movements. However, the discipline’s theoretical focus on individual-level predictors of protest participation (Caren, Ghoshal, and Ribas 2011; Schussman and Soule 2005), political opportunity structures (Kitschelt 1986; McAdam [1982] 1999; Moss 2016; Vasi et al. 2015; Williams 2023), resource availability (Bailey et al. 2023; Breuer, Landman, and Farquhar 2015; McCarthy and Zald 1977; Walsh 1981), or a combination of the above (Soule et al. 2006; Wang, Piazza, and Soule 2018) remains largely separate from urban sociological (Castells [2003] 2018; Lefebvre [1974] 1991) and wider interdisciplinary (Gül, Dee, and Nur Cünük 2014; Jansen 2001; McGahern 2017; Nejad 2013; Salmenkari 2009; Sewell 2001) perspectives that emphasize the role of the built environment in creating and sustaining protest, with few exceptions (McCarthy and McPhail 2006; Zhao 1998). These perspectives, which conceptualize how social relations are reproduced in physical space, can be bridged with predominant social movement paradigms that emphasize organizational pathways to mobilization.
The built environment regulates collective behavior by placing limitations and permissions on the movement of people. This is where the concept of a walkable city, long championed by urban planners, scholars, and activists, comes in. Walkability, within the context of urban planning, is typically distinguished by short distances between housing, employment, and amenities, as well as dense and well-connected pedestrian paths protected from vehicular traffic (Jacobs 1961; Price 2018). Walkable cities have been connected to beneficial impacts on health, safety, community building, the economy, and the environment (Charron 2017; Freemark and Jenkins 2022) and have gained popular traction beyond urban planning circles (Chamberlain 2022).
In this study, I explore the role of walkable cities in facilitating protest. I conduct empirical analyses of the Summer 2020 George Floyd protests across 118 American cities. Using walk scores collected at the census block group level and geolocated protest events, I conduct negative binomial regressions at both the city and the census tract levels. At the census tract level, I distinguish between tracts which are home to a public forum location and those which are not. These tests reveal a positive association between walkability and protest frequency. Theoretically, I emphasize multiple pathways through which walkability may influence protest. First, walkability may increase the capacity for movement mobilization by facilitating denser networks of social ties. Second, walkable urban design may play a role in protestors’ likelihood of demonstrating at a given location. Protestors value safety, convenience, and visibility—benefits that are often most available in walkable environments. I conclude that the precise mechanisms through which walkability influences protest warrant further study and that social movement scholars can gain a greater understanding of the processes influencing mobilization through the analysis of built environment factors.
Prior Research On Walkability And Protest
Research directly tying walkable spaces to the prevalence of protests is limited. Some studies implicate the built environment in the formation of protest, touching on elements of walkable design without explicitly connecting walkability to their larger argument (Nejad 2013; Zhao 1998). These studies of individual social movements argue that movements strategically use spaces of high pedestrian activity in order to demonstrate (Nejad 2013), but also to recruit and disseminate information (Zhao 1998). Walkability is specifically named in few studies. Among these, Knudsen and Clark (2013) found that neighborhoods with high density, mixed-aged buildings, short city blocks, and high walking levels were associated with a higher prevalence of social movement organizations, opening up the possibility of furthering this link to protests themselves. Németh and Carver (2017) studied the sites of 10 large American protests and found that all of them had high walkability compared to the other areas of their respective cities. However, this is, to my knowledge, the extent of the empirical work on this subject. In the sections that follow, I explore multiple theoretical pathways through which walkability may be expected to influence protest, underscoring the need for more detailed research on the phenomenon.
Walkability, Social Capital, and Mobilization
Walkability and Social Capital
The urban built environment’s importance in shaping social interaction has long been understood (Castells [2003] 2018; Jacobs 1961; Simmel [1903] 2016; Small and Adler 2019). Jacobs (1961) argued that pedestrian-friendly urban environments facilitated an abundance of easy opportunities for individuals to congregate with groups of similar interests, interact regularly with both familiar and new people, and join social networks centered around high profile community members. Even without direct social interaction, high pedestrian activity is thought to passively increase social cohesion through the process of sharing urban space (Castells [2003] 2018; Kanellopoulou 2017) and the tacit collective policing of community behavior (Jacobs 1961). Pedestrian activity is in turn affected by the built environment. Therefore, mixed-use neighborhoods (Jacobs 1961; Small and Adler 2019; Yancy 1983) and public spaces (Castells [2003] 2018; Hampton, Goulet, and Albanesius 2015; Whyte [1980] 2001), which attract a high volume and diversity of pedestrians, have been theorized to foster interpersonal connectivity and a shared sense of belonging in the city. Design features associated with the concept of walkability, such as amenity density, safety from vehicles, directness of routes, and street connectivity have been empirically linked to higher observed pedestrian activity (Frank and Engelke 2001; Frank et al. 2005; Owen et al. 2004; Saelens and Handy 2008), suggesting that cities foster strong social networks when designing for walkability.
Social capital is a broad conceptual tool for measuring the strength and density of social ties in a given place (Coleman 1988). Putnam (2001) argued that changes in the built environment contributed to a decline in American social capital in the late twentieth century. Specifically, he implicated suburbanization, which, by necessitating vehicle travel as the most convenient and safest option for engaging in public life, caused travel to be done primarily within private spaces where engagement with passersby is irrelevant (Leyden 2003; Putnam 2001). Although a sizeable number of studies cast doubt on this link (Jun and Hur 2015; Koohsari et al. 2021; Mouratidis and Poortinga 2020; Wood et al. 2008; Wood, Giles-Corti, and Bulsara 2012), the preponderance of empirical evidence shows positive associations between walkability and social capital (Mazumdar et al. 2018), with specific design features tested including mixed land use (Kwon, Lee, and Xiao 2017; Leyden 2003; Lund 2002, 2003), intersection density (Kwon et al. 2017; Lund 2002), and access to transit stops (Kwon et al. 2017; Lund 2002).
Social Capital and Protest
Just as walkability has been linked to social capital, social capital in turn is commonly linked to more effective collective action, including capacity for protest. In the field of social movements research, both resource mobilization and political process literature link social capital with protest (van Stekelenburg and Klandermans 2013). From a resource mobilization perspective, social movement organizations successfully mobilize by maintaining a wide network of both strong and weak ties, helping groups recruit from and share skills with other movement organizations and non-movement community networks (Coleman 1988; Corrigall-Brown 2021; McCarthy and Zald 1977; Nicholls 2008). In the political process model, in order for a movement to take advantage of a favorable sociopolitical climate, it must have a strong base of established ties from which to recruit (McAdam [1982] 1999). Protest scholarship regularly combines both schools of thought in analyses of how social movement organizations maintain network ties (Wang et al. 2018) and incentivize collective action (Zhuang, Wang, and Li 2023). Beyond the maintenance of interpersonal ties, movements can leverage social capital by maintaining a consistent presence in a community and organizing regular opportunities for collective action (Sampson et al. 2005).
Moreover, urban areas are thought to play a particularly important role for social movements’ ability to transform network ties into action (Castells 1983; Corrigall-Brown 2021; Nicholls 2008; Sassen 2012). Cities give social movement organizations the greatest access to potentially useful ties (Nicholls 2008), helping them mobilize more frequently and survive for longer (Corrigall-Brown 2021). Additionally, at the neighborhood level, the success of community action has been predicated on the dissemination of information through weak ties (Granovetter 1973; Jacobs 1961). Jacobs’ own Greenwich Village successfully defended itself against highway bisection because community figures, such as petitioners and store owners, spread information through their network ties with pedestrians and customers, ultimately resulting in effective community action (Jacobs 1961:70). On the other hand, Granovetter (1973) speculated that social insulation in the West End Italian community in Boston caused it to fail to mobilize against the urban renewal that eventually destroyed it. Therefore, urban design, by facilitating social capital, may influence a social movement’s ability to protest.
Walkability as a Protest Site Consideration
Protest Location and the Public Forum
Protests work because the sheer force of numbers gathered in space is often the main resource at a movement’s disposal to contest a more resource-rich institutional power (Sewell 2001). Choosing an effective site, therefore, is a vital task for protestors. The classic urban theory of representational space refers to how spaces are symbolically reconceptualized through the experiences of those who come in contact with them (Lefebvre [1974] 1991). Building from this concept, protest scholarship has shown how the symbolism of places can be contested through collective action (Endres and Senda-Cook 2011; McCarthy and McPhail 2006; Salmenkari 2009; Sewell 2001). Movements target places that are relevant to their particular cause, because the symbolism of a public space can be invoked, challenged, or reconstructed when a mass of people deliberately interacts with it. For example, protesters often revisit spaces which have become historically affiliated with progress in their cause, such as American civil rights protestors, who continue to have success attracting large crowds to the National Mall (Endres and Senda-Cook 2011; Sewell 2001), or demonstrate in places where they have outsider status in order to forge new alliances and craft symbolic associations (Okechukwu 2020).
In the United States, some of the most common protest sites are located within the public forum. The public forum includes locations such as state capitol buildings, municipal courthouses, sidewalks, streets, and public parks that are codified in American law as the most appropriate spaces for protest because of their long history in shaping civil action (McCarthy and McPhail 2006). Not only does the public forum provide a legally protected, highly visible avenue for protest, but many of these locations are suitable for symbolic challenges against institutions (Sewell 2001).
Strategic Benefits of Walkable Protest Sites
Although protestors in any given city typically choose their site from only a handful of options, particularly from within the public forum, the walkability of these sites may influence which ones are used for demonstrations most often. A government building surrounded by walkable infrastructure, for example, might attract more protests than a government building in a car-dependent environment. Protestors may feel safer demonstrating in a space where they, as pedestrians, have more protection from vehicles, because safety and comfort have been shown to be high priorities for pedestrians (Distefano, Leonardi, and Liotta 2023). Furthermore, walkable environments facilitate all sorts of pedestrian activity; therefore, spots located along the routes of many pedestrians become natural gathering points (Schwartzstein 2020; Sewell 2001) that are convenient for protest and have a high degree of familiarity that lends itself to repeated demonstrations. Finally, protestors may choose more walkable locations because of visibility. By choosing sites where members of the public often come and go, protest organizers strategize to maximize movement interaction with onlookers in order to convey an effective message (McCarthy and McPhail 2006; Sampson 2012; Sewell 2001). The more people walk in an area, the more people become exposed to the protestors’ claims, so combining visible and symbolic locations makes for a particularly potent strategy for protestors (McGahern 2017). Studies have consistently stressed that protest movements are more likely to find success when they maintain a longstanding presence in public civil spaces (Deaton 2015; Salmenkari 2009) and disrupt the structural operations of a city (Nejad 2013), making the movement unignorable to the public and governing institutions. In summary, protesters may choose more walkable locations because of their safety as pedestrian spaces, their accessibility for the largest number of protesters, and their potential to maximize movement exposure.
Case Study: The George Floyd Protests
There has not yet been a large-scale study of protest frequency and walkability, likely because it is rare that a protest event is widespread and sustained enough for meaningful between-city comparisons to be made. I fill that gap through an analysis of protests in the 118 largest U.S. cities during the 2020 Black Lives Matter movement. On May 25, 2020, George Floyd, a Black man living in Minneapolis, was killed while in police custody. This event was captured on video and quickly grabbed national headlines. The resulting protests, calling for racial justice and police accountability, spread quickly to every large city in the country and continued throughout the summer of 2020. Protests were often organized by pre-existing local Black Lives Matter chapters, which had formed before Floyd’s death in response to similar racially charged incidents of police violence. Several million protestors took part in thousands of demonstrations, making the George Floyd protests some of the largest, if not the largest, in U.S. history (Buchanan, Bui, and Patel 2020). They did so despite the severity of the then-ongoing COVID-19 pandemic (Bracci 2020) and the accompanying government restrictions, with many of the cities with high levels of protest (see Appendix A for complete derivation) being located in states with tighter lockdown rules (Leatherby and Harris 2020; Secon 2020). The widespread and sustained nature of these protests makes them a commonality between all major U.S. cities from which to compare protest frequency (see Figure C1 and Map C1).
Because walkability’s influence on protest is understudied, it is an open question how the relationship between the variables may show up in an empirical analysis. One analytical approach is to test the relationship between cities’ aggregate walk scores and the number of George Floyd demonstrations that transpired in each city. However, a city’s walkability is highly variable between neighborhoods, while potential protestors are constrained both by their immediate location and the information they are exposed to (Sampson et al. 2005; Schwartzstein 2020; Zhao 1998). Therefore, I conduct analyses at the census tract and census block group levels of the 118 cities to test whether more walkable neighborhoods saw more protests. Finally, public forum sites are worthy of specific attention because of their attractiveness as protest locations. Walkability may be a moderating factor in how frequently these sites become the target of a protest. My hypotheses are based on these analytic strategies:
H1: More walkable cities will see higher numbers of protests
H2: More walkable neighborhoods will see higher numbers of protests
H2: More walkable public forum sites will see higher numbers of protests
Data and Variables
Dependent Variable—Protests
Protests are my dependent variable. My operationalization of the term is widely inclusive and refers to stationary protests, marches, strikes, rallies, vigils, riots, counter-protests, occupations, and any other event where two or more people occupy public space to make some demand, specifically in this case claims related to racial justice or police accountability. Most protest actions represent different tactics but are fundamentally the same phenomenon of people occupying space to express a grievance, such as comparing a march to a stationary protest. Similarly, distinctions between peaceful protests and riots, where the grievance is subordinate to the crowd’s interest in violence, are difficult to objectively measure, a nuance that is especially important when considering that coverage of race-based protests is often deliberately skewed to make protesters appear more threatening (Dorward and Fox 2022; Wilkinson 2009). To standardize my data by time, I considered an individual protest to involve one group of actors over a maximum period of one day and treated subsequent protest days at the same location as separate protests. Through this method, the most robust protests of the summer, including weeks-long occupations such as Seattle’s “CHOP” autonomous community, were counted multiple times.
The only protests that I did not count were the small number that occurred exclusively online or exclusively in vehicles, since these types of demonstrations are unrelated to walking and moreover are ineffective at occupying public space using the power of crowds. Furthermore, studies of protest emphasize that the in-person component of demonstrations is vital for the interaction between protestors, institutions, and the community (Fazio 2024; Fisher et al. 2019; Mazumder 2018). I narrow my measurement of protests to just their frequency, omitting other outcomes of protest, such as crowd size or success rate. By measuring protests using frequency, I take advantage of the benefits of event count data in analyzing the spatial aspect of social movements (Fisher et al. 2019; Olzak 1989), joining a tradition of research where event counts are used to study the spatial contexts associated with protest (Dorward and Fox 2022; Kelly and Isaac 1984; Williamson, Trump, and Einstein 2018). Furthermore, the ability to sustain protests over time is a key characteristic of effective and visible movements (Mazumder 2018; Olzak 1989).
My protest data come from two sources. The Armed Conflict Location & Event Data Project (ACLED) is a nonprofit that collects global data about political violence and protest events (The Armed Conflict Location and Event Data Project 2019). They rely largely on media sources to collect their data, though they source from other crowd counting databases as well. Protest events within ACLED data contain a date variable, an associated actor variable, and a notes variable. The notes variable provides a human-written summary of the event, including location and protestor claims if these variables are known.
ACLED has accuracy issues (Eck 2012) similar to the known issues with collecting newspaper data (Ortiz et al. 2006), including the data being subject to media reporting bias and incompleteness in the recording of events. Because of the possibility that events in this dataset are undercounted, I use an additional source to build my protest dataset. The online project Crowd Counting Consortium (CCC) has compiled publicly available protest data across all U.S. cities since 2017 by relying on news articles, social media posts, and user submissions to capture events (Pressman and Chenoweth 2023). Their data include protest date, city, location, crowd size, type of demonstration, and protest issues. Each data point also includes source links to the online article or social media post where the information was retrieved from. I used these links in many instances to confirm the accuracy of the CCC’s data. To my knowledge, there are no studies which specifically check the completeness of the CCC’s data collection, but the source has been found to accurately capture protest crowd size by comparing its estimates to cell phone data (Sobolev et al. 2020) and has been used in at least one recent study of Black Lives Matter protests in the United States (Ebbinghaus, Bailey, and Rubel 2025). Both the ACLED and CCC data are collected from a wide array of national and subnational sources, with the ACLED using a list of fixed sources and the CCC having used a web crawler in 2020. This results in the vast majority of protests in both databases being sourced from local news (82.4 percent in the case of ACLED).
Because most of the literature on walkability and social capital focuses on large urban areas, I limited my data collection to cities with over 200,000 people at the 2020 U.S. Census. From this starting point, I excluded three potential outliers: Minneapolis, St. Paul, and Washington D.C. This gave me a total of 118 cities. Next, I limited my data to between May 26 and July 31, 2020, the time period when the majority of Floyd-related protests took place in the United States (Buchanan et al. 2020). The cities in my analysis had a range between 0 and 756 protests during this time period (see Appendix A for complete derivation).
I then excluded all protests in my dataset that were not clearly pro-Black Lives Matter or anti-police brutality events. For the CCC data, I used the claims and issues variables to identify phrases that matched or were similar to “antiracism” or “against police brutality.” For the ACLED data, I used the associated actor variable, which often listed “Black Lives Matter” as an actor, as well as the notes variable. I removed protests that were classified as online protests (n = 3) or car caravans (n = 33), both of which represented a miniscule proportion of the total and were not disproportionately concentrated in any city.
Finally, I combined the protest data from both datasets, taking care to remove duplicates of protest events that were recorded in both. To do this, I cross-checked information on crowd size and arrest estimates contained in both datasets and compared the content of the linked news sources from the CCC dataset and the human-written summaries in the ACLED dataset. Of the 3,867 total protests, 24 percent were only in the ACLED data, 38 percent were only in the CCC data, and 38 percent were in both datasets. Furthermore, location data for each protest was a critical variable of interest (see Map C2 for mapped protest sites in an example city). A total of 486 protests had missing location data, while a further 622 had imprecise location data (e.g., “downtown,” “along main street”), meaning that addresses could not be analyzed for 28.7 percent of the protests.
Independent Variable—Walkability
Walkability is the primary independent variable for my study. The National Walkability Index developed by the EPA (Environmental Protection Agency 2021) is one of the most prominent tools available to researchers studying walkability. It is currently in its second iteration, published in 2021. It collects data at the census block group level and assigns each block group a walk score between 1 and 20. I use both the walk scores the tool provides at the census block group level as well as walk score averages at the census tract and city levels. This method created city-level walk scores that are high in construct validity, as they displayed a 0.787 correlation with the corresponding scores from the WalkScoreⓇ tool, another prominent index of U.S. walkability (Walk Score 2024). The EPA index has also been found to be an accurate predictor of actual walking by Americans, both for transportation and leisure purposes (Watson et al. 2020). Finally, the variables the index uses in calculating walkability are intersection density, proximity to transit stops, and employment and household mix. These are consistent with the contentions made by Jacobs’ school of thought on walkability as well as indices constructed in later research (Frank et al. 2005; Jacobs 1961). These multiple avenues of validity make the index a strong choice for inclusion in the analysis.
There is no empirical consensus on whether walkability as a concept can be separated from public transit quality. Despite measuring two different forms of transportation, walkability and public transit have a strong synergetic relationship. Transit use requires people to walk, while a prerequisite to strong walking environments is often transit connectivity (Ewing and Cervero 2010). Therefore, some researchers use access to transit as part of their measure of walkability (Watson et al. 2020; Wo and Kim 2023; Wood et al. 2008) while others do not (Frank et al. 2005; Jun and Hur 2015; Koohsari et al. 2021; Kwon et al. 2017). This case study, however, provides an opportunity to decouple the effects of walkability from the effects of transit, because COVID-19 lockdown measures and behavioral changes gutted transit ridership during the summer of 2020 (Parker et al. 2021; Qi et al. 2023), even in comparison to the pandemic’s impact on foot traffic (Wilbur et al. 2023).
Control Variables
I included control variables based on sociological and social psychological theories on what drives people to protest. Social identity theory, which holds that members of a threatened identity will protest on behalf of that identity, suggests that in this case cities with higher proportions of Black residents will protest more (van Stekelenburg and Klandermans 2013). Pre-George Floyd Black Lives Matter protests were found to more likely occur in cities with more reported officer-involved fatalities involving Black victims (Williamson et al. 2018). Movement scholars also use the concept of biographical availability (McAdam 1986) to predict protest, hypothesizing that people who are younger, unemployed, or have lower income are more likely to protest because they have less to lose from doing so and also have more time (Schussman and Soule 2005). Prior research also suggests that protesting is a tool used more often by the political left (Schussman and Soule 2005), and this is certainly true for the Black Lives Matter protests, which American Democrats are more sympathetic toward than Republicans (Pew Research Center 2023). Finally, though population density itself is often considered a component of walkability (Mazumdar et al. 2018), the EPA index does not include it in its calculations, making it a testable question as to whether walkability predicts protest independently of density.
I controlled for the following variables: percent Black alone, reported officer-involved fatalities (of any race) between 2013 and 2020, percent Democrat, population density, and a composite biographical availability variable. This composite was created from additional relevant demographic variables to avoid redundancy and keep the control selection manageable. To construct it, correlations between median household income, unemployment rate, median age, education (as measured by percent of residents with at least a bachelor’s degree), and income inequality (as measured by the Gini index) were assessed using a principal component analysis. The PCA revealed a strong correlation between income, unemployment, and education (see Appendix A for complete derivation). These three variables were then standardized and averaged (changing unemployment rates to employment rates) to create the biographical availability variable, while age and income inequality, in consideration of the small sample size of the model, were dropped.
Race, income, unemployment, education, income inequality, and age data were taken from the 2019 ACS (U.S. Census Bureau 2019). Officer-involved fatalities were obtained through the database Mapping Police Violence, and the year 2013 was determined because the database tracks fatalities starting from that year (Campaign Zero 2023). I divided these counts by the city population in 2020 to get rates. Percent Democrat was operationalized as the percentage of voters who voted for Hillary Clinton in the 2016 presidential election, since this election was the closest immediate predecessor to the protests. This information was calculated at the city level by collecting election shapefiles from the nonpartisan Redistricting Data Hub repository (Redistricting Data Hub 2024), then using ArcGIS to aggregate precinct-level results onto the borders of census block groups, tracts, and cities in the dataset. City boundaries were obtained from a separate shapefile created by the U.S. Department of Health and Human Services (U.S. Department of Health and Human Services 2023). Finally, population density was obtained from the 2020 census (U.S. Census Bureau 2020).
Analytic Strategy
Within-city Analysis
I conducted three separate analyses to test the relationship between walkability and protest. While the latter two tested my hypotheses explicitly, the first analysis was a preliminary step in establishing the existence of a phenomenon linking walkability to protest. This first model involved testing whether Black Lives Matter protestors usually congregated in walkable locations within their own cities. This was accomplished by taking a selection of cities from my database, calculating the average walk score between all protest locations, and comparing it with the average walk score of each city’s census block groups.
For this analysis, I include every city that had at least 10 protests in both public forum and non-public forum locations and had recorded addresses for at least 80 percent of their protest data. I adopted these selection criteria to ensure I was able to test for both public forum and non-public forum effects while keeping missing data to a minimum. This resulted in an analysis of 11 cities that accounted for 1,484 protests, or 38 percent of the total. From my protest dataset, I took all protests in these cities with location information and used Google Maps to obtain their precise addresses. I then used the National Walkability Index to find the walk score for the block group of each address. When a protest event spanned multiple locations, I averaged the walk scores of those locations.
City-level Analysis
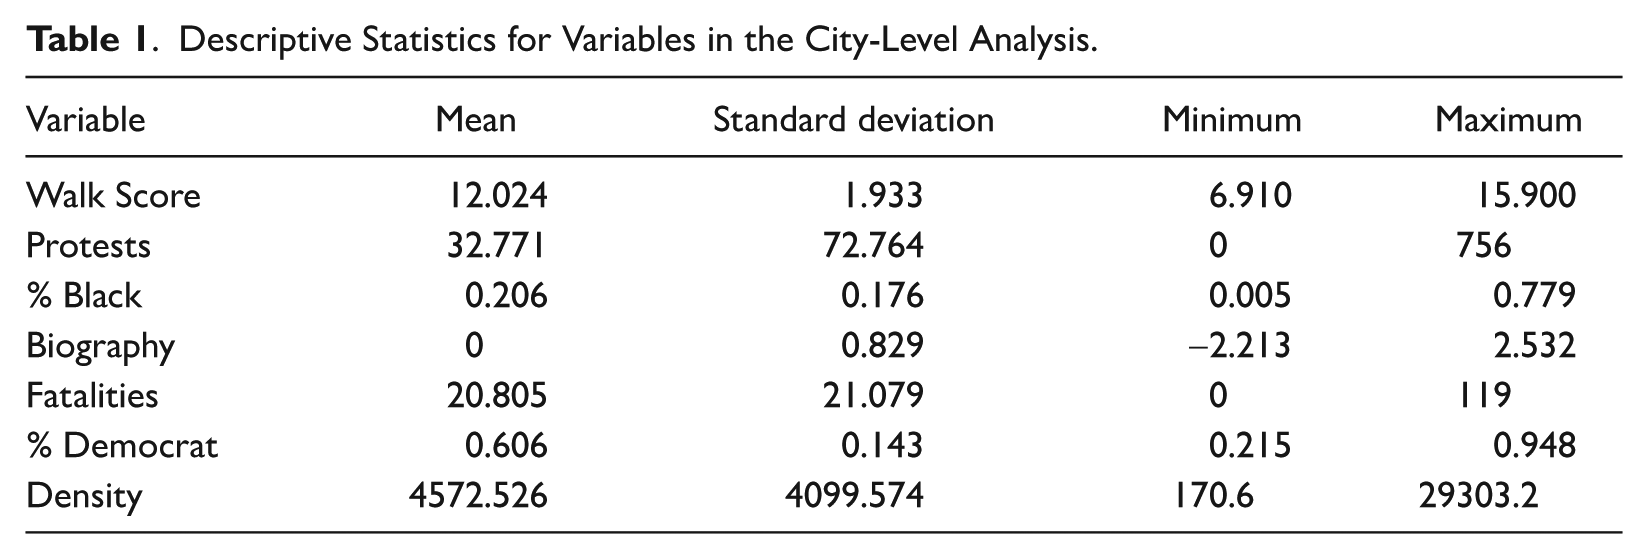
My second model tested H1 by using the city as the unit of analysis. I operationalize a city’s overall walk score as the average walk score of all its census blocks groups, and, for the dependent variable, include the full count of protests in every city. Per capita rates of events such as protest are best analyzed using the Poisson family of regressions to account for OLS violations of normal distribution of data and homogenous error variance (Osgood 2000). These specific protest data are overdispersed (see Table 4), making a negative binomial regression an appropriate model for this analysis. City population size as of the 2020 census was included as an exposure variable in this regression to account for protest rates. I regress protests on the citywide walk score averages using this exposure variable and the previously discussed control variables. I also use a state capital dummy variable (1 = state capital, 0 = not a state capital) in order to account for the natural imbalance in public forum locations that are in capital cities. All independent variables were standardized for city-level and neighborhood-level models (see Table 1).
Descriptive Statistics for Variables in the City-Level Analysis.
Neighborhood-level Analysis
My final analysis tested H2 and H3. This analysis involved two regression models, one within the universe of census tracts containing at least one public forum location (“public forum sites”), and one consisting of all the non-public forum census tracts (“neighborhoods”). Instead of running a single model, I argue that the underlying factors influencing protest formation at public forum sites are different from those influencing neighborhoods, meaning separate regressions are better suited to capture the heterogeneous effects of the independent variables on protest. Of the 2,759 protests with location data, 1,590 (57.6 percent) were in the 312 census tracts with a public forum location, meaning that more than half of protests were located in just 1.5 percent of all 21,421 tracts. Furthermore, public forum protests are likely to attract a more geographically dispersed constituency from within cities, meaning neighborhood-level control variables may matter less in the public forum model than the non-public forum model. A single model with an interaction term for public forum site and walk score would be insufficient to account for these vastly different contexts.
To determine what constituted a public forum site, I created categories for five different location types and counted the protests that occurred in these locations. These five public forum location types were:
City halls
City or county courthouses
Police headquarters
Public parks or plazas
State capitol buildings
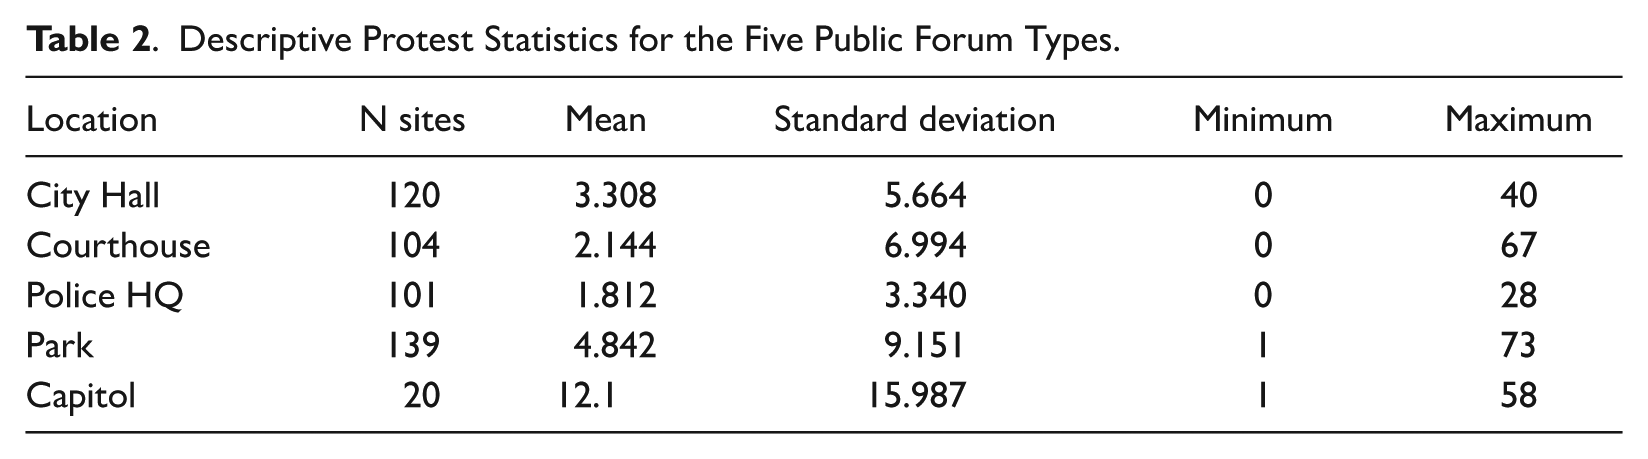
All five location types are considered part of the public forum (McCarthy and McPhail 2006). Furthermore, because most of these locations represent institutions the protestors were attempting to engage with, they constitute places with symbolic meaning (Endres and Senda-Cook 2011). City halls and state capitols represent governments, courthouses represent institutions of justice, and police headquarters represent a direct confrontation with the systemic racial violence the protestors stood against. Parks and plazas are more variable in their symbolic meaning, depending on what locations they are close to or what monuments and other symbols they contain. However, protestors may also choose these locations for their ability to accommodate large crowds. Specifically for this category, I only counted parks or plazas that saw multiple protests, only including those with a single protest if no others in that city saw more. This step ensured that, instead of having endless parks in my dataset that were not used for protest, I only captured parks that the public had deemed to have some value for protesting. This process resulted in some cities contributing multiple parks to the final analysis while others contributed none (see Table 2). For all the other location types, I added them to the dataset even if there were no protests at that spot in a city.
Descriptive Protest Statistics for the Five Public Forum Types.
Sometimes, two or more of the location types would be in the same spot. For example, a police headquarters might be located inside a courthouse, or a public park might be just outside the city hall. If a park was directly facing one of the other location types, that park was considered a constituent part of that other location type, and I would not separately categorize it as a park. If two of the other location types were either (a) in the same building or (b) facing the same street segment, I would consider these protests as having taken place at whichever location type was more prominently referenced in the dataset’s notes (e.g., “protestors gathered at city hall”).
The census tract was the unit of analysis for these regressions. Besides the state capital dummy variable, I include all control variables from the city-level analysis using TIGER shapefiles (U.S. Census Bureau, N.d.). I used the spatial join tool in ArcGIS to convert my census block group variables to census tract variables, creating averages or summed values as appropriate. Because voting precincts specifically are not aligned with census tract borders, every spatial join for a given census tract included the values from every precinct at least partially located within it. I used the resulting sums to derive approximate percent Democrat voting rates for each tract. Because the protest data are overdispersed (see Table 5), a negative binomial regression remains an appropriate model for this analysis. Officer-involved fatalities remained a city-level control, as did the city population exposure variable.
Supplemental Analyses
In addition to the main models, I ran three supplementary analyses to test the robustness of my theoretical framework. One analysis was at the city level, where I created alternate dependent variables for the protest count, one which counted only public forum protests and one which counted only non-public forum protests. This tested a potential confounder in the city-level analysis, in which high citywide walk scores may only represent the ability for people to mobilize in the highly walkable, downtown public forum areas (see Table B1).
I also conducted two analyses where protests were measured at the specific addresses of each public forum location. The unit of analysis, therefore, was each public forum location itself, along with control variables calculated at the census block group level. To do this, I restricted protests to only those which occurred in the public forum and estimated a model in which the five public forum location types were coded as dummy variables, with courthouses being the reference category (see Table B2). This analysis supplemented my neighborhood-level analysis by testing whether my public forum data at the census tract level were skewed by census tracts where multiple public forum locations were situated. Finally, I reran this model but held all control variables at their citywide values, such that, for example, if a protest happened at Chicago’s city hall, the control variables would reflect the values for Chicago as a whole, not the city hall’s census block group (see Table B3). This tested the possibility that many, if not most, protesters travel to public forum sites from all over the city, not just from the immediate neighborhoods of these locations. The results from all three supplemental analyses showed positive associations between walkability and protest and are reported in an Appendix (see Appendix B for complete derivation).
Results
Within-city Analysis
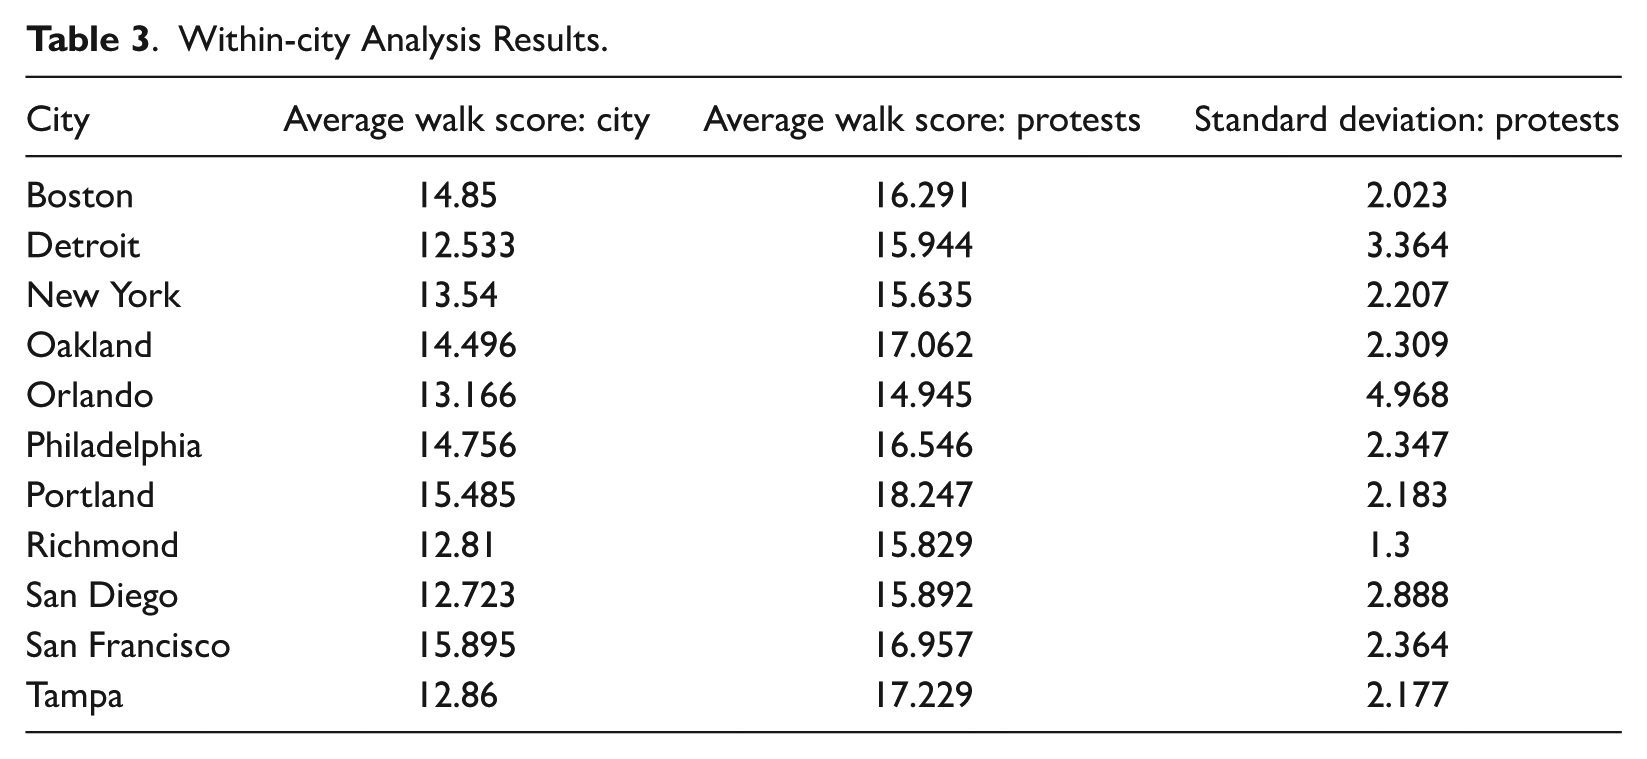
For each of the 11 cities in the within-city analysis, the average walk score of their protest locations was higher than the average walk score of the city overall (see Table 3). For six cities (Detroit, Oakland, Portland, Richmond, San Diego, and Tampa), this discrepancy was pronounced by at least one full standard deviation. This preliminary test of the relationship between walkability and protest reveals a strong tendency for protestors to gather in relatively walkable locations within any given city. Although this provides crucial practical information about the nature of urban protest, a potential confounder exists for this analysis. It may be that protestors targeted areas not because of their walkability, but because highly visible public forum locations are typically found in downtowns and other locations that usually exhibit high walk scores. The neighborhood-level analysis investigates this possibility.
Within-city Analysis Results.
City-level Analysis
H1 predicted that citywide walk score averages would be a predictor of greater protest frequency for each given city. In the city-level analysis, walk score displayed a positive relationship with protest frequency (p < .001), supporting H1 (see Table 4). When introducing control variables to the model, the effect size of walkability on protest becomes smaller but retains its statistical significance. Several control variables were significant in the city-level model: percent Black (p < .001), biographical availability (p < .01), and the state capital dummy (p < .001) were all positive predictors of protest frequency.
City-level Regression Results.
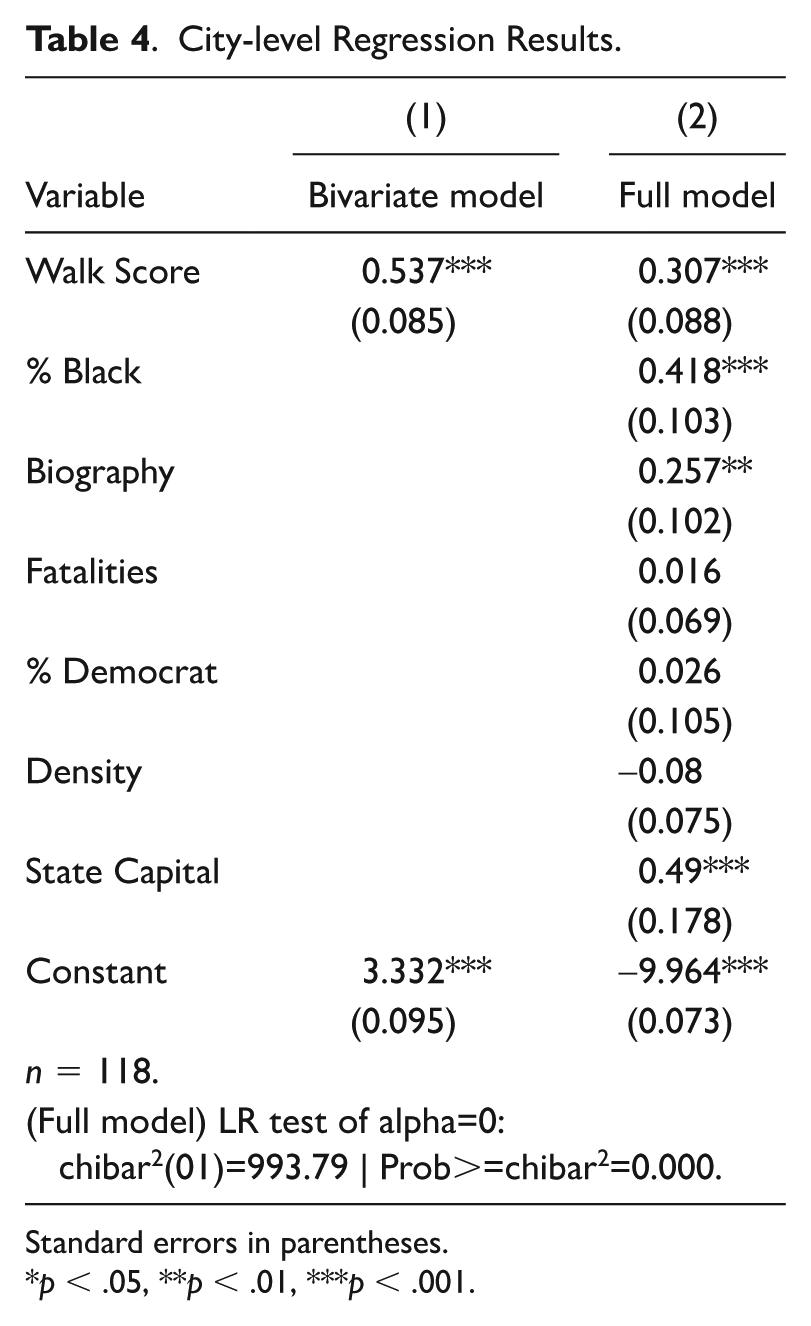
Standard errors in parentheses.
p < .05, **p < .01, ***p < .001.
Neighborhood-level Analysis
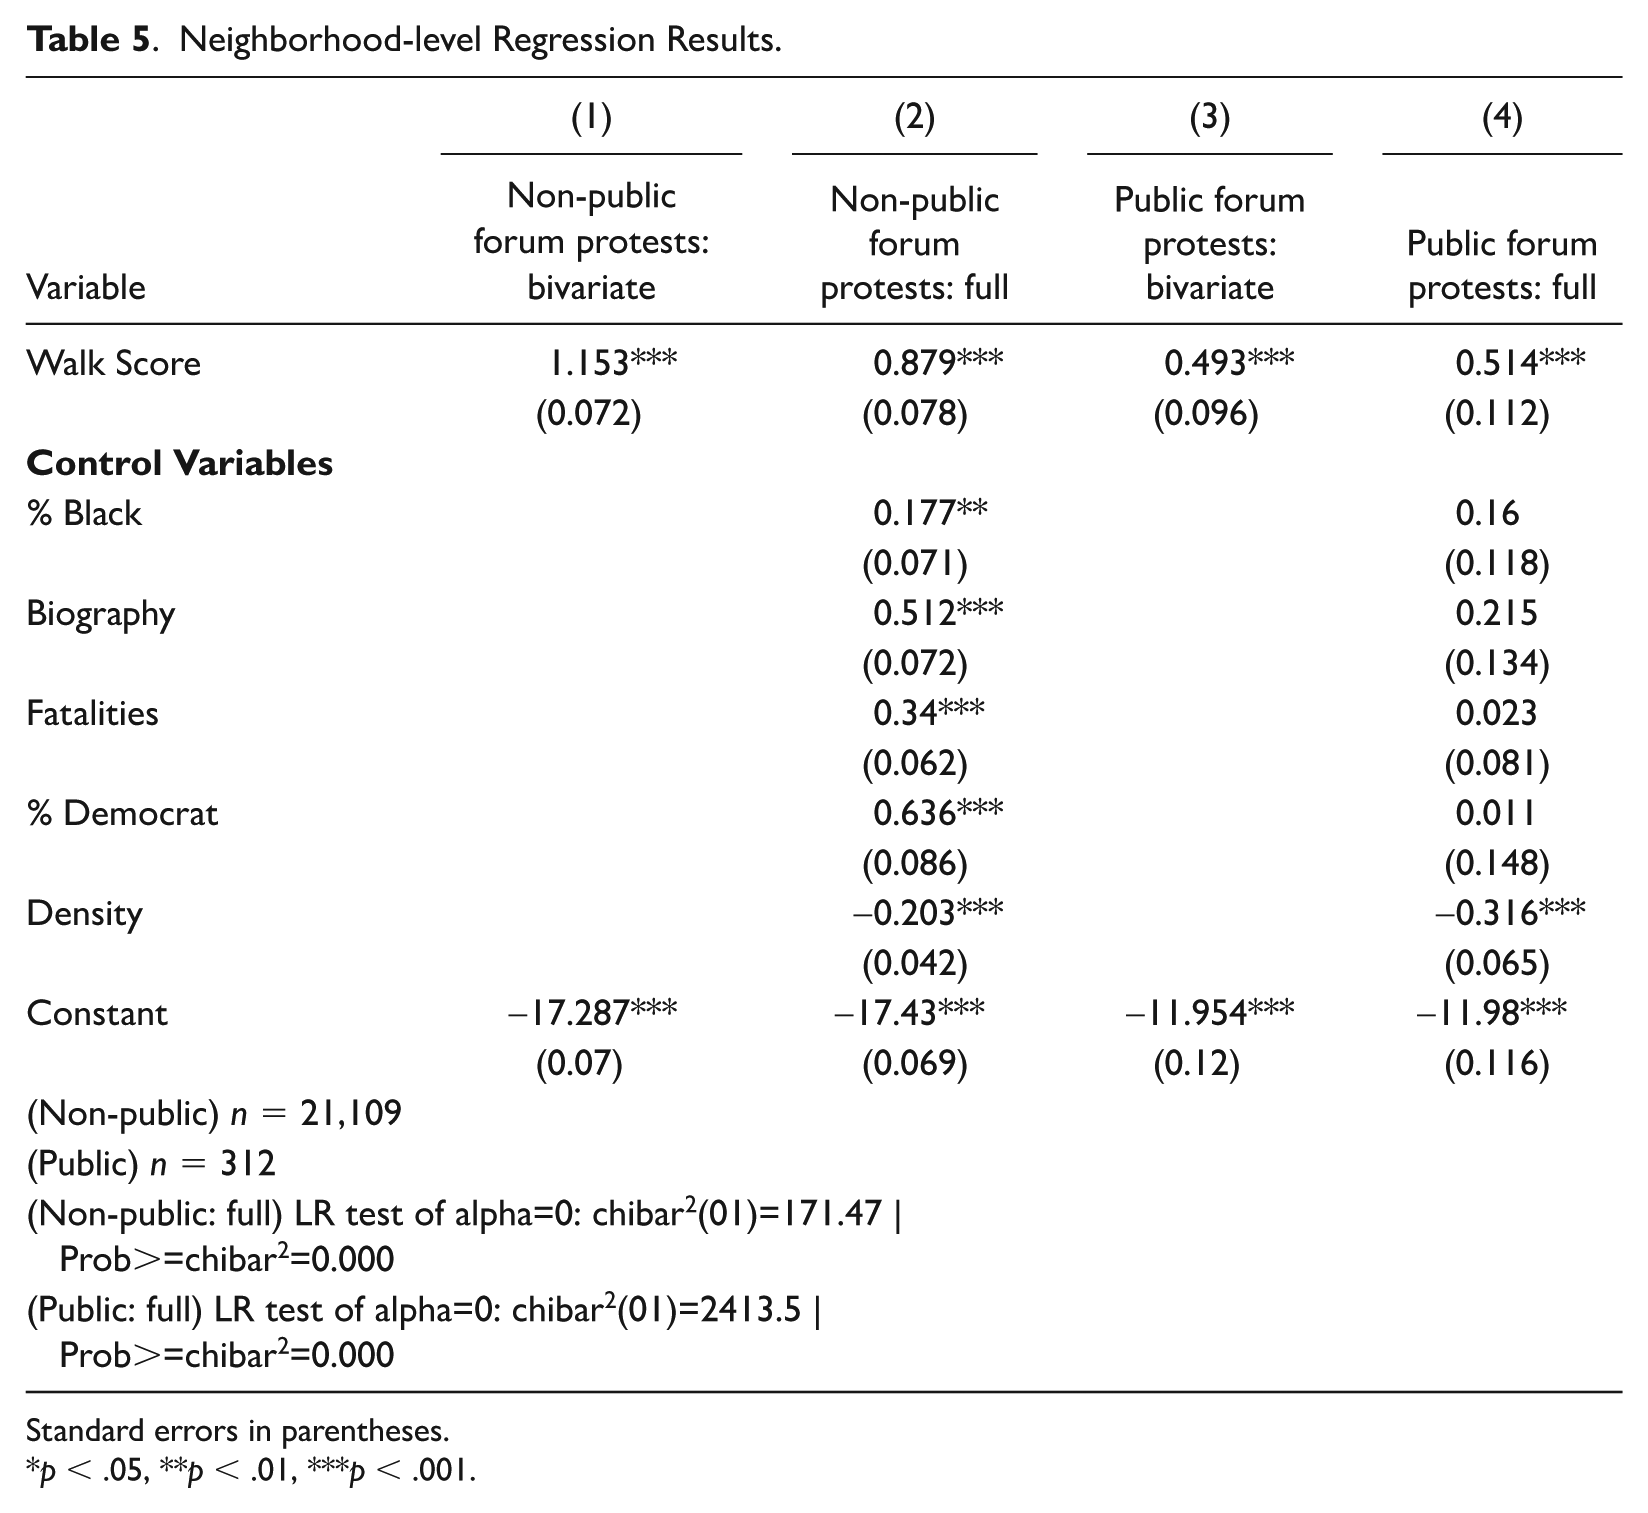
H2 predicted that higher walkability in neighborhoods would be associated with higher protest frequency. The results from models 1 and 2 support H2 (see Table 5), showing that walk score was positively associated with protest frequency among census tracts where a public forum location was not present (p < .001). Relatedly, H3, which predicted that higher walkability at public forum sites would be associated with higher protest frequency, was supported by models 3 and 4 (p < .001). Independent of walkability, population density was negatively associated with protest frequency in both full models (p < .001), while percent Black (p < .01), biographical availability (p < .001), officer-involved fatalities (p < .001), and percent Democrat (p < .001) were all associated with higher protest frequency in neighborhoods but not at public forum sites. Neighborhood protests likely attract a very local crowd, while public forum sites likely attract more protestors from the wider city, meaning that the immediate demographics of the census tract matter more for neighborhood protest formation.
Neighborhood-level Regression Results.
Standard errors in parentheses.
p < .05, **p < .01, ***p < .001.
Discussion and Conclusion
Through a case study of the George Floyd protests in the United States, this study provides evidence that walkable urban design contributes to higher numbers of protests. This relationship held true both when examining cities on the whole and also at the neighborhood level, represented by census block groups and census tracts. These results most directly contribute to the nascent literature directly tying walkability to social movements. While Németh and Carver (2017) showed that singular protest sites in each of their 10 cities had walk scores greater than the cities’ respective averages, I calculated walk score averages for 1,484 protests across 11 cities in the within-city analysis, reinforcing their finding with a more comprehensive methodology. The results also augment Knudsen and Clark’s (2013) argument that walking builds social movements by showing that walkability is associated not just with the presence of social movement organizations but also higher protest frequency. This study builds upon interdisciplinary literature on the value of urban space for civil society (Deaton 2015; Gül et al. 2014; Jansen 2001; McGahern 2017; Nejad 2013; Salmenkari 2009) by conducting an extensive intercity empirical analysis, a contrast to the existing literature’s emphasis on in-depth analyses of small sample sizes, and by identifying walkability as an underlying feature of how spaces acquire protest value.
The association between walkability and protest frequency was robust, showing up in every single analysis I conducted, including all supplementary tests. This study, therefore, demonstrates not only an association between walkability and protest, but identifies how this association occurs at multiple scales. Walkable cities saw more protests than more car-dependent cities. More walkable neighborhoods, likewise, were more likely to host protests. Finally, among public forum sites, where a majority of large city George Floyd protests took place, demonstrations were most frequent at sites with the highest walkability.
Although this study provides novel and suggestive evidence, there is still much work to be done to establish the precise causal mechanisms underpinning this relationship. A few guideposts offered here could inform future research. For example, because prior work connects walkability and social capital (Kwon et al. 2017; Leyden 2003; Lund 2002, 2003; Mazumdar et al. 2018), social movements could be leveraging high social capital by disseminating information through weak ties (Granovetter 1973; Jacobs 1961; Putnam 2001; Zhao 1998). Movements may find it easier to build and maintain organizational infrastructure (McAdam [1982] 1999; McCarthy and Zald 1977; Sampson et al. 2005) in pedestrian-friendly built environments. Research should also further investigate the intersection between locational symbolic value (Endres and Senda-Cook 2011; Lefebvre [1974] 1991; McCarthy and McPhail 2006) and strategic value (Deaton 2015; Nejad 2013). Because walkable locations are convenient gathering points, safe for pedestrians, and highly visible to the public, walkable public forum locations may be the most valuable protest sites of all. In sum, the social capital and strategic benefits of walkable places warrant detailed exploration as possible pathways connecting them to protest.
More broadly, this study demonstrates the value of considering the spatial aspect of demonstrations for sociologists who study social movements. Much of the current sociological literature on movements is underequipped to understand spatial differences in the success and failure of movement mobilization. Scholars who study the emergence of protest often focus on political opportunities at the state level (Kitschelt 1986; McAdam [1982] 1999; Moss 2016; Vasi et al. 2015; Williams 2023), movements and their mobilization of resources (Bailey et al. 2023; Breuer et al. 2015; McCarthy and Zald 1977; Walsh 1981), or personal predictors of protest at the micro level (Caren et al. 2011; Schussman and Soule 2005; van Stekelenburg and Klandermans 2013), all of which tend to obfuscate the role the built environment plays in fostering mobility. However, these theoretical tools are well-equipped to synergize with the extant literature in urban sociology and geography (Castells [2003] 2018; Lefebvre [1974] 1991) to more comprehensively study social movements.
For democratic civil society, this research contributes to understandings of how to protect free speech by recognizing attacks against it. Governments, especially in the era of democratic backsliding, have proven willing to adopt urban planning strategies specifically to counter the most decisive built environment impacts on protest (Ellis 2022; Menshawy 2021; Schwartzstein 2020; Sewell 2001). These processes involve restricting access to pedestrian-friendly public squares, moving government infrastructure to remote, inaccessible locations, and encouraging sprawling design that favors the movement of cars over people. The public should be aware of the implications of these efforts for democratic feedback loops. The ability to mobilize a crowd to take up public space is one of the most important tools available to social movements to communicate grievances to the public and affect policy change. In the United States and elsewhere, vigilance in preserving these spaces will help keep states accountable and keep the public engaged in protecting democracy.
Footnotes
Appendix A
Appendix B
Appendix C
Acknowledgements
I would like to thank Corina Graif, Louisa Holmes, Charles Seguin, and Ashton Verdery for their feedback on this paper. I would also like to thank Sheridamae Bondoc Gudez, Tim Prestby, and the Donald W. Hamer Center for Maps and Geospatial Information for their guidance on mapping and geospatial analysis.