
Abstract
Drawing on 35 years of restricted geocoded National Longitudinal Survey of Youth (NLSY) data, we estimate the association between multigenerational exposure to neighborhood disadvantage in childhood and income in adulthood. Invoking cousin fixed effects models that adjust for unobserved legacies of disadvantage that cascade across generations, we find that families where both mothers and their children are exposed to childhood neighborhood disadvantage yield reduced earnings, net of observed and unobserved confounders, for all groups except for Blacks. We theorize that discrimination and racism salient for Blacks in the labor market may dim the ability of neighborhood attainment to act as a main pathway to social and economic mobility. These results push scholars to conceptualize neighborhoods as much more durable features of inequality and refine our understanding of the uneven economic returns to neighborhood attainment across race and ethnicity.
Introduction
The vast neighborhood effects literature has established that neighborhood disadvantage diminishes opportunities for social advancement (Massey 2013; Harding Sharkey and Faber 2014) and that exposure to neighborhood disadvantage in childhood reduces earnings in adulthood (Alvarado 2018; Chetty, Hendren, and Katz 2016; Vartanian and Buck 2005). However, scholars mostly focus on neighborhood disadvantage within a single generation (Alvarado 2016a; Chetty et al. 2016; Diez-Roux and Mair 2010; Harding 2003; Massey and Denton 1993; Sampson 2012; Sampson, Morenoff, and Gannon-Rowley 2002; Sharkey and Faber 2014; Small and Newman 2001; Tienda 1991; Wilson 1987; Wodtke and Parbst 2017). We argue that an examination of intergenerational neighborhood processes on economic outcomes will provide a more complete picture of neighborhood influence and will expand our understanding of how inequality forms and is maintained over time.
Heeding Sharkey’s (2008, 2013) call to use a multigenerational lens in neighborhood research, we focus on the relationship between exposure to disadvantaged contexts across successive generations and economic outcomes to investigate the following two research questions:
We contribute to research on multigenerational neighborhood associations in several ways. First, we include a novel outcome, adult income of the children nested in the third generation. Second, we use data and methods that ameliorate concerns about selection bias. We use federally restricted geocoded data from the National Longitudinal Survey of Youth (the NLSY 1979 [NLSY79] and NLSY Children and Young Adult [NLSY:CYA] cohorts). A unique feature of these data is that they allow us to link neighborhood conditions with economic outcomes across three generations. We therefore can use cousin fixed effects (FE) models—which address unobserved confounding in the grandparent generation—to estimate neighborhood associations. Examples of unobserved confounders that our model controls for include one’s inherited genetic composition and the legacy of historical segregation arising from racist school and housing policies implemented prior to Brown v. Board of Education (1954) and the Fair Housing Act (1968). Our statistical strategy guards against the fact that grandparents who experienced such discrimination may have subsequently passed down the negative effects of this trauma to descendants. Third, we answer the call by neighborhood scholars to examine heterogeneous patterns by race and ethnicity (Sharkey and Faber 2014).
Although single-generation researchers have examined racial and ethnic heterogeneity in neighborhood effects (Alvarado 2020; Brooks-Gunn et al. 1993; Chetty et al. 2016; Levy, Owens, and Sampson 2019; Turley 2003), multigenerational researchers have yet to incorporate Latinos into their models (Sharkey and Elwert 2011). Latinos are critically important to include in studies of neighborhoods given their high levels of segregation and high degree of exposure to neighborhood violence, toxins, and rapidly growing ethnic isolation in schools in the United States (Fry 2007; Orfield et al. 2014). Our study is further motivated by the finding of suppressed effects of increased human capital investments for racial minorities—particularly for Black individuals—that suggests that racism remains central to understanding the process of economic attainment in the United States (Blau and Duncan 1967; Crowder, South, and Chavez 2006; Drake and Cayton 1945; DuBois 1903; Logan and Alba 1993; Patillo 1999, 2007; Turley 2003).
The intergenerational perspective views neighborhoods as enduring structures of inequality (Sharkey 2008). This understanding is essential because repeated versus episodic subjection to environmental toxins, crime, and divested institutional resources endemic to disadvantaged neighborhoods may undermine a range of parent-child dynamics crucial to successful child development and hinder the availability of resources that parents can draw from to support the socioemotional well-being and physical health of their children. We call this intergenerational process the “echo of neighborhood disadvantage”.
Our results indicate that family lineages where both mothers and their children are exposed to neighborhood disadvantage in childhood yield reduced earnings in adulthood, net of observed and unobserved confounders. However, we also find that neighborhood disadvantage associations with adult earnings are attenuated for Black respondents. These null results for Black families are in stark contrast to–and are rendered ever more pronounced by– the fact that we do find statistically significant neighborhood associations with developmental outcomes in adolescence for Black children. These findings simultaneously foreground neighborhoods as durable features of inequality and refine our understanding of the uneven economic returns to neighborhood attainment across race and ethnicity.
Theoretical background
Despite decades of single-generational research, neighborhood scholarship largely elides multigenerational dynamics. The burgeoning body of research on multigenerational neighborhood effects focuses on outcomes like neighborhood attainment, cognitive skills, and educational outcomes, rather than income. This omission is due, in part, to the fact that income-based measures often reflect a complex combination of cognitive, socioemotional, health, education, household structure, and labor market factors—inputs that may themselves be shaped by neighborhood contexts in distinct ways. Moreover, income-based analyses can be contaminated by lifecycle bias. Finally, and perhaps most importantly, selection bias is a concern for researchers evaluating the evidence of neighborhood effects on adult economic outcomes in nonexperimental settings (Harding et al. 2023). Our research design helps to overcome many of these major challenges to studying the relationship between neighborhood contexts and economic outcomes. Moreover, the structure of our data and size of our sample enables us to examine heterogeneous patterns by race and ethnicity, which many scholars have called for (Sharkey and Faber 2014), but only a handful have actually attempted (Alvarado 2020; Brooks-Gunn et al. 1993; Chetty et al. 2016; Crowder and South 2003; Levy et al. 2019; Sharkey and Elwert 2011; South and Crowder 1999; Turley 2003).
Neighborhood Disadvantage and Economic Stratification
Neighborhood contexts are a key driver of economic outcomes because they often serve as conduits to essential resources (Alvarado 2018; Chetty et al. 2016; Galster and Santiago 2017; Vartanian 1999; Vartanian and Buck 2005). 1 Early findings from randomized control trial studies, like the Moving to Opportunity (MTO) project, suggest that the effects of neighborhood disadvantage on adult economic outcomes are modest or null (Clampet-Lundquist and Massey 2008; Katz, Kling, and Liebman 2001; Kling, Liebman, and Katz 2007; Ludwig et al. 2013; Sanbonmatsu et al. 2011). However, Chetty et al. (2016) find that MTO children who move at young ages experience increases in their adult incomes. Chetty and Hendren (2018) also find that moving to (and staying in) less-poor commuting zones, especially at young ages, increases children’s adult incomes. Similarly, Alvarado (2018) and Vartanian and Buck (2005) find that growing up in disadvantaged neighborhoods in childhood and adolescence is negatively associated with economic well-being in adulthood, net of unobserved family confounders. Moreover, Chetty et al. (2014) find that clusters of opportunity are embedded within the U.S. residential landscape and shape economic mobility. In short, recent studies that rely on both experimental and observational data suggest that childhood neighborhoods matter for adult income earnings.
A Multigenerational Perspective of Neighborhood Associations
Mare (2011) noted the conspicuous absence of neighborhood studies in his summary of the emerging literature examining inequality with a multigenerational design. As other studies on multigenerational associations of individual-level background measures have proliferated in the United States (Pfeffer 2014; Pfeffer and Killewald 2018, 2019; Song 2016; Song and Mare 2015, 2019) and abroad (Chan and Boliver 2013; Hertel and Groh-Samberg 2014; Roksa and Potter 2011; Solon 2014; Song, Campbell, and Lee 2015; Zeng and Xie 2014), the literature on neighborhood effects has remained mostly single-generation focused. This is unfortunate because (1) neighborhood stratification is integral to shaping long-term inequality, (2) theories that scholars often use to explain neighborhood associations naturally lend themselves to a multigenerational design, and (3) longitudinal data are currently available to empirically estimate multigenerational neighborhood associations. 2
Figure 1 illustrates our multigenerational approach. Here, we build on Sharkey (2013, Figure 5.6, Panel b) to present the processes undergirding the multigenerational association between neighborhoods and income. A parent’s own childhood neighborhood may impact a child’s childhood neighborhood through intervening mechanisms of economic conditions, educational and occupational attainment, health outcomes, and parenting styles. A child’s childhood neighborhood may similarly be related to his or her own adult income through human capital accumulation, exposure to violence, health outcomes, and peer effects. In this way, both a parent’s and child’s childhood neighborhoods may aggregate—and perhaps even multiply—to impinge on future earnings. These processes may be mitigated by structural racism in the labor market that can introduce headwinds to economic success, particularly for Black Americans. Thus, the multigenerational association between neighborhoods and income may differ by race and ethnicity. This approach allows us to examine whether previous findings regarding the intragenerational associations between childhood neighborhood disadvantage and adult income are sensitive to controlling for unobserved confounders nested in previous generations (Alvarado 2018; Chetty et al. 2016; Vartanian and Buck 2005). Our multigenerational approach also disentangles children’s and parents’ childhood neighborhood contexts and, most importantly, examines how successive generations of immurement in distressed social settings are meaningful.
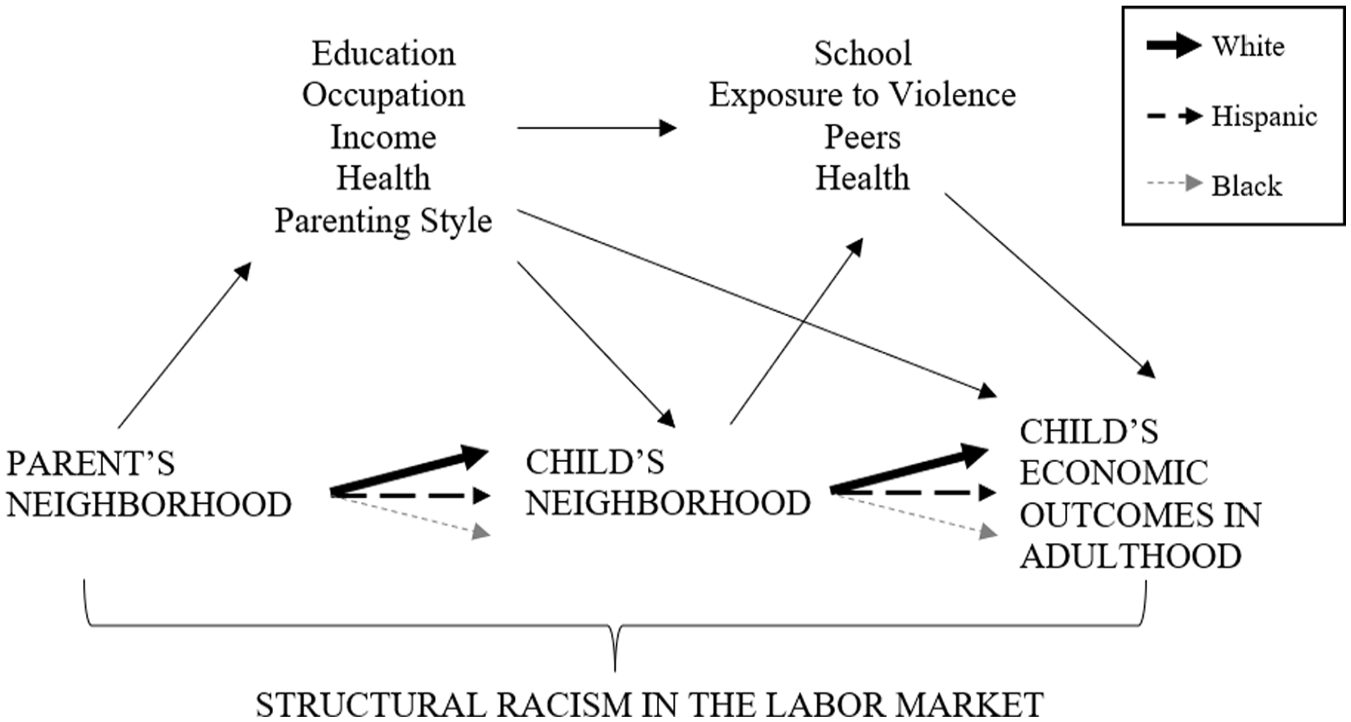
The echo of neighborhood disadvantage: Multigenerational neighborhood effects on economic outcomes by race/ethnicity.
Exposure to disadvantaged neighborhoods over multiple generations can work in ways that differ from exposure in a single generation because the level or dosage experienced can affect not only individuals, but also entire families through various mechanisms that develop over the long term (Alvarado and Cooperstock 2021; Hicks et al. 2018; Jackson and Mare 2007; Wodtke, Harding, and Elwert 2011). Wilson’s (1996) theory of social isolation—which describes how consistent exposure to neighborhoods with a dearth of economic opportunities, rampant discrimination in housing, social disorganization, and intense policing limits well-being—provides evidence to support a multigenerational framework. 3 Other sociological theories reinforce this conceptualization as well. For example, exposure to neighborhood crime (Block 1979; Hannon 2005; Mayer and Jencks 1989; Stark 1987) and violence (Hannon 2005; Salmon et al. 2022; Sharkey 2010; Sharkey et al. 2014) can have vast consequences for successful childhood development and likely remain imprinted on the psyches of children to affect outcomes well into the future. Moreover, exposure to environmental toxins, such as lead (Bravo et al. 2022; Manduca and Sampson 2019), can also affect children’s developmental and adult outcomes that can, in turn, limit their success in the labor market. Crime, violence, and environmental toxins that are endemic to disadvantaged neighborhoods may undermine various parent-child dynamics that are crucial for child development. For instance, lead toxicity may erode parents’ cognitive development and crime may undermine parents’ socioemotional health, and research demonstrates that parents’ cognition and depression are key drivers of children’s development, educational outcomes, and possibly their subsequent incomes in adulthood (Downey and Coyne 1990; Gotlib and Colich 2014). In addition, divested institutional resources in the community may reduce nonprofit and governmental resources for parents’ socioemotional and physical health and childcare (Small 2006), which could further impact children’s educational and economic trajectories. In short, there are an array of possible mechanisms that could shape intergenerational dynamics and children’s economic trajectories.
Sharkey’s (2008) finding of considerable persistence in neighborhood disadvantage across generations evokes a more complex conceptual model of childhood development, one that encourages scholars to include direct and indirect pathways of influence for neighborhood exposures in parent and child generations. Sharkey and Elwert (2011) and Sharkey (2013) focus on the impact of two generations of exposure to childhood neighborhood poverty using Panel Study of Income Dynamics (PSID) data. 4 They find that exposure to neighborhood poverty for both mothers and their children in childhood is associated with various childhood outcomes including obesity, cognitive ability, anxiety, and the college aspirations and expectations of their children.
This leads us to the following hypothesis regarding multigenerational neighborhood effects:
Heterogeneity by Race and Ethnicity
Cumulative disadvantage
The concept of cumulative disadvantage suggests that persistent exposure to adverse neighborhood conditions, compounded with constrained family-level resources, likely produces negative effects on well-being across the life course (DiPrete and Eirich 2006; Sampson and Laub 1990, 1992). Blacks and Latinos are exposed to elevated levels of neighborhood segregation, neighborhood violence, and neighborhood poverty compared to their White counterparts (Manduca and Sampson 2019; Sampson and Loeffler 2010; Sampson, Sharkey, and Raudenbush 2008). Blacks and Latinos also have fewer individual-level buffers that can offset the deleterious effects of neighborhood disadvantage (Hess 2021; Reardon, Fox, and Townsend 2015), possibly compounding neighborhood and individual-level disadvantages. For example, Levy et al. (2019) found comparable negative effects of neighborhood disadvantage on college graduation for Latinos and Blacks.
One mechanism potentially driving neighborhood effects for Latinos is their school segregation, which has increased dramatically in recent decades (Fry 2007; Orfield et al. 2014). We may also expect stronger associations for Latinos than Blacks because Latinos’ residential mobility may move them farther away from severely distressed neighborhoods to areas with appreciably enhanced economic opportunities—likely because of the reduced housing discrimination they face compared to Blacks (Loya 2022). Furthermore, Latinos’ skin tone may reduce their exposure to discrimination in the labor market compared to Blacks (Pager, Bonikowski, and Western 2009; Quillian et al. 2017). Indeed, Pager et al.’s (2009) field experiment finds that Latinos are exposed to less discrimination in a low-wage labor market than Blacks, and Darity, Hamilton, and Dietrich (2002) find that Black-Latinos suffer substantial discriminatory losses in wages. Perhaps most compelling is the finding that experimental Latino movers in the MTO—not Whites or Blacks—experienced positive neighborhood effects on adult earnings (Chetty et al. 2016, Appendix 7a). These findings suggest that Latinos—especially non-Black-Latinos—are likely to yield stronger returns to neighborhood socioeconomic origins.
Research also suggests that associations may be stronger for Blacks than Whites. Sharkey and Elwert (2011) find that Black children’s cognitive ability suffers due to successive generations of exposure to neighborhood poverty while White students yield null effects. Early evidence from the MTO project suggests that Black children experience stronger associations of neighborhood contexts in regard to their reading scores than their White counterparts (Sanbonmatsu et al. 2006). Scholars also find that neighborhood disadvantage causes stronger reductions in high school graduation for Black students than White students (Crowder and South 2003; Wodtke et al. 2011).
Informed by recent research, our preliminary hypothesis regarding racial and ethnic heterogeneity in multigenerational neighborhood effects is the following:
Perverse openness
An alternative model, perverse openness (Duncan 1969) posits that race, not class origins, is the dominate factor governing the economic mobility of Black individuals. For Blacks, any benefits accrued by growing up in more advantaged neighborhoods may be undercut by enhanced discrimination in the labor market and society at large.
The legacies of segregation and the limited effects of family income on residential attainment combine to limit Blacks’ integration and increase their exposure to poor neighborhoods at all levels of income compared to Whites and other minority groups (Intrator, Tannen, and Massey 2016; Reardon et al. 2015). For example, national-level evidence from observational data suggests that White students experience stronger developmental gains from affluent neighborhoods compared to Black students (Brooks-Gunn et al. 1993) and that Black children do not experience educational gains related to improvements in neighborhood socioeconomic status (Turley 2003). Moreover, Black middle-class residents may continue to experience exposure to economic strife and violence that may offset some of the advantages that their middle-class status might otherwise afford them because of their social and economic proximity to resource-poor contexts (Patillo 1999). 5 That is, even when economic tailwinds allow for Black families to exit disadvantaged neighborhoods, they often move adjacent to or near their old neighborhoods, allowing them to sustain social and economic ties (Clampet-Lundquist and Massey 2008; Patillo 1999; Sampson 2008). This may explain why middle-class Blacks experience higher exposure to neighborhood poverty, boarded up homes, more female-headed households, and fewer college graduates compared to middle-class Whites (Adelman 2004).
Racism and discrimination likely yield gaps in occupational selection, employment trajectories, as well as subsequent income, earnings, and wealth for Blacks across the life course (Charles and Hurst 2002; Conley 1999; Keister and Moller 2000; Oliver and Shapiro 1995; Pfeffer and Killewald 2019). Blacks in the United States often benefit less economically than their White counterparts, even when achieving the same level of education and training (Bertrand and Mullainathan 2004; Gaddis 2015; Pager 2003; Pager et al. 2009). Even a degree from an elite college cannot completely ward off racism in the labor market (Gaddis 2015). Structural headwinds in the form of racism in the labor market may explain why, using experimental techniques and Internal Revenue Service tax data, Chetty et al. (2016, Appendix 7a) find that moving to better neighborhoods does not produce a statistically significant increase in the adult incomes of Blacks and why Chetty et al. (2020) find that the positive effect of growing up in a low-poverty area on adult income is larger for Whites than Blacks. Simply put, rampant racism and discrimination in the labor market may limit the returns to neighborhood socioeconomic origins for Blacks (Lacy 2007; Patillo 1999).
This leads us to our secondary hypothesis regarding racial and ethnic heterogeneity:
Data
By using unique data from two successive cohorts of the NLSY, we can assess the empirical puzzle of whether multigenerational exposure to childhood neighborhood disadvantage is associated with children’s adult income, net of families’ mid-twentieth century exposure to de jure and de facto segregation in schools and housing, genes, and other unobserved confounders that are fixed within the grandparent generation. We analyze 35 years of federally restricted tract-level NLSY data between 1979 and 2014 and across 27 survey waves on encrypted machines at U.S. Census Bureau–managed Federal Statistical Research Data Centers. In accordance with U.S. Bureau of Labor Statistics (BLS) rules regarding restricted tract-level data, we round all sample sizes and restrict reporting to our main coefficients.
We link NLSY79 female respondents to their NLSY:CYA children to capture kinship lines. We label the parents of the NLSY79 respondents as the first generation, G1 “grandparents”; the NLSY79 respondents as the second generation, G2 “sisters”; and the NLSY:CYA respondents as the third generation, G3 “cousins.” The NLSY79 data provide us with information on their parents’ (G1) household characteristics, their own (G2) childhood neighborhood locations, and their children’s (G3) childhood neighborhood locations. All tract locations are tied to G2, the NLSY79 female respondents.
The NLSY79 is an ongoing, nationally representative, multistage clustered sample of 12,686 young men and women who were 14–22 years old when they were first surveyed in 1979. We analyze approximately 4,900 NLSY79 females who were between the ages of 49 and 58 in 2014 with children (79 percent of all NLSY79 female respondents). These women were age 25 on average at first birth.
The NLSY:CYA follows all of the biological children of the women in the NLSY79. The NLSY:CYA comprises youth born to a nationally representative sample of women aged 21–29 as of January 1, 1986. Similar to the PSID Child Development Supplement, the NLSY:CYA sample is not nationally representative. The eldest of these children were born in 1970 and were 44 years old in 2014. Starting in 1986, the BLS collected data every two years for all youth that were born (or would be born) to female NLSY79 respondents. In early waves, some children were born to young and socioeconomically disadvantaged mothers, but the sample becomes increasingly representative of mothers across the full range of childbearing years over the decades of the survey, reducing the overrepresentation of mothers who had children at young ages. Moreover, we address any bias stemming from mothers’ young childbearing by controlling for grandparents’ household characteristics (Geronimus, Korenman, and Hillemeier 1994; Turley 2003). Many mothers have sisters in the NLSY79 sample (G2), allowing for the identification of cousins in the NLSY:CYA sample (G3). Most of these cousins have one aunt, but some have multiple aunts (up to 4). We leverage this feature of the data set by including children of NLSY79 sisters in cousin FE models.
We advance the neighborhood literature through a multigenerational lens by linking these two NLSY cohorts. Still, we make certain necessary restrictions to the sample to maintain kinship lines. As a result, G3 children are included in the analysis only if they meet certain non-mutually exclusive criteria. For detailed information on our data procedures, please see Appendix A. The final analytical sample for the cousin FE models includes approximately 2,400 G3 cousins—representing about 44 percent of the sample of NLSY:CYA respondents with adult economic data. First, G3 respondents must belong to the approximately 3,550 G2 mothers who were between 14 and 18 years old in 1979. This enables us to measure G1’s household characteristics and G2’s childhood neighborhood conditions. Household socioeconomic data and tract location data must be available for G2 in childhood for at least one year before they turned 19 between 1979 and 1983. Second, to measure G3’s childhood neighborhood exposure, data for census tracts must be available for G2 respondents for at least one year before G3 respondents turned 19. Third, G3 respondents must be born prior to 1996 so that we can measure their economic outcomes in adulthood (age 19+). Fourth, the cousin FE model further restricts the analytical sample of G3 respondents to those who have at least one cousin by 2014 with adult income data and to those who had within-family variation in intergenerational childhood neighborhood exposure. No G3 respondents are dropped due to missing control variables because we imputed for G2 childhood household characteristics.
Given the complexity of our data structure, our sample is not representative of the current U.S. population due to demographic changes since the late 1970s, variation in family formation among NLSY79 sisters, and the stated exclusion criteria. Moreover, following Sharkey and Elwert (2011), we do not use analytical weights.
Multigenerational Neighborhood Disadvantage
First, we use the neighborhoods of G2 when they were under the age of 19 (1979–1983) to measure their childhood neighborhood contexts. Second, we use the neighborhoods of G3 when they were under the age of 19 to measure their childhood neighborhood contexts. We average neighborhood conditions across time for respondents to reduce measurement error, and this decision is informed by the current body of research on neighborhood effects (Aaronson 1998; Sharkey and Elwert 2011; Vartanian and Buck 2005). 6
Following previous research on single-generation neighborhood effects, we create a composite scale of tract-level disadvantage to capture the multidimensionality of neighborhood context in each wave of the survey for G2 between ages 14 and 18 and for G3 between ages 0 and 18. 7 We use the following seven standardized variables: (1) percent of residents at or below 100 percent of the poverty threshold as defined by the U.S. Census Bureau; (2) percent jobless; (3) percent not in the labor force; (4) percent with at least a bachelor’s degree, reverse coded; (5) percent managers and professionals, reverse coded; (6) median income, reverse coded; and (7) median housing value, reverse coded. Cronbach’s α is .88. We calculate the average of this scale score across the childhood waves of G2 and G3. Then, we assign G2 and G3 quintile scores (1 is least disadvantaged; 5 is most disadvantaged) to capture the mean exposure to neighborhood disadvantage during childhood. Appendix B illustrates average neighborhood conditions across quintiles for both our NLSY79 and NLSY:CYA sample respondents. 8
We then create a dichotomous variable (where 0 represents Quintiles 1–3; 1 represents Quintiles 4 or 5) to define being exposed to neighborhood disadvantage during childhood for both G2 and G3. A typical childhood neighborhood in the “disadvantaged” quintiles for the NLSY79 G2 and NLSY:CYA G3 respondents in our multigenerational sample has between 6 and 11 percent college graduates, 4.9 and 13.9 percent managers and professionals, median housing values between $69,648 and $107,165, median incomes between $27,450 and $39,476, between 15.6 and 33.9 percent of neighbors in poverty, unemployment between 7.8 and 15.7 percent, and between 39.5 and 47.4 percent of residents out of the labor force. In supplemental analyses, we adjust these thresholds to compare a more restrictive expression of neighborhood disadvantage (where 0 represents Quintiles 1–4; 1 represents Quintile 5).
We follow previous research (Sharkey 2013) and use a four-category factor variable to measure exposure to neighborhood disadvantage based on the two dichotomous variables described above: (1) neither G2 nor G3 were exposed in childhood—the reference category; (2) only G2 was exposed in childhood; (3) only G3 was exposed in childhood; and (4) both G2 and G3 were exposed in childhood. The fourth category, which indicates multigenerational exposure to neighborhood disadvantage in childhood, is our primary category of interest. In our discussion of results, we refer to four types of family trajectories that comprise our four-category factor variable: (1) neither, (2) ascending, (3) descending, and (4) stuck-in-place (SIP). Figure 2 schematically illustrates each of these family trajectories. An ascending trajectory is one where G2 was exposed to childhood neighborhood disadvantage, but G3 was not. A descending trajectory is one where G2 was situated in an advantaged neighborhood context during childhood, but G3 was exposed to a disadvantaged neighborhood in childhood. These patterns represent an upwardly mobile and a downwardly mobile family lineage, respectively. Our focus is on the scenario of multigenerational exposure to disadvantaged residential contexts in childhood for both G2 and G3, conforming to the idea of families being “stuck in place” (Sharkey 2013).
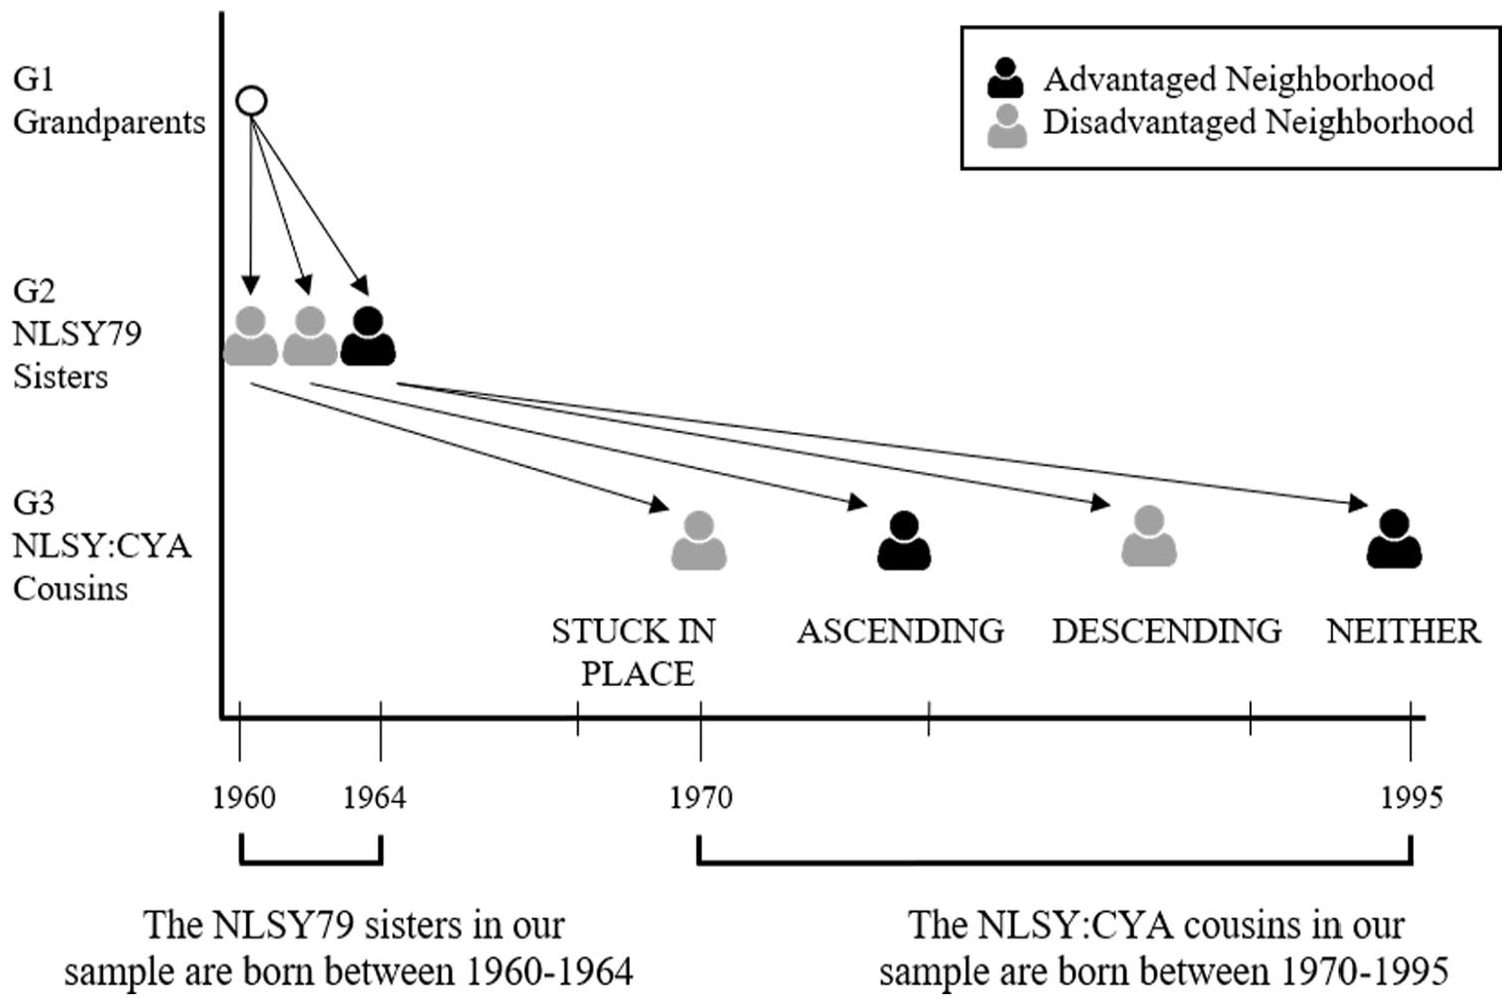
Intergenerational family trajectories.
Examining our four-category neighborhood disadvantage variable by race and ethnicity, we find that 71 percent of White families were in the neither category compared to only 24 percent of Blacks and 29 percent of Latinos. Furthermore, whereas 42 percent of Black families and 34 percent of Latino families were in the SIP category, only 8 percent of Whites were in the SIP category. These initial descriptive statistics for our multigenerational sample suggest that Black and Latino family units are much more likely to be found in disadvantaged neighborhoods across successive generations than Whites.
Earnings in Adulthood
We use the log of G3’s average observed adult total income from salaries, wages, commissions, and tips from all jobs as our primary outcome variable. The earnings data span the full age range of the available adult years (ages 19–44) through the 2014 wave of the NLSY:CYA. The NLSY:CYA provides us with information on G3’s income in every wave of adulthood, and all respondents in our analytical sample report at least one wave of income data in adulthood. 9
Control Variables
We control for G2’s childhood household conditions—these also represent G1’s adult characteristics, including household structure, education, employment, income, and poverty—which may predict the neighborhoods where G2 grew up as well as the neighborhoods where G3 grew up (via the association between G2’s childhood neighborhood and G2’s adult educational and socioeconomic attainment). These data stem from five survey waves between the years 1979 and 1983, when the NLSY79 female respondents were under the age of 19. We follow previous research and average our control variables across time to reduce measurement error (Aaronson 1998; Sharkey and Elwert 2011; Vartanian and Buck 2005).
Table 1 includes the means and standard deviations for our observed controls and outcome variable. While the traditional ordinary least squares (OLS) models yield estimates for all of these controls, the cousin FE models exclude controls that are constant between cousins (e.g., grandmother was born in the United States). We do not control for G2’s adult household characteristics to avoid overcontrolling that may suppress the association for multigenerational exposure to neighborhood disadvantage in our main analyses (Sharkey and Elwert 2011). Our multigenerational setup differs from single-generation neighborhood effect studies in this regard. In traditional single-generation studies, it is commonplace to control for adult household characteristics to demonstrate that one’s neighborhood has an independent association. However, these same controls could be interpreted as mediating variables within our multigenerational framework. 10
Descriptive Statistics for the Analytical Sample of NLSY Respondents.
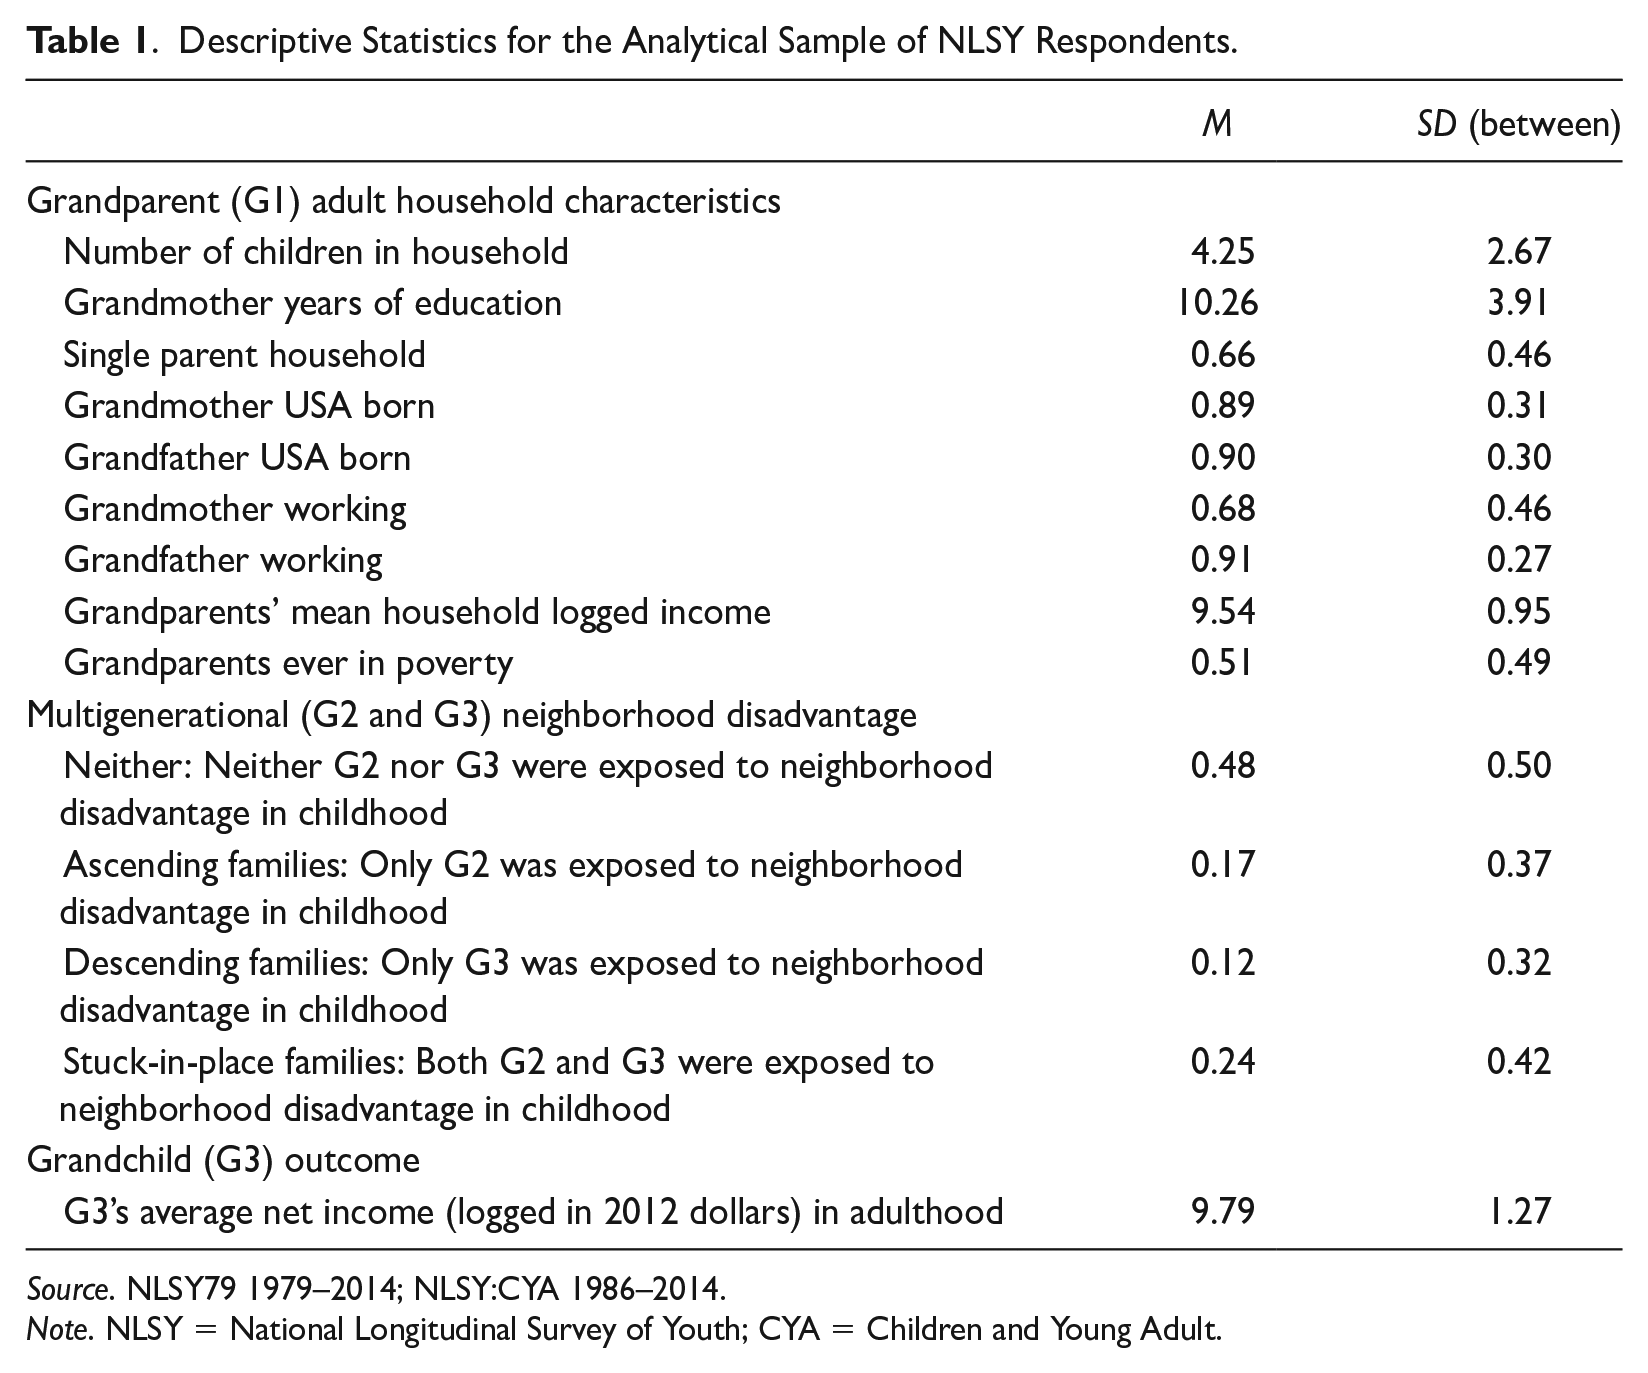
Source. NLSY79 1979–2014; NLSY:CYA 1986–2014.
Note. NLSY = National Longitudinal Survey of Youth; CYA = Children and Young Adult.
Methods
Fixed effects (FE) models have been a feature of recent neighborhood studies (Aaronson 1998; Alvarado 2018; Plotnick and Hoffman 1999; Vartanian and Buck 2005). However, the most common of these, sibling FE models, are not ideal for addressing the theoretical concerns involved in multigenerational analyses. Instead, we control for unobserved grandparental experiences on G3’s maternal side (e.g., grandparents’ school segregation, housing segregation, and genes) that likely affect the neighborhoods where subsequent generations grow up using cousin FE models, thereby addressing some of the chief theoretical factors driving intergenerational inequality (Faber 2020; Sharkey 2008, 2013). The cousin FE model accounts for unobserved factors in a family-specific error term. Among the weaknesses are that FE models cannot account for unobserved grandparental factors that vary across G3 respondents and their G2 mothers (e.g., differences in grandparents’ psychological and emotional states while they were rearing G2 sisters or other harder to measure differences in household characteristics). Furthermore, the family lineages are restricted to G2 sisters who had children—G2 brothers’ children are not followed in the NLSY:CYA. Variation in neighborhood profiles between G2 sisters aged 14–18 stems from measurements from intervening years after older sisters had turned 19 during which time parents may have either moved or the neighborhoods may have changed around the families that did not move. Ultimately, however, we use variation from both G2 and G3 generations in our analyses.
Our estimand of interest is the association between two successive generations of exposure to childhood neighborhood disadvantage and economic well-being. Sharkey and Elwert (2011) argue that this must be estimated without controlling for the traditional set of family background variables (i.e., parents’ education or income). The reason for this, they argue, is that controlling for family background would block the indirect pathways through which parents’ childhood neighborhood exposure may influence the outcomes of their children in the next generation, underestimating the impact of parents’ childhood neighborhoods for their children’s outcomes.
Our models aim to estimate associations between neighborhood conditions across generations; we do not estimate causal effects. Our study begins with descriptive associations focused on multigenerational exposure to neighborhood disadvantage. Next, we include all of G2’s observed childhood household characteristics as controls in OLS models. These estimates may be biased due to the correlation between neighborhood conditions and unobserved family characteristics passed down from grandparents in G1. Finally, we attempt to rule out at least some alternative explanations through the use of cousin FE models which account for unobserved G1 characteristics. The FE model capitalizes on variation in intergenerational neighborhood conditions between cousins that arises from differing family trajectories between G2 and their children in G3. We cluster our standard errors to the highest level of aggregation, G1 (Cameron, Gelbach, and Miller 2011; Cameron and Miller 2015; Pepper 2002). The cousin FE model is our preferred model.
Following Allison (2009), the OLS cousin FE model takes the following form:

where Y refers to G3’s average (logged) net income in adulthood over the age of 19, i and c refer to the individual i in cousin group c,
It may be difficult to study heterogeneity in neighborhood associations by race and ethnicity because Black and Latino residents are more likely to live in violent and socioeconomically under-resourced communities and because they are more likely to pass on these distressed neighborhood contexts to their children (Sharkey 2008, 2013). Stratifying by race and ethnicity—rather than comparing across racial and ethnic lines—is therefore key to studying heterogeneity in neighborhood associations so that we can, in essence, control for disparities in exposure to acute levels of neighborhood disadvantage that differ across racial and ethnic lines. Thus, we follow Sharkey and Elwert (2011) and Chetty et al. (2016) by running stratified models.
Results
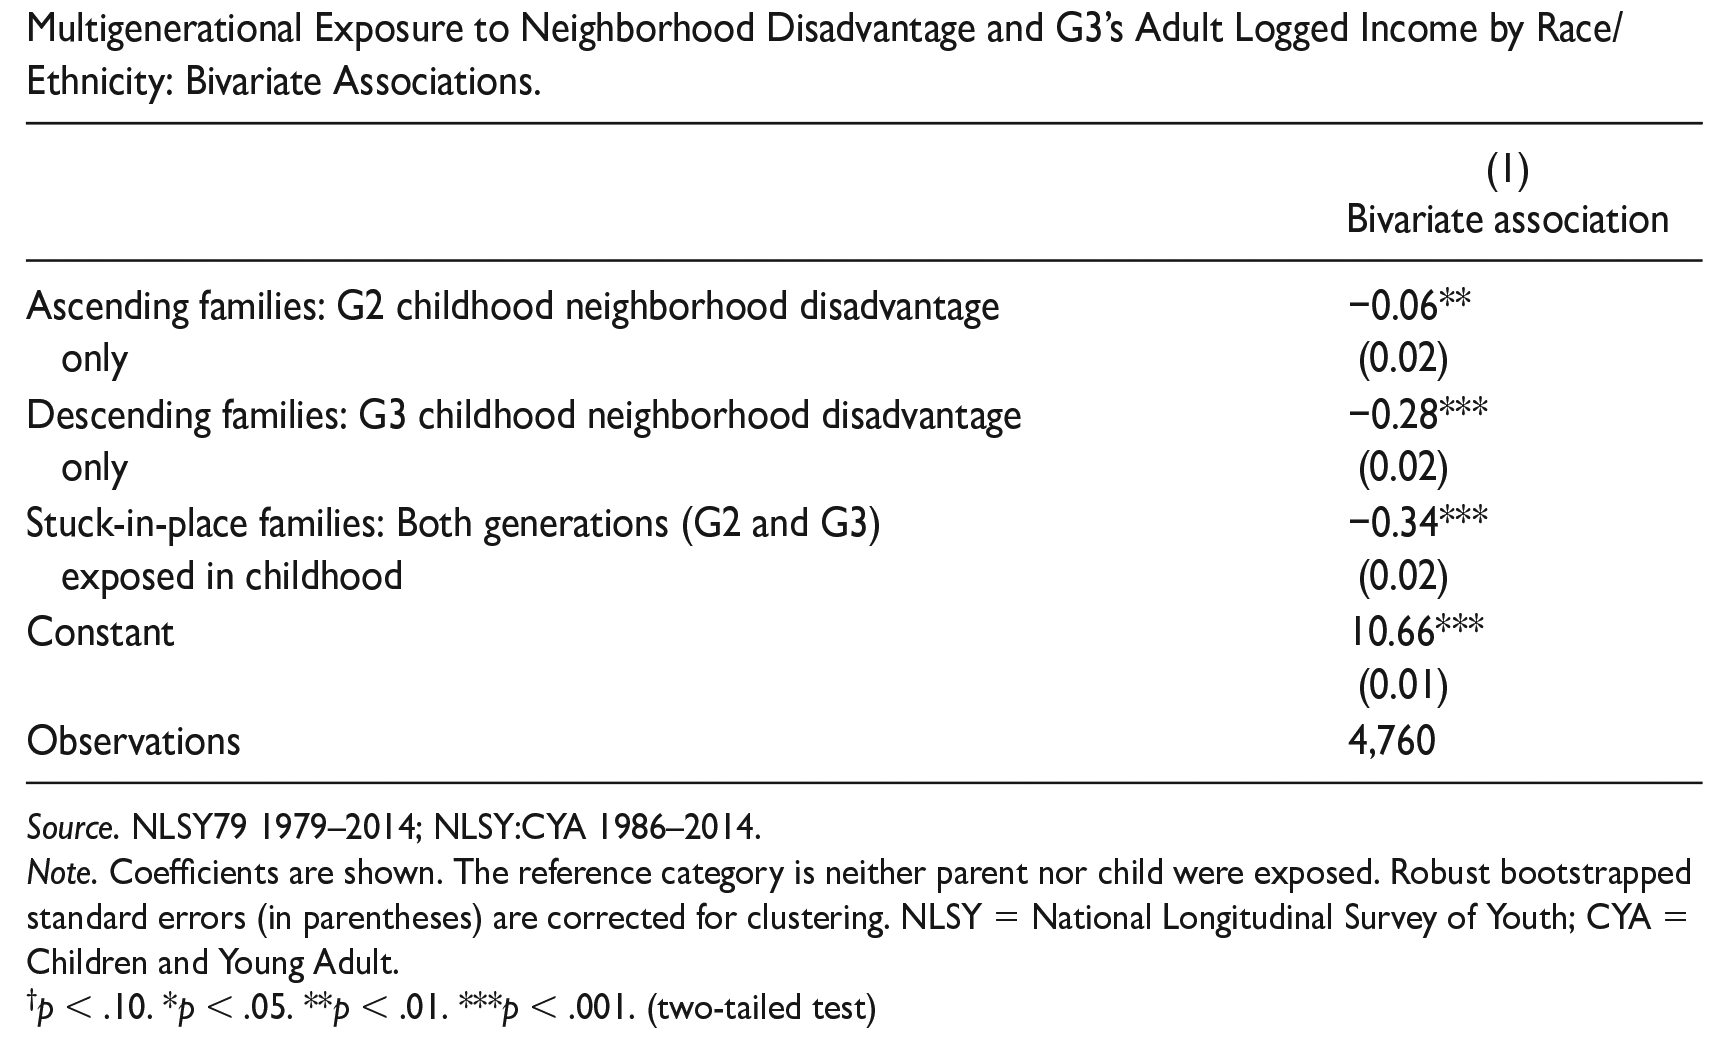
We estimate the association between multigenerational exposure to neighborhood disadvantage and children’s adult logged income using models that control for observed characteristics of G1 grandparents and employ cousin FE. First, however, we present the bivariate results to get a sense of the total association in Figure 3 (and Appendix C). As expected, we see that both ascending and descending family trajectories (i.e., G2 only and G3 only childhood exposure, respectively) are negatively associated with G3’s adult logged income. Our primary estimand of interest, SIP families (i.e., where both G2 and G3 experience childhood exposure), also yields a statistically significant negative association with G3’s adult logged income.
11
The bivariate results suggest that the expected decrease in earnings for ascending families is 5.82 percent (100*(−1 +
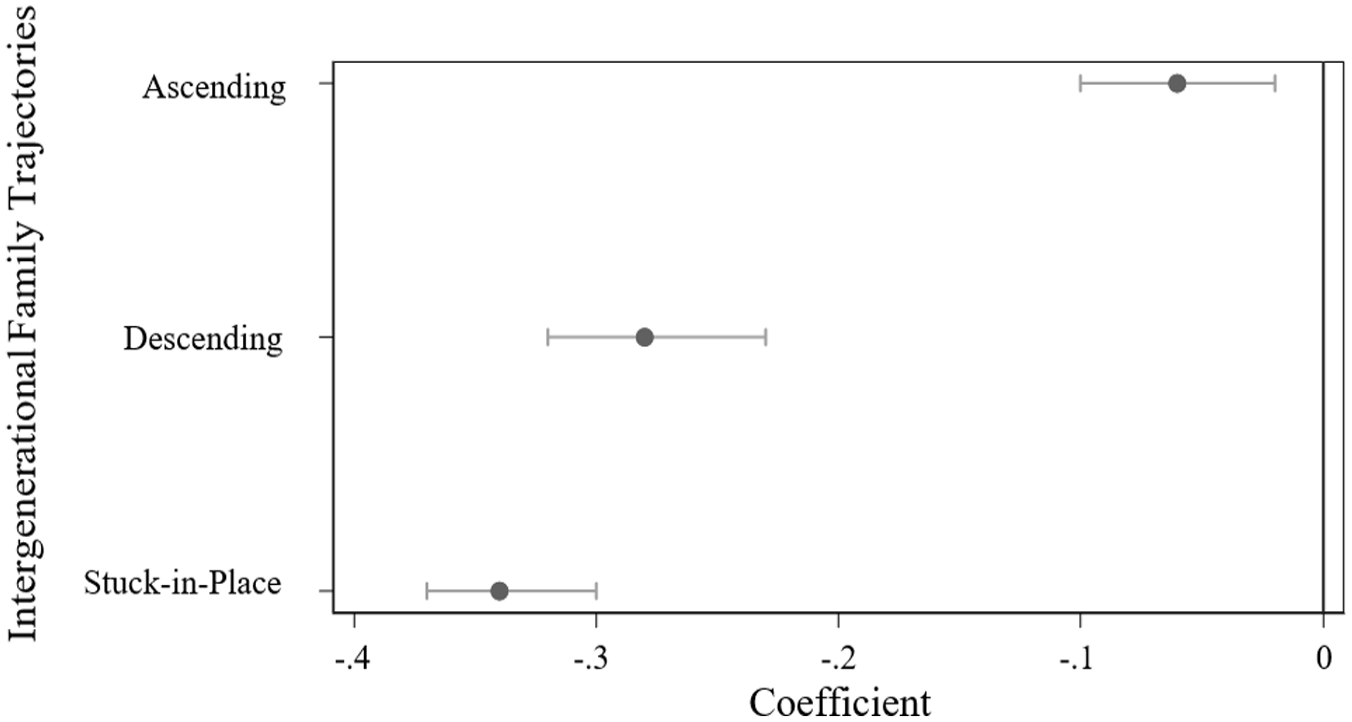
Total association between multigenerational childhood neighborhood disadvantage and adult logged income.
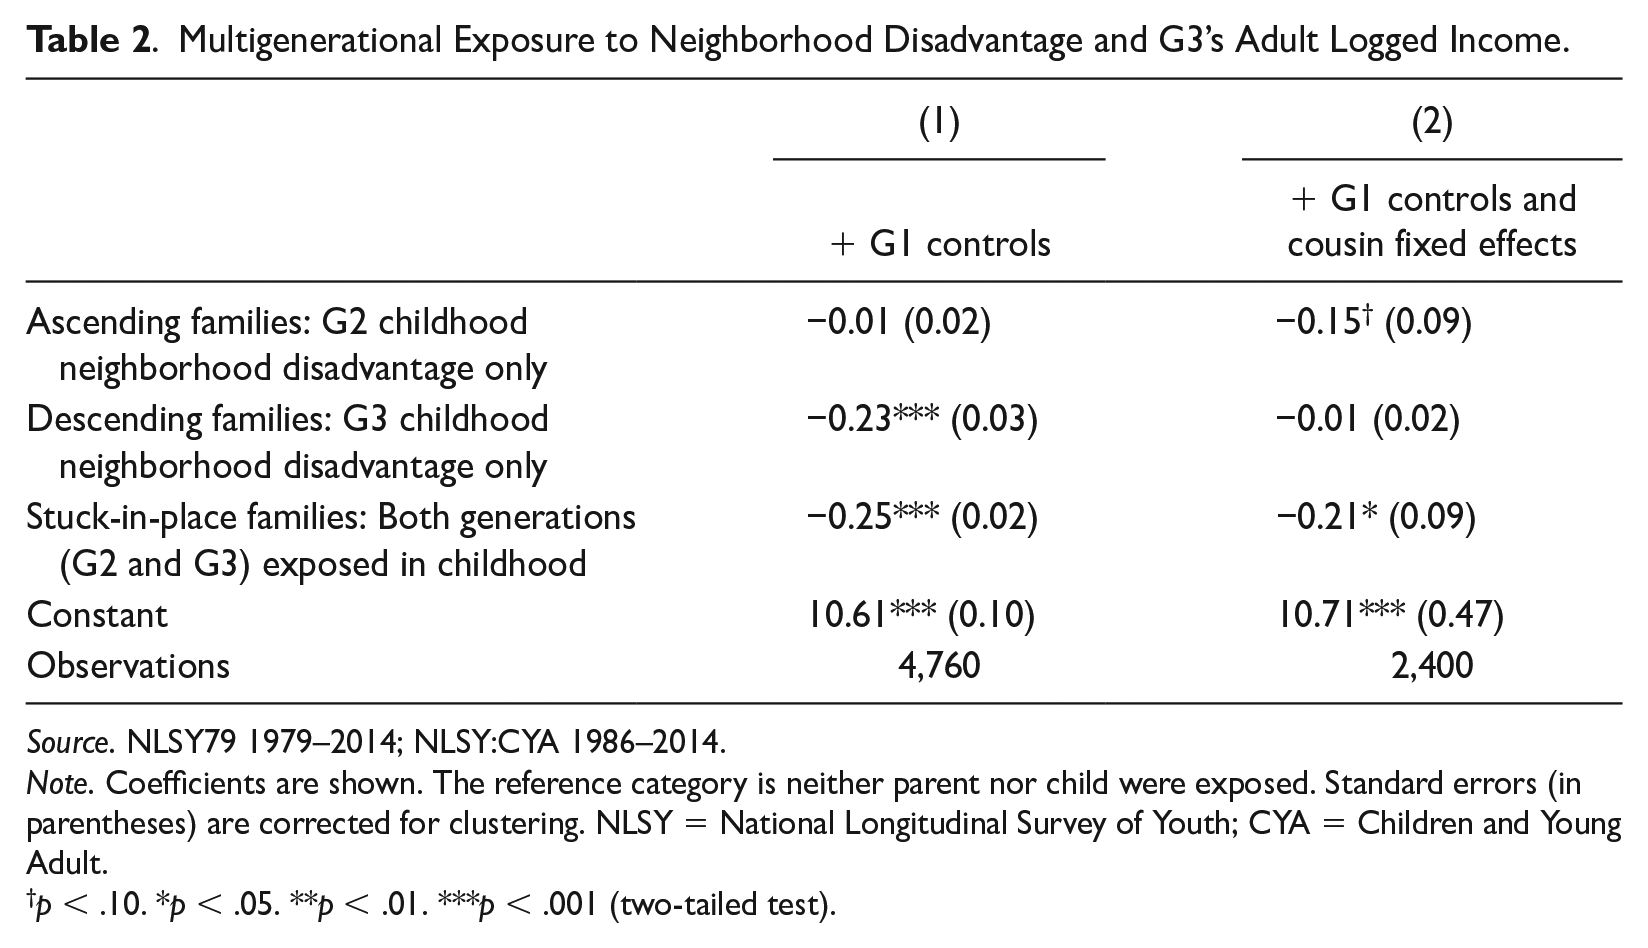
In Table 2, we summarize successive OLS models that include G1 controls (Model 1) and cousin FE (Model 2) for adult logged income. The results from Model 1 suggest that both descending family and SIP family trajectories are likely to yield a statistically significant negative association with G3’s adult logged income. Descending families experience a 20.54 percent decline in earnings, while SIP families experience a 22.12 percent reduction in earnings, net of observed confounders. 12 The finding for descending families aligns with previous single-generation studies that did not disentangle children’s childhood exposure from that of their parents (Alvarado 2018; Chetty et al. 2016; Vartanian and Buck 2005). 13
Multigenerational Exposure to Neighborhood Disadvantage and G3’s Adult Logged Income.
Source. NLSY79 1979–2014; NLSY:CYA 1986–2014.
Note. Coefficients are shown. The reference category is neither parent nor child were exposed. Standard errors (in parentheses) are corrected for clustering. NLSY = National Longitudinal Survey of Youth; CYA = Children and Young Adult.
p < .10. *p < .05. **p < .01. ***p < .001 (two-tailed test).
Turning to Model 2, SIP families are likely to experience a negative association with children’s adult income, suggesting that a multigenerational effect for neighborhood disadvantage is indeed circumscribing economic vitality. Ascending families exhibit a marginally statistically significant negative association with adult earnings, suggesting that there is likely an intergenerational effect for at least part of the sample. Meanwhile, descending family trajectories are not associated with the income earnings of G3 in adulthood. The coefficient for SIP families in Model 2 is slightly smaller than the association that only controls for observed confounders in Model 1 (−0.25 vs. −0.21), suggesting that unobserved time-invariant characteristics nested in the grandparent generation account for a 16 percent decrease in the estimated association.
Although our analysis is focused on SIP families, it is important to unpack the findings for ascending and descending families as well because they represent a new understanding that disentangles results garnered from prior single-generation studies. The result for descending families is statistically significant in Model 1, suggesting that the bivariate estimate is not explained away by G1 household characteristics such as poverty, income, nativity, unemployment, household structure, and education or the separation of parental childhood exposure from children’s childhood exposure. This result is uncovered here because, unlike in prior single-generation research, we can distinguish between children’s and parents’ exposure to disadvantaged neighborhood conditions. However, unobserved confounders nested in the grandparent generation (e.g., genes, Jim Crow era schooling, and housing segregation) that Model 2 controls for explains away the association for descending family trajectories. Finally, the bivariate association for ascending families is explained away by including observed G1 controls in Model 1. However, Model 2 yields a marginally significant negative association between childhood exposure in the mother’s generation and G3’s adult income. We are able to uncover this intergenerational effect because we explicitly disentangle the effects of exposure in the child’s generation and exposure in the parent’s generation. It is important to note two key differences between Model 1 and Model 2: (1) Model 2 controls for unobserved confounders such as genes and differing parenting practices across aunts on the part of grandparents—whereas Model 1 only controls for observed confounders—and (2) Model 2 excludes respondents without cousins—whereas Model 1 includes the full sample.
The SIP results in Model 2 of an 18.94 percent reduction in earnings represent the core finding of this article. This finding suggests that a multigenerational approach does indeed expand our understanding of the depth of the costs of intergenerational inequality and neighborhood stratification for the economic well-being and mobility of Americans, net of unobserved confounders nested in the grandparent generation. These results confirm our Hypothesis 1 regarding the association between two successive generations growing up in disadvantaged neighborhoods and children’s adult income. 14
Race and Ethnic Heterogeneity
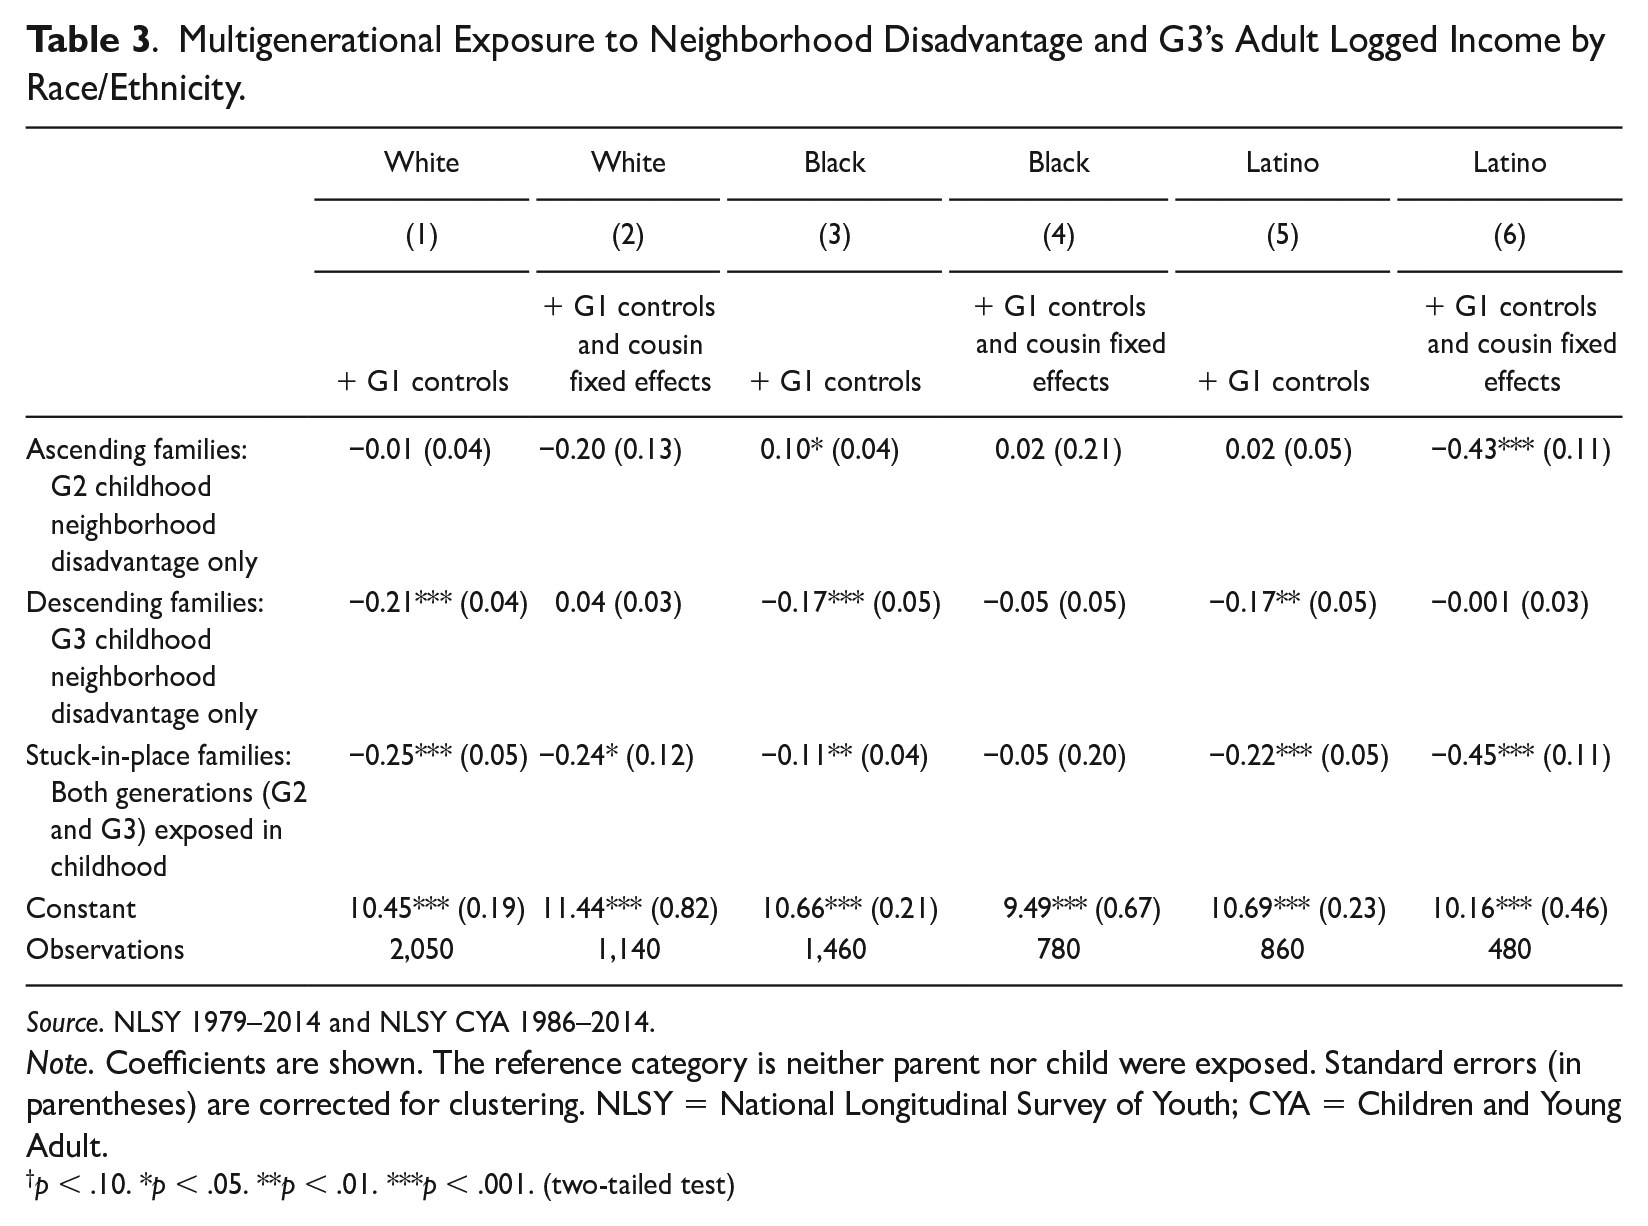
We summarize the results for race and ethnic stratified models by focusing solely on our estimand of interest—the cousin FE coefficient for the association between families that are SIP and children’s adult logged income. Figure 4 summarizes these results for White, Black, and Latino individuals. Table 3 summarizes the full racial and ethnic stratified results for adult logged income. These stratified models give us a sense of the heterogeneity in the association between multigenerational exposure to childhood neighborhood disadvantage and children’s adult logged income and speak to both our Hypotheses 2 and 3.
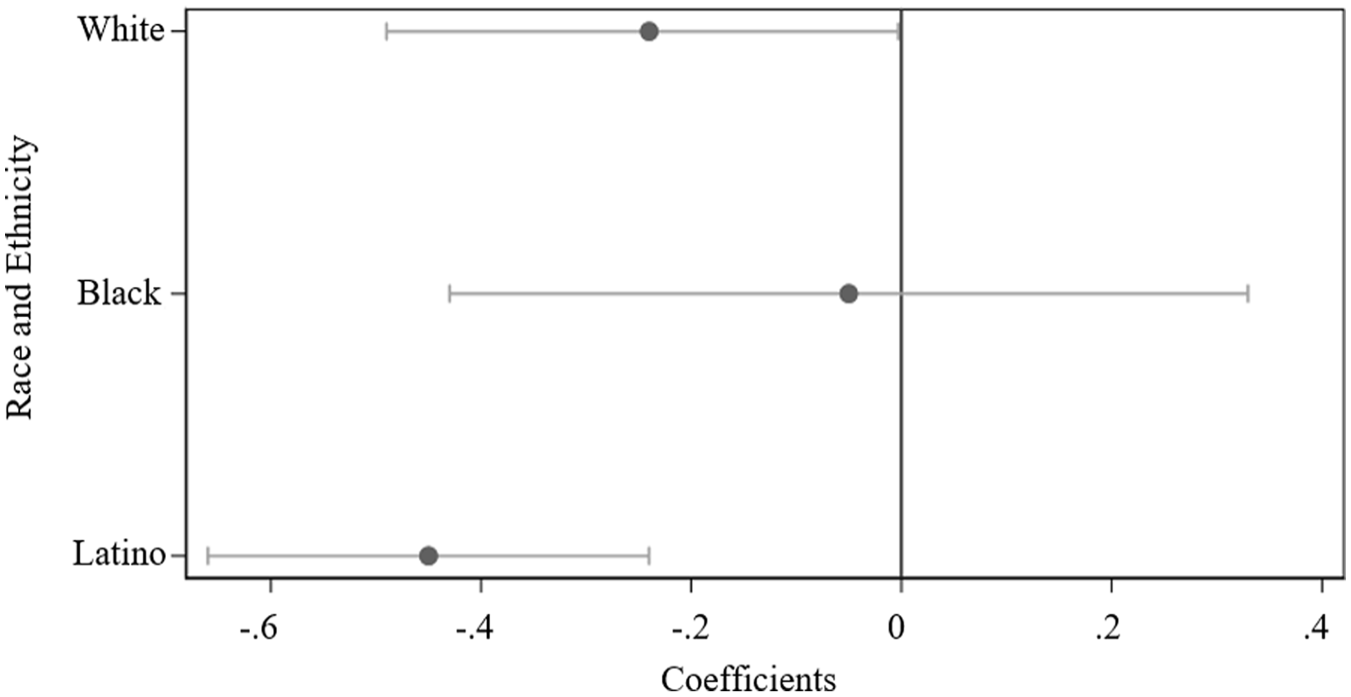
The association between stuck-in-place family trajectories and adult logged income by race/ethnicity, net of observed and unobserved confounders.
Multigenerational Exposure to Neighborhood Disadvantage and G3’s Adult Logged Income by Race/Ethnicity.
Source. NLSY 1979–2014 and NLSY CYA 1986–2014.
Note. Coefficients are shown. The reference category is neither parent nor child were exposed. Standard errors (in parentheses) are corrected for clustering. NLSY = National Longitudinal Survey of Youth; CYA = Children and Young Adult.
p < .10. *p < .05. **p < .01. ***p < .001. (two-tailed test)
The main takeaway is that multigenerational exposure to childhood neighborhood disadvantage has a statistically significant negative association with G3’s adult logged income for Whites and Latinos, but not for Blacks. 15 White SIP families experience a 21.34 percent decline in earnings and Latino SIP families experience a 36.24 percent decline in earnings, net of observed and unobserved confounders. Importantly, we also find a statistically significant negative association for ascending family trajectories for Latinos in Model 6 of Table 3—an association that is on par with the SIP estimate for Latinos—after accounting for observed and unobserved confounders. We find no other statistically significant cousin FE association for ascending families among Whites or Blacks, suggesting that the marginally significant negative intergenerational effect on earnings in Model 2 of Table 2 for ascending families is likely isolated to Latinos.
Again, our main finding is that the SIP estimate for Black families is null. 16 These results align with those of Chetty et al. (2016) and Chetty et al. (2020)—both of which find null or weaker returns to childhood neighborhood contexts for Blacks’ adult incomes. This also aligns with previous audit study research on the effects of structural racism in the U.S. labor market that specifically negatively affects Black Americans (Bertrand and Mullainathan 2004; Gaddis 2015; Pager 2003) and the work done by Levy (2019) who finds that the ill effects of concentrated poverty on college graduation are null for adolescents who are most likely to live in such neighborhoods. However, a post hoc Chow test demonstrates that the nonstatistically significant Black SIP estimate (of a 4.88 percent decline in earnings) is not different from the statistically significant White SIP estimate. The nonstatistically significant Black-White difference may be partly attributable to lack of power due to the relatively smaller sample size of the Black pool of cousins. This conclusion is partially supported by the fact that the SIP difference between Blacks and Whites in Models 1 and 3, which only controls for observed confounders and includes a larger sample of Black respondents, is statistically different in the population of multigenerational NLSY families. This suggests that with more power, the Black SIP estimate may indeed be smaller than the White SIP estimate. 17
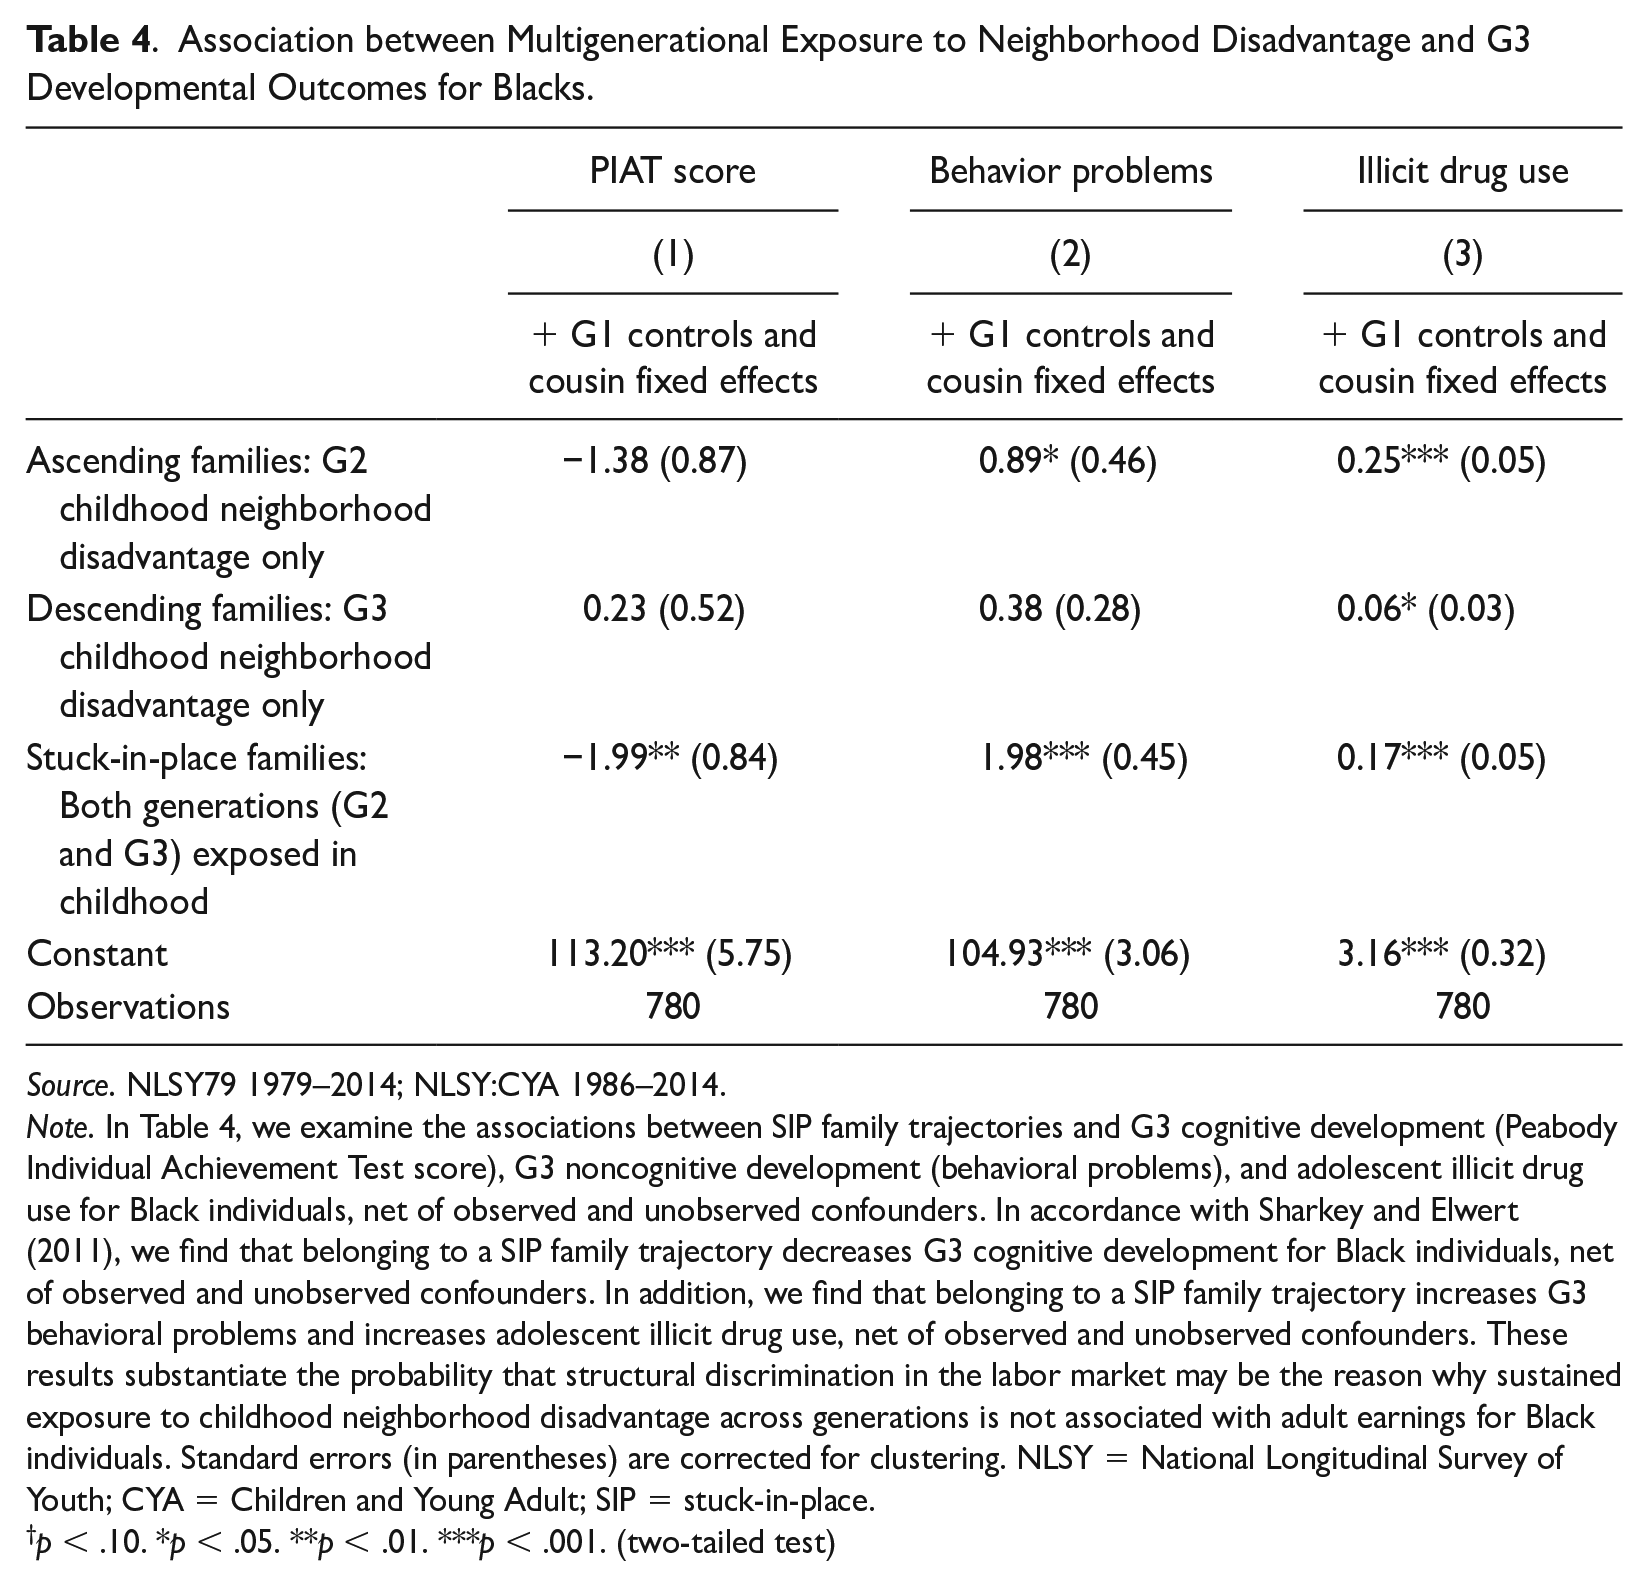
It is important to note that this null SIP finding for Black families is evident despite developmental outcome effects for Black children. In a falsification test presented in Table 4, we find that SIP family trajectories are indeed associated with various key developmental outcomes in adolescence for Black children, suggesting that structural racism in the labor market may undercut the association between income and multigenerational neighborhood disadvantage.
Association between Multigenerational Exposure to Neighborhood Disadvantage and G3 Developmental Outcomes for Blacks.
Source. NLSY79 1979–2014; NLSY:CYA 1986–2014.
Note. In Table 4, we examine the associations between SIP family trajectories and G3 cognitive development (Peabody Individual Achievement Test score), G3 noncognitive development (behavioral problems), and adolescent illicit drug use for Black individuals, net of observed and unobserved confounders. In accordance with Sharkey and Elwert (2011), we find that belonging to a SIP family trajectory decreases G3 cognitive development for Black individuals, net of observed and unobserved confounders. In addition, we find that belonging to a SIP family trajectory increases G3 behavioral problems and increases adolescent illicit drug use, net of observed and unobserved confounders. These results substantiate the probability that structural discrimination in the labor market may be the reason why sustained exposure to childhood neighborhood disadvantage across generations is not associated with adult earnings for Black individuals. Standard errors (in parentheses) are corrected for clustering. NLSY = National Longitudinal Survey of Youth; CYA = Children and Young Adult; SIP = stuck-in-place.
p < .10. *p < .05. **p < .01. ***p < .001. (two-tailed test)
Finally, we also conduct a supplemental analysis to test the interaction between racial/ethnic identification and multigenerational exposure to neighborhood disadvantage. We run this analysis on the full multigenerational sample as there is not enough racial and ethnic variation within cousins to run this interaction in a model that includes cousin FE. Figure 5 illustrates that while there is no statistically significant difference in expected logged income for Blacks who either were exposed to successive generations of neighborhood disadvantage or were not exposed in either generation, there is a difference for both Whites and Latinos, net of G1 controls. This aligns with our findings presented in Table 3—that is, neighborhood disadvantage seems not to predict adult income for Blacks, net of observed and unobserved confounders. Taking these results together, we believe that multiple generations of exposure to neighborhood disadvantage is less predictive of adult income for Blacks than for Whites or Latinos.
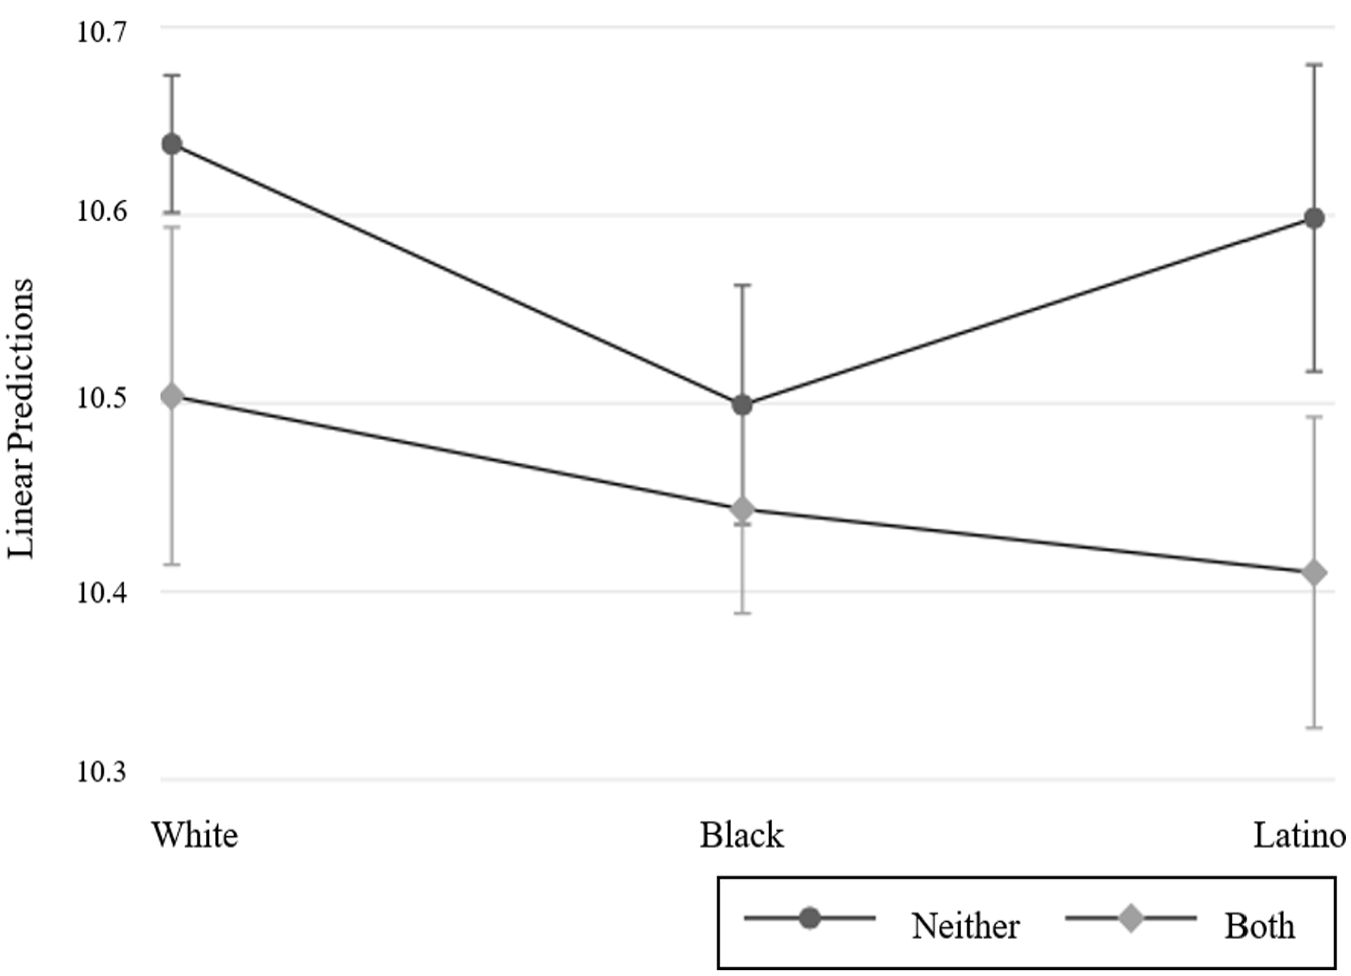
The interaction between race/ethnicity and multigenerational exposure to neighborhood disadvantage.
For White and Latino families, our models yield results that align with commonplace notions of the nefarious impacts of growing up in disadvantaged neighborhoods. Moreover, for Whites and Latinos, our findings suggest neighborhood mobility is much more likely to produce economic gains compared to Blacks. Black families appear more likely to face racism in the labor market that has calcified to the point of overpowering the benefits of growing up in a “good” neighborhood. That is, structural racism that Black workers face in the labor market are so embedded within the historic fabric of the United States as to likely subordinate the potential positive associations of multiple generations of residential advantage. These results confirm our Hypothesis 2 regarding the racial/ethnic gradient in associations between multigenerational exposure to childhood neighborhood disadvantage and children’s adult income and our Hypothesis 3 that Blacks experience weaker neighborhood effects on earnings.
Extreme Neighborhood Disadvantage
We re-run our models using an alternative operationalization to gauge whether our results are robust to a more acute degree of exposure to neighborhood disadvantage. We are particularly interested in whether the association changes for Black residents given the racial/ethnic gradient we identified in our main analyses. That is, we investigate whether Black individuals are sensitive to multigenerational exposure when we define neighborhood disadvantage in a more extreme fashion than originally employed.
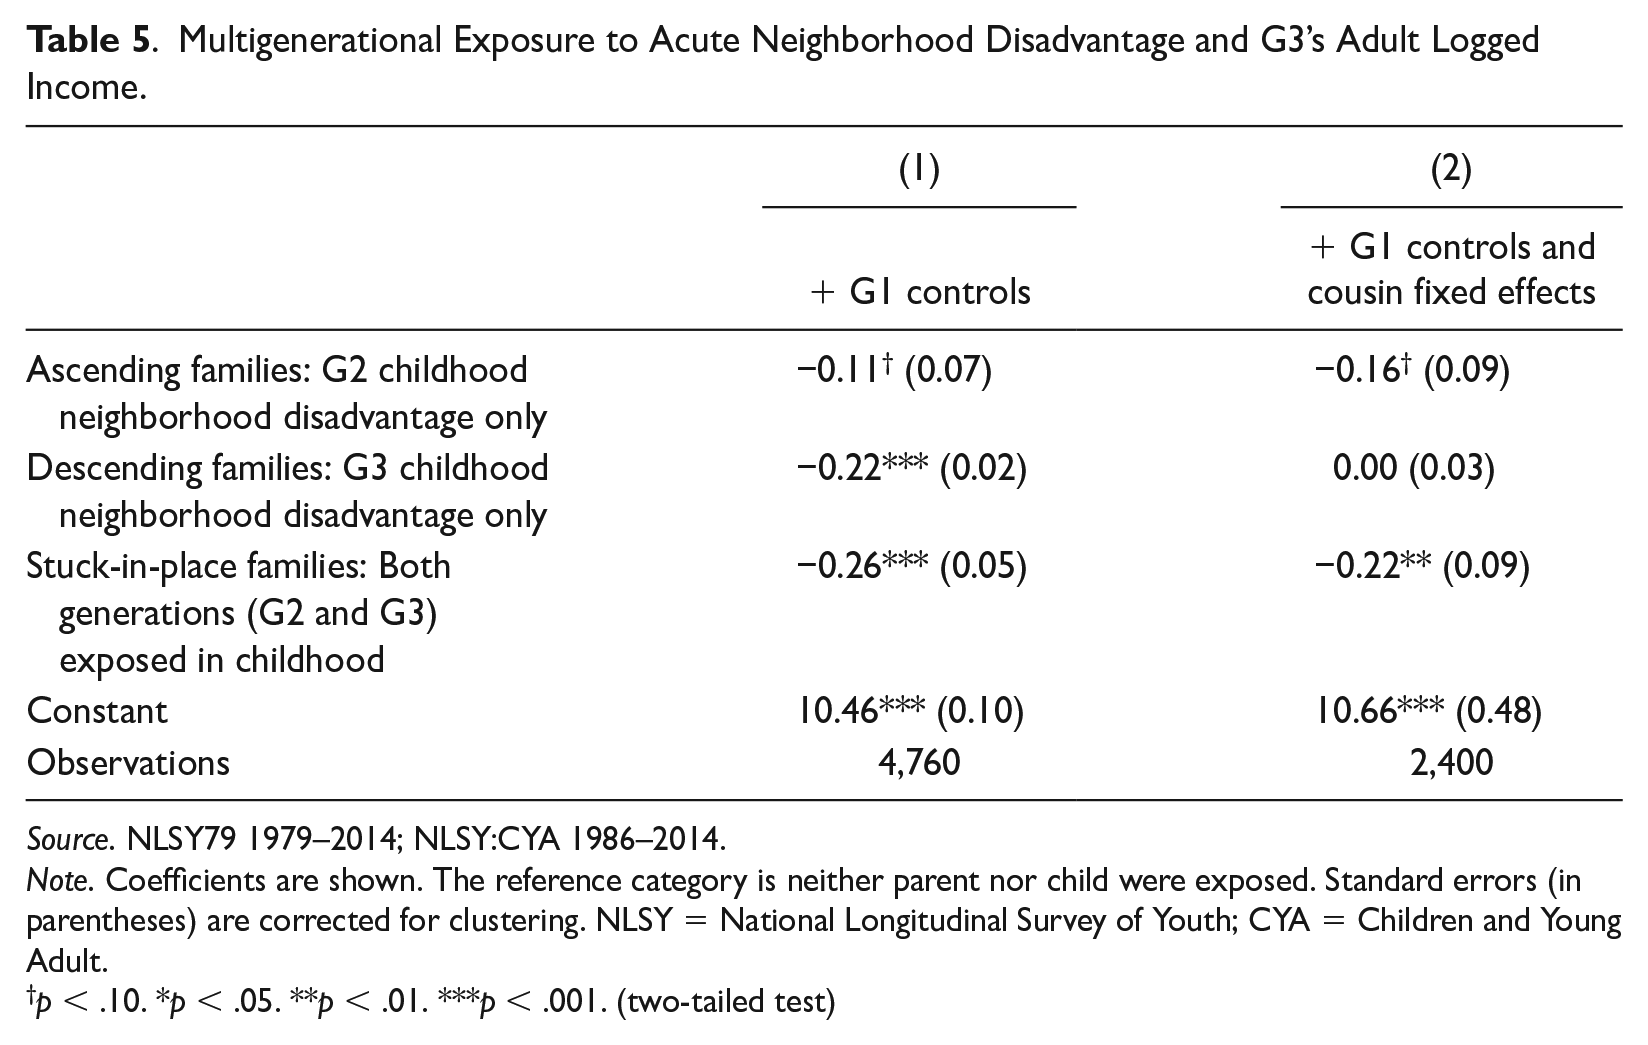
Table 5 summarizes the OLS results for models that control for G1 observed characteristics and those that add in the cousin FE for the association with G3’s adult logged income for all respondents. Ascending families experience a 10.42 percent decrease in earnings, descending families experience a 19.75 percent decrease in earnings, and SIP families experience a 22.89 percent decrease in earnings, net of observed confounders. The cousin FE results for adult logged income mimic those found in Table 2. Specifically, ascending families experience a 14.79 percent decrease in earnings and SIP families experience a 19.75 percent decrease in earnings, net of observed and unobserved confounders.
Multigenerational Exposure to Acute Neighborhood Disadvantage and G3’s Adult Logged Income.
Source. NLSY79 1979–2014; NLSY:CYA 1986–2014.
Note. Coefficients are shown. The reference category is neither parent nor child were exposed. Standard errors (in parentheses) are corrected for clustering. NLSY = National Longitudinal Survey of Youth; CYA = Children and Young Adult.
p < .10. *p < .05. **p < .01. ***p < .001. (two-tailed test)
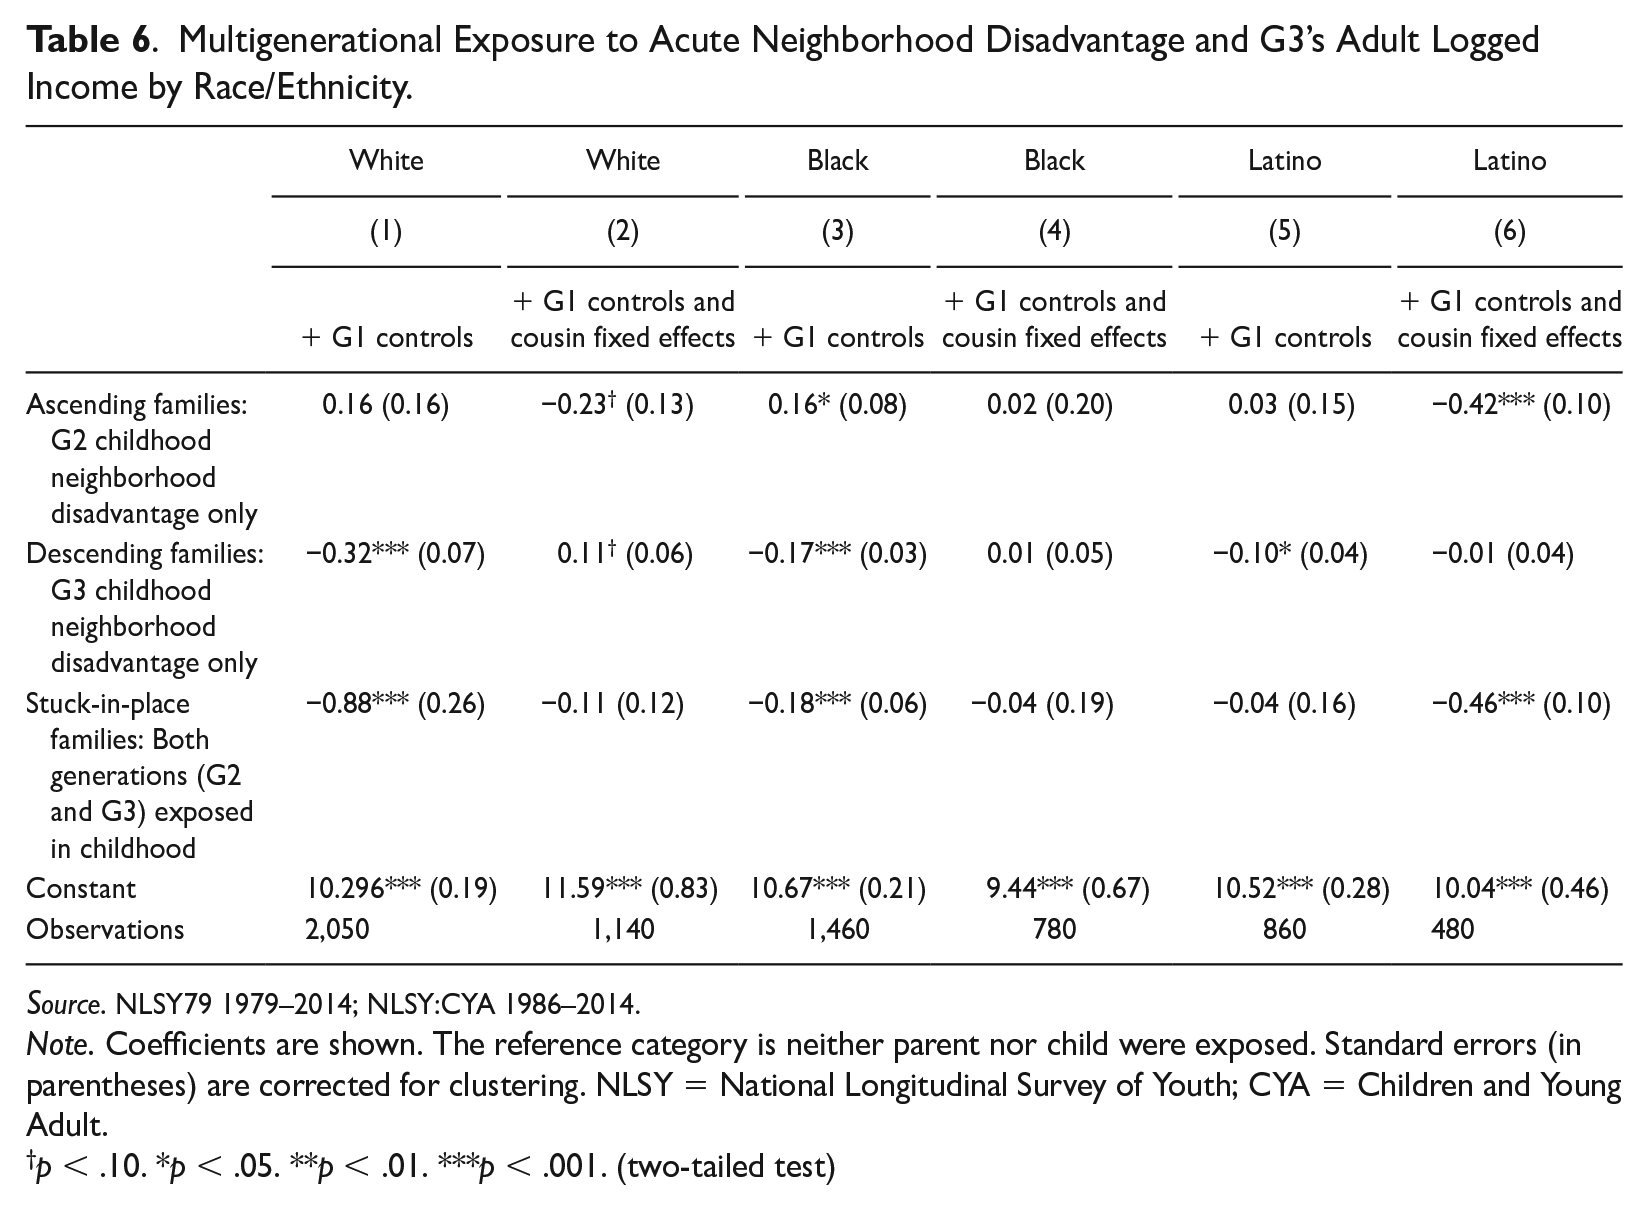
Table 6 summarizes results for models for the association between acute exposure to neighborhood disadvantage and adult logged income that are stratified by race and ethnicity. Here, we find that after controlling for observed and unobserved confounders, Black residents’ incomes continue to be immune to whether their family exhibits an intergenerational transmission of neighborhood disadvantage. But now White SIP families also exhibit a nonstatistically significant association with adult income, net of observed and unobserved confounders. Meanwhile, Latinos from SIP families experience a 36.87 percent statistically significant decrease in adult earnings, net of observed and unobserved confounders. The magnitude of the association for Latinos is largely unchanged from the more moderate operationalization of neighborhood disadvantage presented in Table 3. Interestingly, these results exactly parallel the racial and ethnic gradient from the MTO—where only Latinos exhibit a statistically significant neighborhood effect on earnings later in life (Chetty et al. 2016).
Multigenerational Exposure to Acute Neighborhood Disadvantage and G3’s Adult Logged Income by Race/Ethnicity.
Source. NLSY79 1979–2014; NLSY:CYA 1986–2014.
Note. Coefficients are shown. The reference category is neither parent nor child were exposed. Standard errors (in parentheses) are corrected for clustering. NLSY = National Longitudinal Survey of Youth; CYA = Children and Young Adult.
p < .10. *p < .05. **p < .01. ***p < .001. (two-tailed test)
Conclusion
As durable structures of inequality, neighborhoods cast a long shadow on the lives of individuals and their children (Sharkey 2008). Using unique panel data that incorporate neighborhood locations and sociodemographic characteristics over multiple generations of the same family, and by controlling for observed and unobserved confounders that reach back decades, we estimate multigenerational processes of families’ neighborhood trajectories on economic outcomes. We contribute to the emerging literature that examines the intergenerational roots of inequality and unite it with the literatures on neighborhood effects and socioeconomic attainment and mobility (Mare 2011; Pfeffer and Killewald 2018; Sharkey 2008, 2013; Sharkey and Elwert 2011; Song and Mare 2019). We further contribute to the research on neighborhood effects by examining associations by race and ethnicity.
Our first major findings are that intergenerational and multigenerational exposures to neighborhood disadvantage are negatively associated with G3’s adult logged income. We find that these associations are robust to both observed and unobserved confounders rooted in G1. 18 Our findings align with previous research that has found that intragenerational neighborhood disadvantage reduces socioeconomic outcomes (Alvarado 2018; Chetty et al. 2016; Vartanian and Buck 2005), yet our findings disentangle effects from the child and parent generation. Our findings contribute to a multigenerational framework that highlights the way that the inequality we see today is rooted in generations of the past.
Our second, and perhaps most interesting, finding is that the association between multigenerational exposure to childhood neighborhood disadvantage and G3’s adult logged income follows a racial and ethnic gradient. Although White and Latino families demonstrate statistically significant negative associations between multigenerational exposure and G3’s adult logged income, Black families do not. It is important to note that this null finding for Black families is evident despite our finding of developmental outcome effects for Black children. In essence, our finding suggests that Black families that have experienced multigenerational exposure to childhood neighborhood disadvantage and Black families that have not yield similar incomes for their children. 19 Our finding aligns with the single-generation findings of Chetty et al. (2016) and Chetty et al. (2020) who both find null or weaker MTO effects on income for Blacks. These results also parallel previous studies that have found that Blacks do not benefit as much as Whites and Latinos from neighborhoods in terms of childhood educational outcomes (Brooks-Gunn et al. 1993), adult incarceration (Alvarado 2020), and adult earnings (Chetty et al. 2016, 2020).
To explain these results, we rely on the theoretical model of perverse openness (Duncan 1969) wherein race matters more than class origins in predicting Black economic mobility in the United States. We argue that discrimination in the labor market may mute the association between multigenerational neighborhood disadvantage and G3’s adult logged income. The U.S. economy may be biased against Black workers to such a degree that neighborhood mobility is rendered incapable of producing the sizeable differences in incomes that we see for White, and even Latino, workers. Recent audit studies echo this finding and demonstrate the unique disadvantages that Black workers face in the U.S. labor market (Bertrand and Mullainathan 2004; Gaddis 2015; Pager 2003, 2008).
Scholars and policy makers must bear in mind that structural discrimination in the labor market systematically and acutely marginalizes Black individuals from the social and economic fabric of society—likely regardless of their family, neighborhood, or class origins. Previous studies that have found null economic effects for moving mainly Black residents out of poor neighborhoods into less-poor neighborhoods may have confronted exactly the types of challenges that we theorize could limit the benefits of neighborhood socioeconomic mobility for Black families (Clampet-Lundquist and Massey 2008; Katz et al. 2001; Kling et al. 2007; Ludwig et al. 2013).
We argue that structural change in the way that Black individuals are treated in the U.S. labor market is necessary to increase their economic incorporation. Calls to simply move Black residents to better neighborhoods may underestimate the deeply rooted structural racism that besets their economic success. Place-based interventions that are focused on Black neighborhoods are unlikely to have significant impact on racial income gaps, absent broader changes that reduce the racism that Blacks experience in the labor market.
Still, alternative explanations remain. For instance, Blacks who move to better neighborhoods continue to face housing discrimination and often live in adjacent, albeit less-poor, neighborhoods. Mobile Blacks often sustain social networks in poor neighborhoods and may reside within close geographic proximity to economically distressed labor markets (Clampet-Lundquist and Massey 2008; Patillo 1999; Reardon et al. 2015; Sampson 2008). Social networks could retain some of the negative influence of disadvantaged neighborhoods, thus driving down earnings for residentially mobile Blacks. Jobs with limited earnings potential could also continue to limit Blacks’ ability to expand their incomes if the better neighborhoods they move to are within the same local labor market. Finally, neighborhoods could still matter in important ways for the quality of Black people’s lives beyond their incomes (e.g., through socioemotional well-being, physical health, and educational attainment) even if neighborhood quality does not propel Black children’s incomes later in life. Indeed, our falsification test reveals that there are various ways that sustained exposure to concentrated disadvantage can matter for important developmental outcomes among Black children.
Our study is not without limitations. First, despite being able to account for fixed unobserved confounders nested in G1, our cousin FE models do not completely eradicate all sources of bias. Second, our sample excludes many from the original NLSY79 sample—namely, all males and childless females. Third, we rely on self-reported income that is susceptible to measurement error. Fourth, we do not account for collider bias that could also affect our results. Fifth, we cannot account for paternal grandparental unobserved confounding.
In summary, we propose that neighborhood scholars increasingly shift their thinking away from a purely single-generation approach toward a broader multigenerational approach that considers how previous generations may play an essential role in explaining current inequalities in well-being. Our second proposal is that more researchers consider how race and ethnicity may moderate neighborhood associations. Black residents may face limits to the benefits of moving to “opportunity neighborhoods” because racism and discrimination are omnipresent in the labor market. Therefore, we argue that the effects of neighborhoods likely echo across the generations for some, but are also sometimes muted for others by rampant racism that permeates and persists simultaneously.
Footnotes
Appendix A
Appendix B
Appendix C
Multigenerational Exposure to Neighborhood Disadvantage and G3’s Adult Logged Income by Race/Ethnicity: Bivariate Associations.
| (1) |
|
|---|---|
| Ascending families: G2 childhood neighborhood disadvantage only | −0.06**
(0.02) |
| Descending families: G3 childhood neighborhood disadvantage only | −0.28***
(0.02) |
| Stuck-in-place families: Both generations (G2 and G3) exposed in childhood | −0.34***
(0.02) |
| Constant | 10.66***
(0.01) |
| Observations | 4,760 |
Source. NLSY79 1979–2014; NLSY:CYA 1986–2014.
Note. Coefficients are shown. The reference category is neither parent nor child were exposed. Robust bootstrapped standard errors (in parentheses) are corrected for clustering. NLSY = National Longitudinal Survey of Youth; CYA = Children and Young Adult.
p < .10. *p < .05. **p < .01. ***p < .001. (two-tailed test)
Appendix D
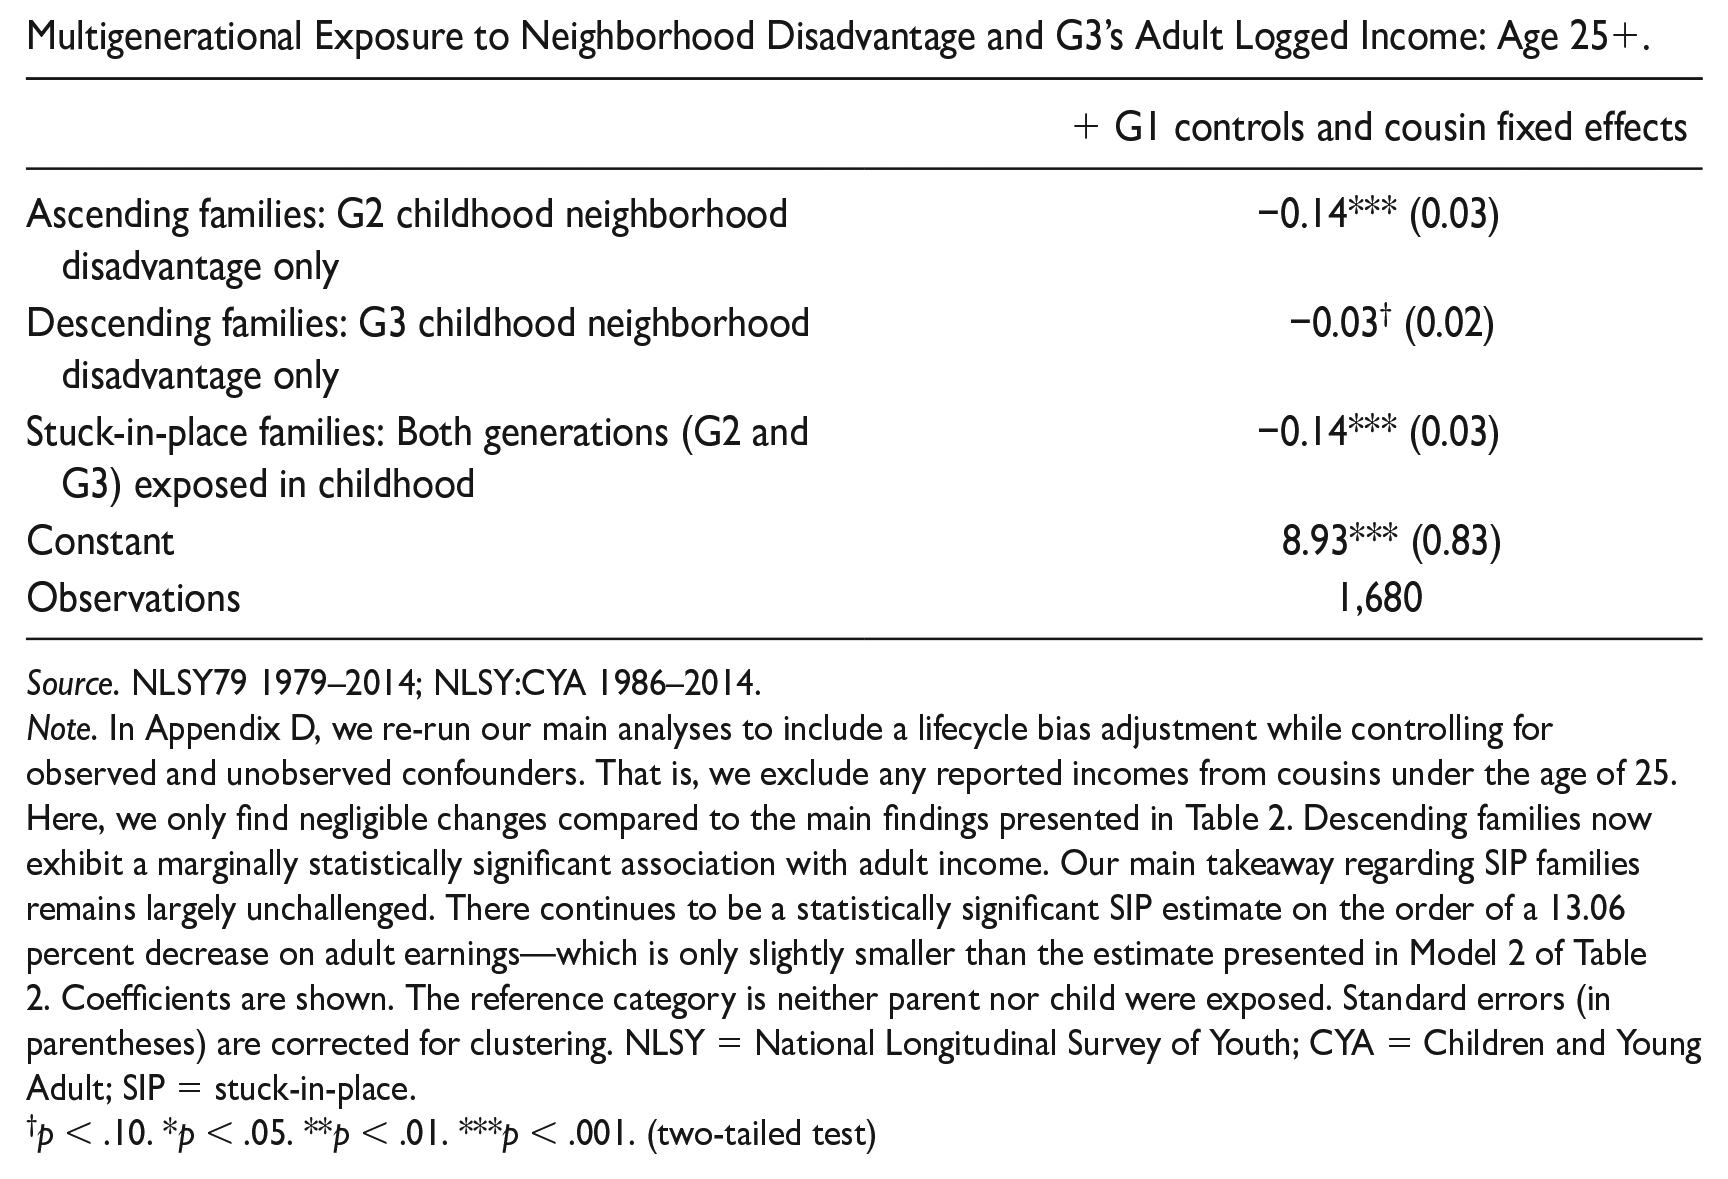
Multigenerational Exposure to Neighborhood Disadvantage and G3’s Adult Logged Income: Age 25+.
| + G1 controls and cousin fixed effects | |
|---|---|
| Ascending families: G2 childhood neighborhood disadvantage only | −0.14*** (0.03) |
| Descending families: G3 childhood neighborhood disadvantage only | −0.03 † (0.02) |
| Stuck-in-place families: Both generations (G2 and G3) exposed in childhood | −0.14*** (0.03) |
| Constant | 8.93*** (0.83) |
| Observations | 1,680 |
Source. NLSY79 1979–2014; NLSY:CYA 1986–2014.
Note. In Appendix D, we re-run our main analyses to include a lifecycle bias adjustment while controlling for observed and unobserved confounders. That is, we exclude any reported incomes from cousins under the age of 25. Here, we only find negligible changes compared to the main findings presented in Table 2. Descending families now exhibit a marginally statistically significant association with adult income. Our main takeaway regarding SIP families remains largely unchallenged. There continues to be a statistically significant SIP estimate on the order of a 13.06 percent decrease on adult earnings—which is only slightly smaller than the estimate presented in Model 2 of Table 2. Coefficients are shown. The reference category is neither parent nor child were exposed. Standard errors (in parentheses) are corrected for clustering. NLSY = National Longitudinal Survey of Youth; CYA = Children and Young Adult; SIP = stuck-in-place.
p < .10. *p < .05. **p < .01. ***p < .001. (two-tailed test)
Appendix E
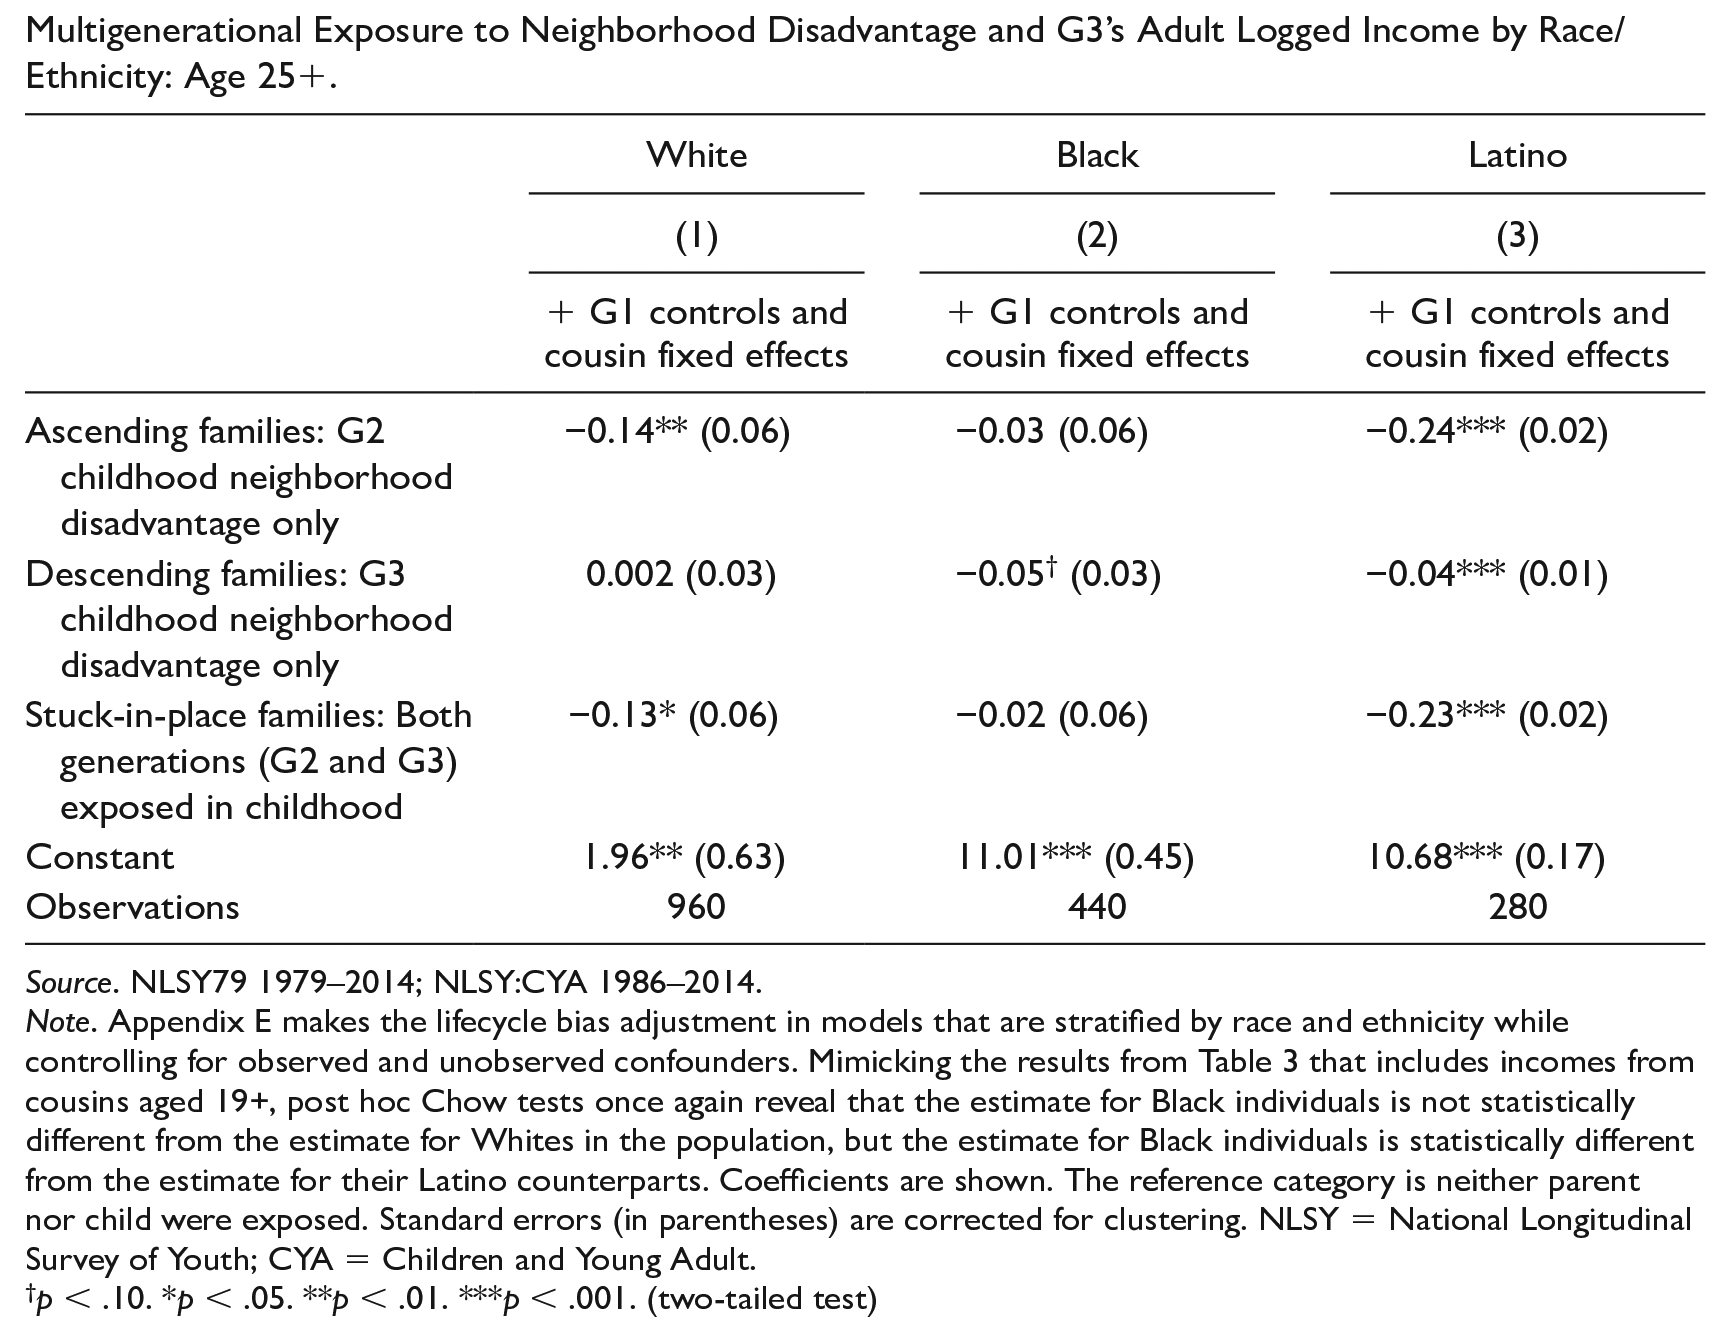
Multigenerational Exposure to Neighborhood Disadvantage and G3’s Adult Logged Income by Race/Ethnicity: Age 25+.
| White |
Black |
Latino |
|
|---|---|---|---|
| (1) | (2) | (3) | |
| + G1 controls and cousin fixed effects | + G1 controls and cousin fixed effects | + G1 controls and cousin fixed effects | |
| Ascending families: G2 childhood neighborhood disadvantage only | −0.14** (0.06) | −0.03 (0.06) | −0.24*** (0.02) |
| Descending families: G3 childhood neighborhood disadvantage only | 0.002 (0.03) | −0.05 † (0.03) | −0.04*** (0.01) |
| Stuck-in-place families: Both generations (G2 and G3) exposed in childhood | −0.13* (0.06) | −0.02 (0.06) | −0.23*** (0.02) |
| Constant | 1.96** (0.63) | 11.01*** (0.45) | 10.68*** (0.17) |
| Observations | 960 | 440 | 280 |
Source. NLSY79 1979–2014; NLSY:CYA 1986–2014.
Note. Appendix E makes the lifecycle bias adjustment in models that are stratified by race and ethnicity while controlling for observed and unobserved confounders. Mimicking the results from Table 3 that includes incomes from cousins aged 19+, post hoc Chow tests once again reveal that the estimate for Black individuals is not statistically different from the estimate for Whites in the population, but the estimate for Black individuals is statistically different from the estimate for their Latino counterparts. Coefficients are shown. The reference category is neither parent nor child were exposed. Standard errors (in parentheses) are corrected for clustering. NLSY = National Longitudinal Survey of Youth; CYA = Children and Young Adult.
p < .10. *p < .05. **p < .01. ***p < .001. (two-tailed test)
Appendix F
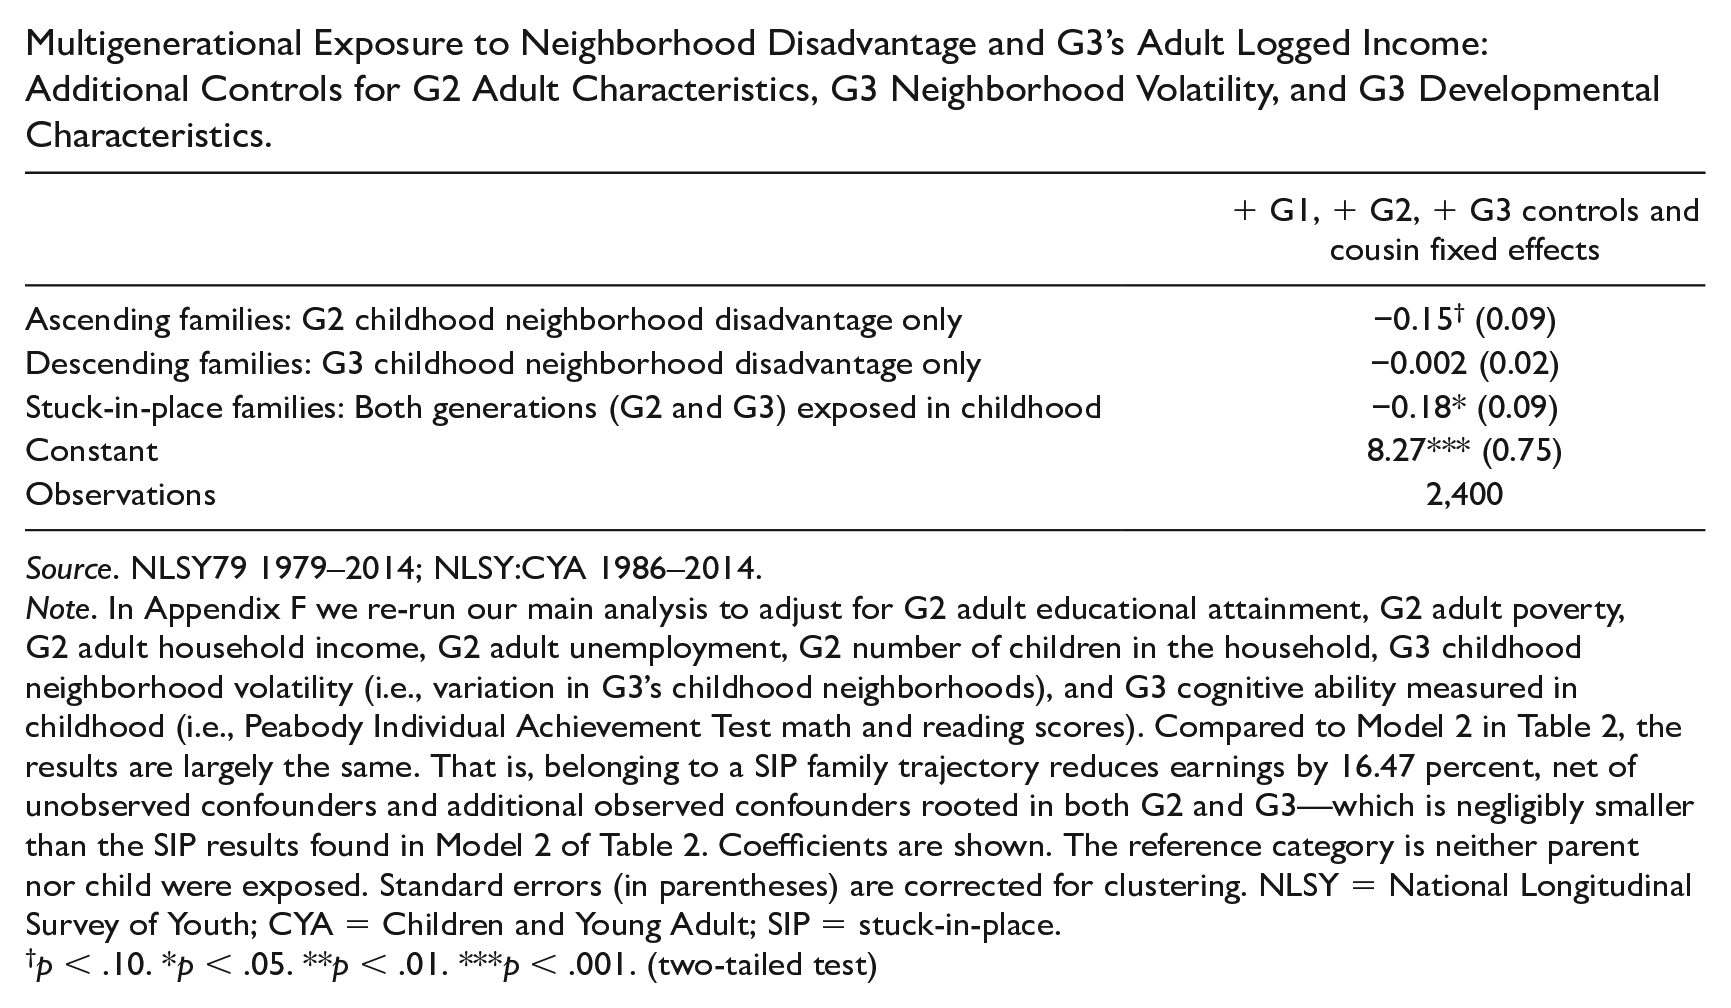
Multigenerational Exposure to Neighborhood Disadvantage and G3’s Adult Logged Income: Additional Controls for G2 Adult Characteristics, G3 Neighborhood Volatility, and G3 Developmental Characteristics.
| + G1, + G2, + G3 controls and cousin fixed effects | |
|---|---|
| Ascending families: G2 childhood neighborhood disadvantage only | −0.15 † (0.09) |
| Descending families: G3 childhood neighborhood disadvantage only | −0.002 (0.02) |
| Stuck-in-place families: Both generations (G2 and G3) exposed in childhood | −0.18* (0.09) |
| Constant | 8.27*** (0.75) |
| Observations | 2,400 |
Source. NLSY79 1979–2014; NLSY:CYA 1986–2014.
Note. In Appendix F we re-run our main analysis to adjust for G2 adult educational attainment, G2 adult poverty, G2 adult household income, G2 adult unemployment, G2 number of children in the household, G3 childhood neighborhood volatility (i.e., variation in G3’s childhood neighborhoods), and G3 cognitive ability measured in childhood (i.e., Peabody Individual Achievement Test math and reading scores). Compared to Model 2 in Table 2, the results are largely the same. That is, belonging to a SIP family trajectory reduces earnings by 16.47 percent, net of unobserved confounders and additional observed confounders rooted in both G2 and G3—which is negligibly smaller than the SIP results found in Model 2 of Table 2. Coefficients are shown. The reference category is neither parent nor child were exposed. Standard errors (in parentheses) are corrected for clustering. NLSY = National Longitudinal Survey of Youth; CYA = Children and Young Adult; SIP = stuck-in-place.
p < .10. *p < .05. **p < .01. ***p < .001. (two-tailed test)
Appendix G
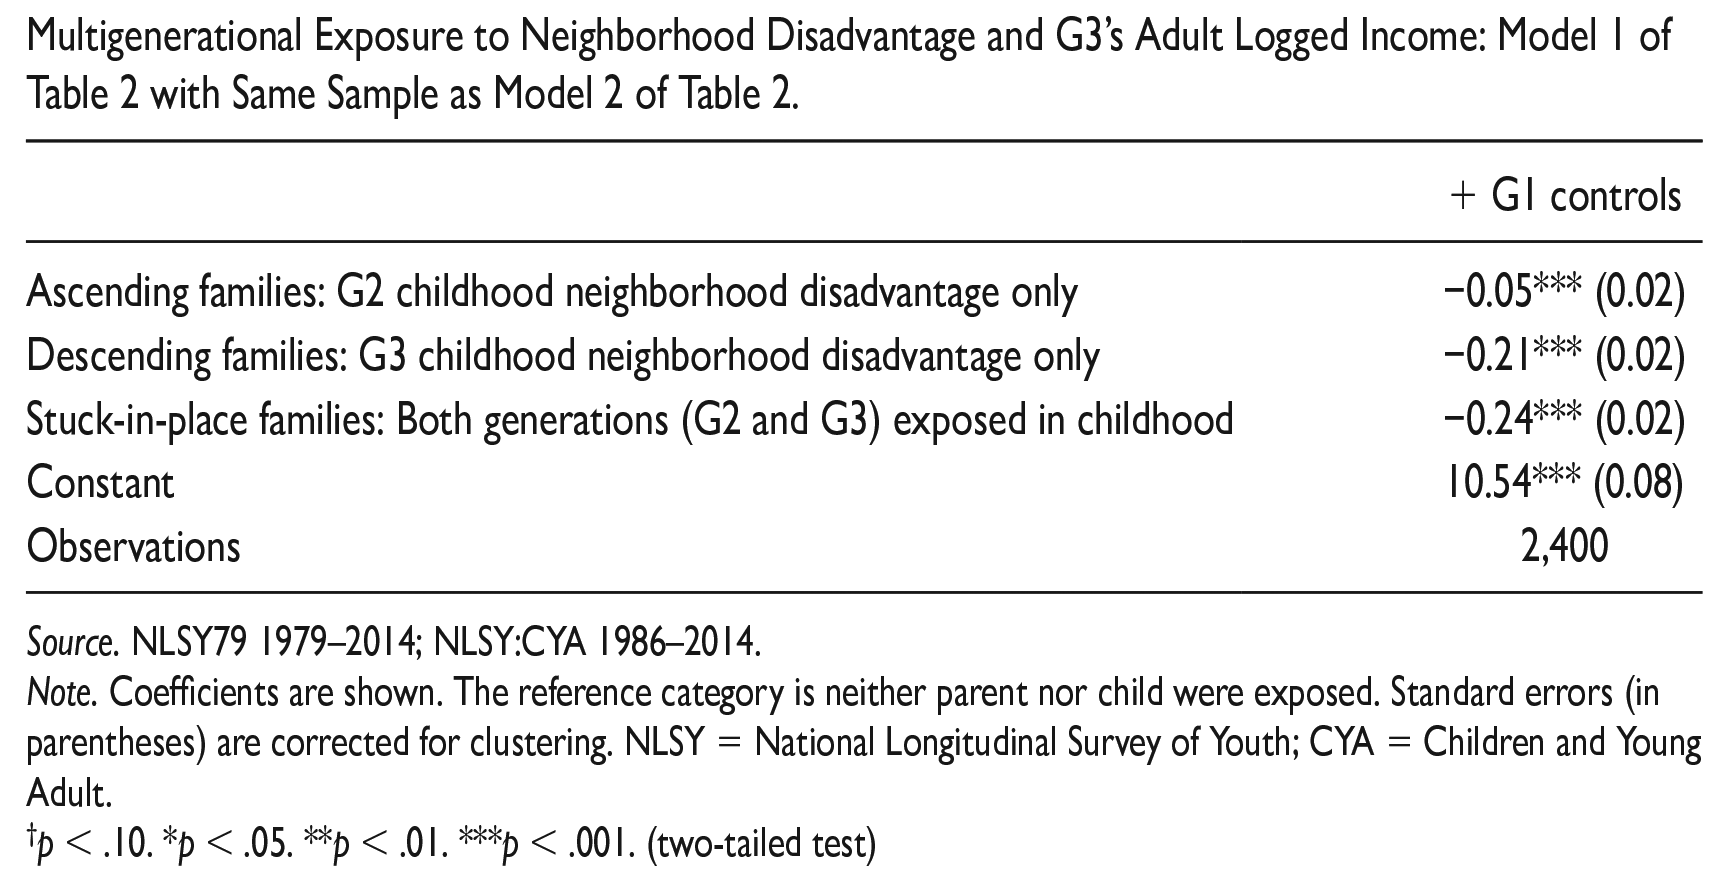
Multigenerational Exposure to Neighborhood Disadvantage and G3’s Adult Logged Income: Model 1 of Table 2 with Same Sample as Model 2 of Table 2.
| + G1 controls | |
|---|---|
| Ascending families: G2 childhood neighborhood disadvantage only | −0.05*** (0.02) |
| Descending families: G3 childhood neighborhood disadvantage only | −0.21*** (0.02) |
| Stuck-in-place families: Both generations (G2 and G3) exposed in childhood | −0.24*** (0.02) |
| Constant | 10.54*** (0.08) |
| Observations | 2,400 |
Source. NLSY79 1979–2014; NLSY:CYA 1986–2014.
Note. Coefficients are shown. The reference category is neither parent nor child were exposed. Standard errors (in parentheses) are corrected for clustering. NLSY = National Longitudinal Survey of Youth; CYA = Children and Young Adult.
p < .10. *p < .05. **p < .01. ***p < .001. (two-tailed test)
Appendix H
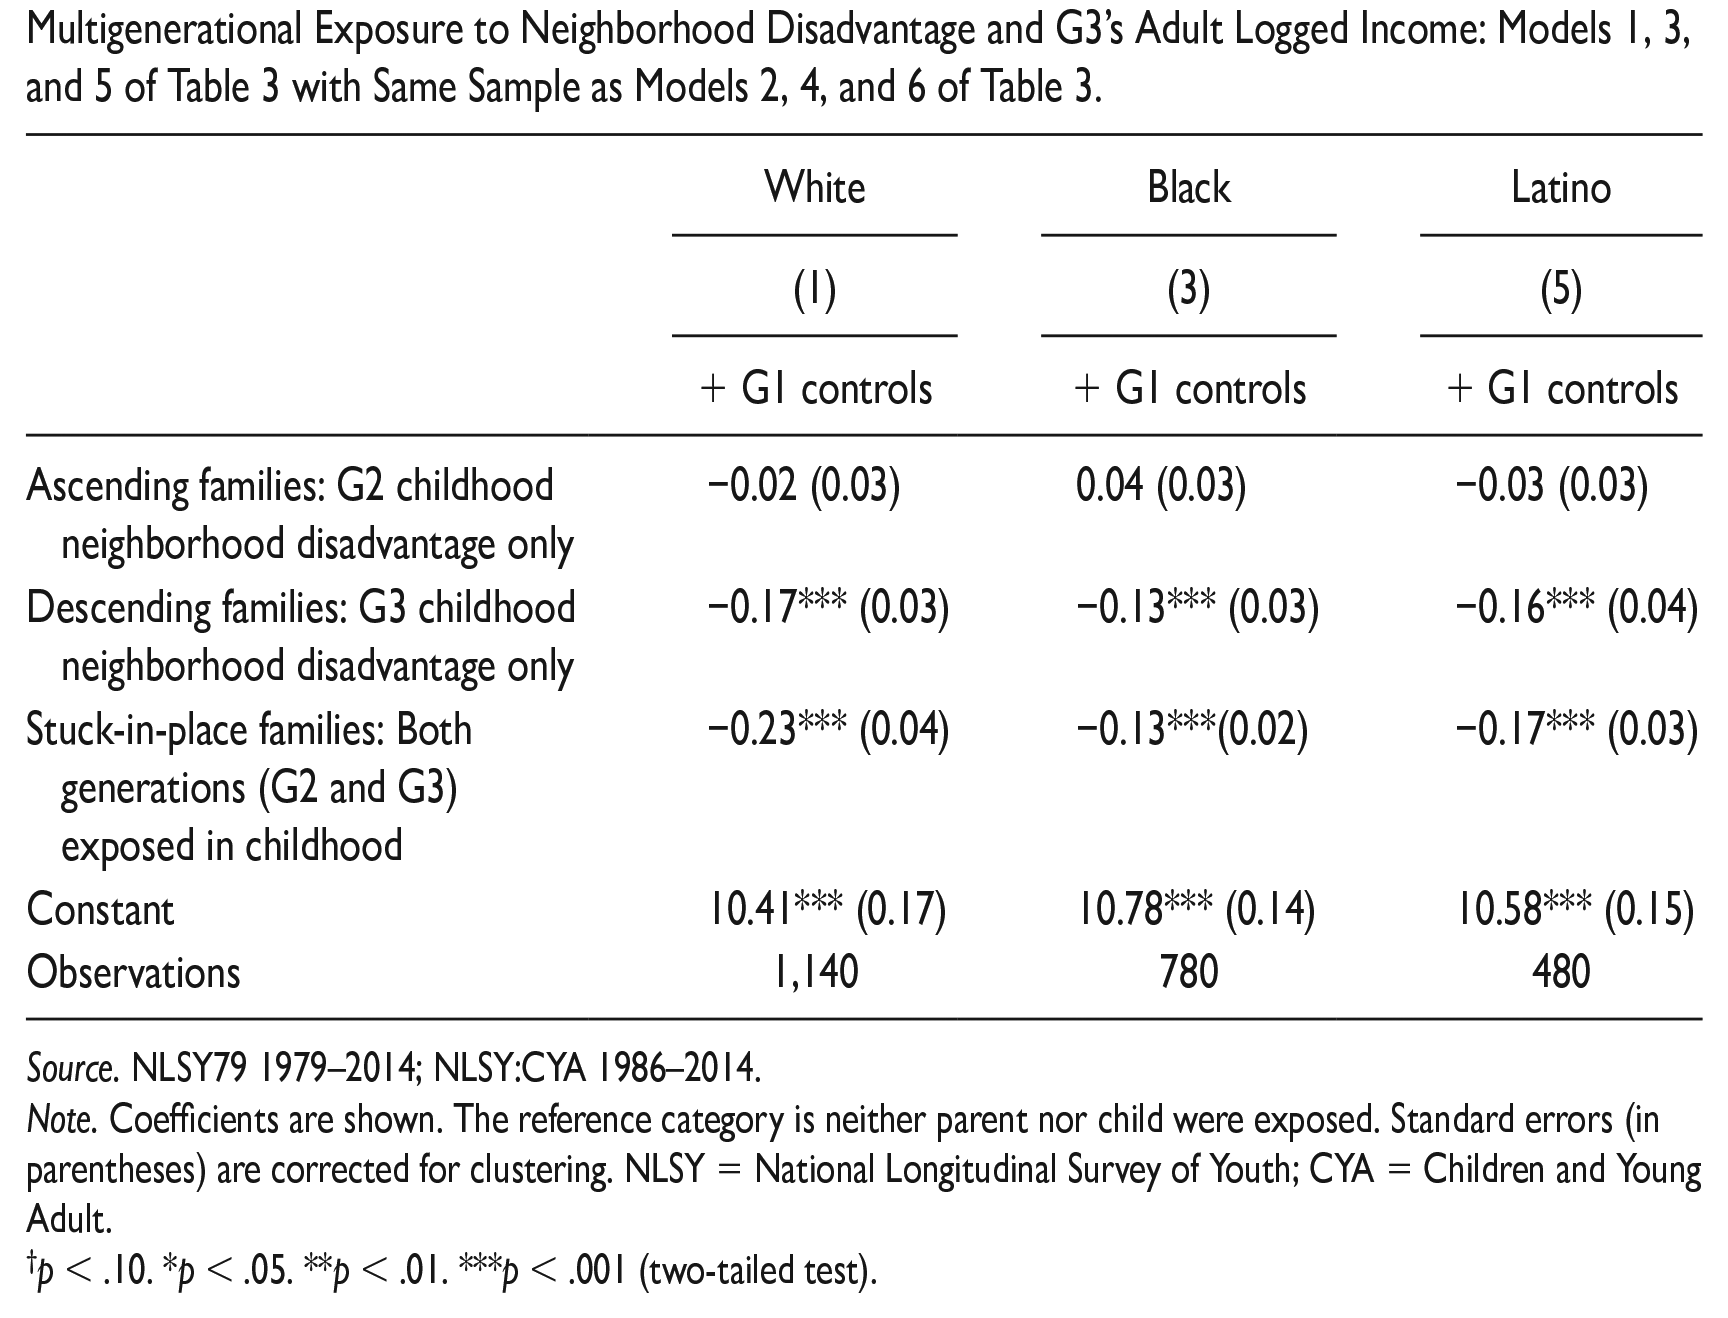
Multigenerational Exposure to Neighborhood Disadvantage and G3’s Adult Logged Income: Models 1, 3, and 5 of Table 3 with Same Sample as Models 2, 4, and 6 of Table 3.
| White | Black | Latino | |
|---|---|---|---|
| (1) | (3) | (5) | |
| + G1 controls | + G1 controls | + G1 controls | |
| Ascending families: G2 childhood neighborhood disadvantage only | −0.02 (0.03) | 0.04 (0.03) | −0.03 (0.03) |
| Descending families: G3 childhood neighborhood disadvantage only | −0.17*** (0.03) | −0.13*** (0.03) | −0.16*** (0.04) |
| Stuck-in-place families: Both generations (G2 and G3) exposed in childhood | −0.23*** (0.04) | −0.13***(0.02) | −0.17*** (0.03) |
| Constant | 10.41*** (0.17) | 10.78*** (0.14) | 10.58*** (0.15) |
| Observations | 1,140 | 780 | 480 |
Source. NLSY79 1979–2014; NLSY:CYA 1986–2014.
Note. Coefficients are shown. The reference category is neither parent nor child were exposed. Standard errors (in parentheses) are corrected for clustering. NLSY = National Longitudinal Survey of Youth; CYA = Children and Young Adult.
p < .10. *p < .05. **p < .01. ***p < .001 (two-tailed test).
Acknowledgements
We thank audiences at the 2022 Population Association of America Annual Meetings in Atlanta, GA, the 2022 American Sociological Association Annual Meetings in Los Angeles, CA, and the 2022 RC28 Annual Meetings in South Bend, IN for helpful comments. This research was conducted with special data access from the United States Bureau of Labor Statistics (BLS) and the U.S. Census Bureau. The views expressed here do not necessarily reflect the views of the BLS or the Census. All analyses using BLS restricted geocoded data were conducted on encrypted machines at U.S. Census Bureau Federal Statistical Research Data Centers at Cornell University, The Federal Reserve Bank of Chicago, and at the University of California, Los Angeles. All errors belong to the authors alone.